

Key Insights
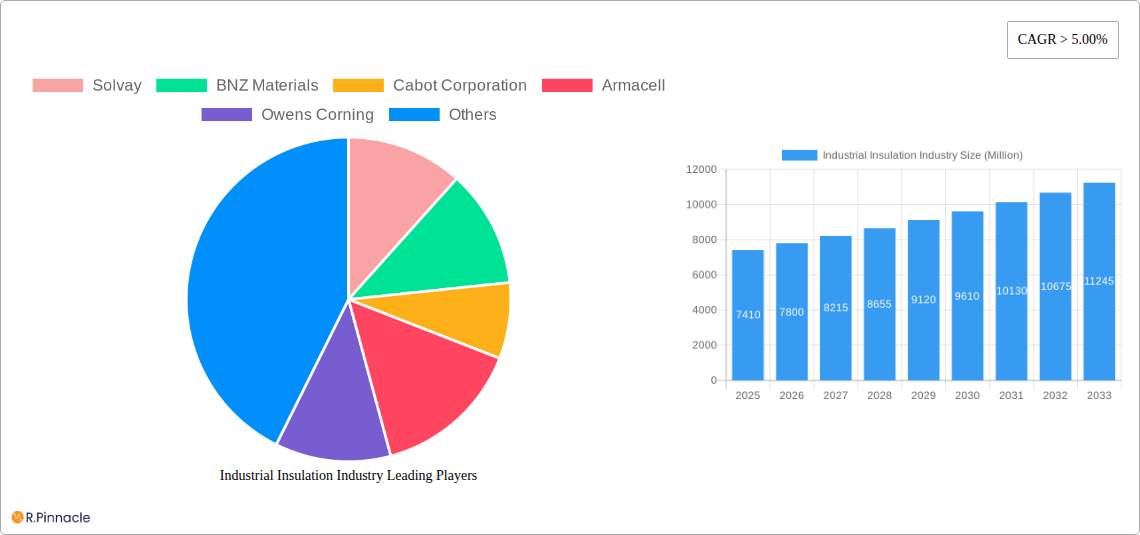
The industrial insulation market, valued at $7.41 billion in 2025, is projected to experience robust growth, exceeding a 5% CAGR through 2033. This expansion is fueled by several key drivers. Increasing energy efficiency regulations across various industries, particularly in construction, power generation, and oil & gas, are compelling businesses to invest in advanced insulation solutions to minimize energy loss and operational costs. Furthermore, the growing adoption of sustainable and eco-friendly insulation materials, such as mineral wool and recycled content products, is contributing to market growth. The construction sector, experiencing a global surge in infrastructure development and building projects, represents a significant market segment, driving demand for insulation materials like fiberglass and foam plastics. Technological advancements in insulation technology, including the development of high-performance materials with improved thermal properties and durability, are also bolstering market expansion. However, fluctuating raw material prices and supply chain disruptions pose challenges to consistent market growth. Competition among established players and emerging manufacturers is intensifying, leading to pricing pressure and the need for continuous innovation to retain market share.
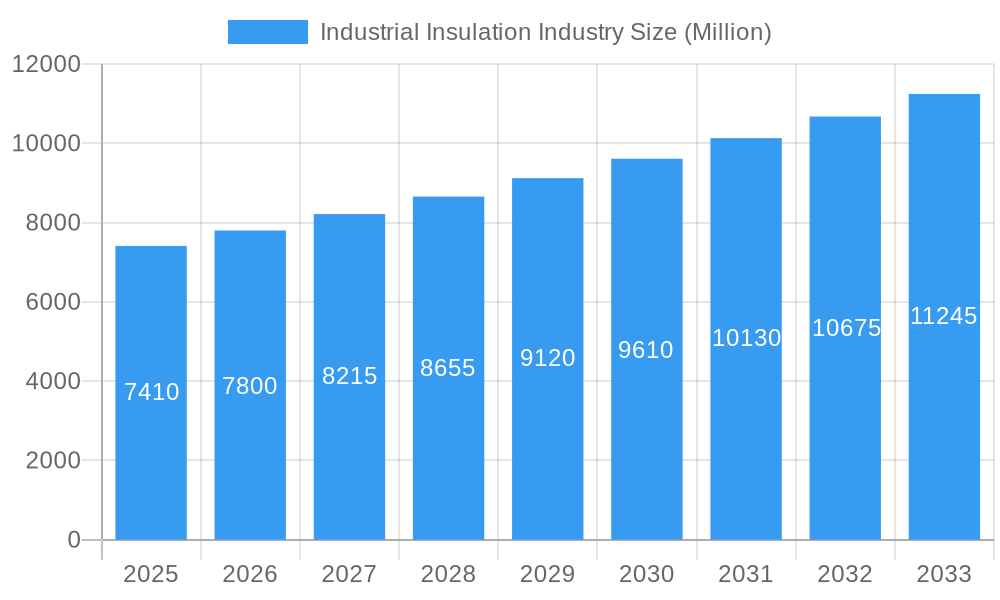
Industrial Insulation Industry Market Size (In Billion)
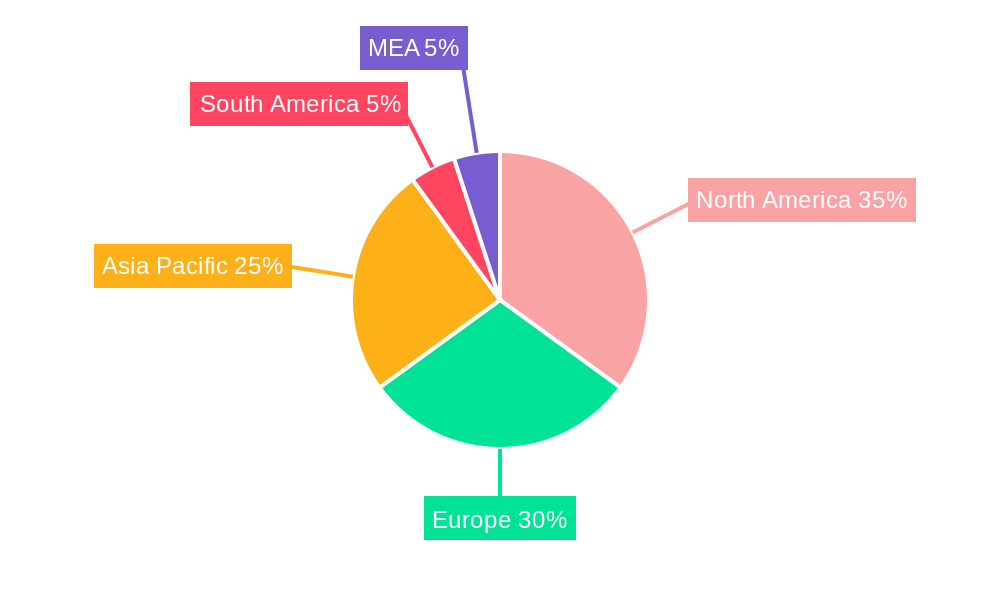
Despite these restraints, the market's segmentation presents opportunities for focused growth. Mineral wool and fiberglass continue to dominate the insulation material segment due to their established performance and cost-effectiveness. However, foamed plastics are gaining traction owing to their versatility and ease of application. The blanket and board formats are widely used across diverse end-user industries, while pipe insulation shows promise in specialized applications within the oil and gas sector. Geographically, North America and Europe currently hold significant market shares, driven by stringent energy regulations and established infrastructure. However, the Asia-Pacific region is projected to demonstrate the fastest growth in the forecast period, fueled by rapid industrialization and urbanization. Leading companies, including Solvay, Owens Corning, and BASF, are strategically investing in research and development to innovate and expand their product portfolios to meet evolving market demands. The long-term outlook for the industrial insulation market remains positive, with continued growth driven by the interplay of technological advancements, regulatory pressures, and global infrastructure development.
Industrial Insulation Industry Company Market Share
Industrial Insulation Industry Market Report: 2019-2033
This comprehensive report provides an in-depth analysis of the global industrial insulation market, projecting a robust growth trajectory from 2025 to 2033. Valued at $XX million in 2025, the market is poised for significant expansion, driven by technological advancements, burgeoning construction activities, and stringent energy efficiency regulations. This report offers actionable insights for industry professionals, investors, and stakeholders seeking to navigate this dynamic landscape. The study period covers 2019-2033, with 2025 as the base and estimated year.
Industrial Insulation Industry Market Structure & Innovation Trends
The industrial insulation market exhibits a moderately concentrated structure, with key players like Solvay, BNZ Materials, Cabot Corporation, Armacell, Owens Corning, BASF SE, Rockwool A/S, Knauf Insulation, Temati Group, INSUL-FAB, Johns Manville-Berkshire Hathway Company, and Jays Refractory Specialists holding significant market shares. Market share data for 2025 indicates that the top 5 players account for approximately 40% of the global market.
Innovation is driven by the need for improved energy efficiency, stricter environmental regulations, and the development of advanced materials with enhanced thermal performance and durability. Regulatory frameworks, such as those promoting energy conservation and reducing carbon emissions, significantly influence market growth. The increasing adoption of sustainable and eco-friendly insulation materials is a prominent trend. Product substitutes, such as aerogels and vacuum insulation panels, are emerging but currently hold a small market share.
Mergers and acquisitions (M&A) are common, exemplified by BEWI's acquisition of Aislamientos y Envases SL in November 2022, demonstrating strategic expansion within the sector. The total value of M&A deals within the last five years is estimated to be $XX million, with an average deal size of $XX million.
Industrial Insulation Industry Market Dynamics & Trends
The industrial insulation market is experiencing robust growth, with a projected Compound Annual Growth Rate (CAGR) of XX% during the forecast period (2025-2033). This growth is fueled by several key factors: the expanding construction sector globally, particularly in developing economies; increasing demand for energy-efficient buildings and industrial facilities; rising energy costs prompting greater investment in insulation solutions; and stringent government regulations promoting energy conservation.
Technological advancements, including the development of innovative insulation materials with improved thermal performance and reduced environmental impact, are further driving market expansion. Consumer preferences are shifting toward sustainable and eco-friendly options, creating opportunities for manufacturers offering such products. Competitive dynamics are characterized by product differentiation, technological innovation, and strategic partnerships. Market penetration for advanced insulation materials is growing rapidly, with estimates suggesting a XX% increase in adoption over the next five years.
Dominant Regions & Segments in Industrial Insulation Industry
The Construction end-user industry dominates the global market, representing approximately 45% of the total market value in 2025. This is followed by the Oil and Gas and Chemical and Petrochemical sectors. Within insulation materials, Mineral Wool holds the largest market share (approximately 35%), followed by Fiber Glass and Foamed Plastics. The Blanket product type is the most widely used, followed by Pipe and Board.
- Key Drivers for Construction: Robust infrastructure development in emerging economies, increasing urbanization, and government initiatives promoting energy-efficient buildings.
- Key Drivers for Oil and Gas: Expansion of oil and gas exploration and production activities, coupled with stringent safety and environmental regulations.
- Key Drivers for Mineral Wool: Superior thermal performance, fire resistance, and cost-effectiveness compared to other insulation materials.
- Key Drivers for Fiber Glass: Wide availability, versatility, and suitability for various applications.
Geographically, North America and Europe represent the largest markets, driven by strong construction activities and stringent energy regulations. However, the Asia-Pacific region is witnessing the fastest growth due to rapid industrialization and urbanization.
Industrial Insulation Industry Product Innovations
Recent product innovations focus on enhancing thermal performance, reducing environmental impact, and improving ease of installation. The emergence of high-performance insulation materials, such as vacuum insulation panels and aerogels, is disrupting the market. These materials offer superior thermal efficiency compared to traditional options, but their higher cost limits wider adoption. Companies are focusing on developing sustainable insulation materials from recycled content and with lower embodied carbon footprints to meet the growing demand for eco-friendly products.
Report Scope & Segmentation Analysis
This report offers an in-depth segmentation analysis of the industrial insulation industry, examining key market segments across various critical dimensions to provide a holistic understanding of market dynamics and opportunities.
Insulation Material: The market is segmented into Mineral Wool, Fiber Glass, Foamed Plastics, Calcium Silicate, and Other Insulation Materials. Each segment is rigorously analyzed based on its current market size, projected growth rate, and the competitive landscape. Growth projections highlight a significant upward trend for eco-friendly and advanced materials, including aerogels, recycled content options, and high-performance syntactic foams, driven by increasing environmental consciousness and regulatory pressures.
Product: Key product categories include Blanket, Board, Pipe, and Other Products. We assess the market size and competitive dynamics within each product type, identifying dominant manufacturers and their respective market shares. The analysis also focuses on the adoption rates and growth potential of specialized insulation products designed for extreme conditions or specific application requirements.
End-user Industry: Major end-user industries covered are Automotive, Chemical and Petrochemical, Construction, Electrical and Electronics, Oil and Gas, Power Generation, and Other End-user Industries. Detailed analysis of specific applications, demand trends, and the unique requirements of each sector is provided, with particular attention paid to the evolving regulatory landscape and the drive for enhanced safety and operational efficiency.
Key Drivers of Industrial Insulation Industry Growth
The robust growth of the industrial insulation market is propelled by a confluence of significant factors. Paramount among these are increasingly stringent global energy efficiency regulations and standards, which mandate improved thermal performance across industrial and commercial applications. This is further amplified by the escalating demand for energy-efficient buildings and infrastructure projects, particularly in rapidly developing economies. Escalating energy costs globally also incentivize industries to invest in insulation solutions to reduce operational expenses and carbon footprints. Furthermore, continuous advancements in insulation material technology are yielding products with superior thermal performance, enhanced durability, and a reduced environmental impact. The development of innovative materials and manufacturing processes is a key contributor to this trend. Government incentives and policies promoting energy conservation, the adoption of sustainable building practices, and the transition to cleaner energy sources also provide a substantial boost to market expansion.
Challenges in the Industrial Insulation Industry Sector
The industrial insulation industry faces challenges such as fluctuating raw material prices, increasing competition, stringent environmental regulations requiring compliance and potentially impacting production costs, and disruptions to supply chains caused by geopolitical events or natural disasters. These factors collectively contribute to increased production and operational costs and reduce profitability. These challenges necessitate innovative solutions and strategic adaptation by industry players to maintain market share and profitability. The total estimated impact of these challenges on market growth is around XX%.
Emerging Opportunities in Industrial Insulation Industry
The industrial insulation market presents several emerging opportunities: The increasing adoption of sustainable and eco-friendly insulation materials, the development of innovative insulation solutions for specific applications like high-temperature industrial processes, and the expansion into new and developing markets with growing infrastructure needs and a focus on sustainable development all offer significant opportunities. Additionally, technological advancements in smart insulation systems provide further opportunities for growth and expansion.
Leading Players in the Industrial Insulation Industry Market
- Solvay
- BNZ Materials
- Cabot Corporation
- Armacell
- Owens Corning
- BASF SE
- Rockwool A/S
- Knauf Insulation
- Temati Group
- INSUL-FAB
- Johns Manville - Berkshire Hathaway Company
- Jays Refractory Specialists
- 3M Company
- Kingspan Group
- Saint-Gobain
Key Developments in Industrial Insulation Industry Industry
- November 2022: BEWI announced the acquisition of Aislamientos y Envases SL, a strategic move that significantly expands its geographic reach and strengthens its product portfolio within the Spanish market. This acquisition reinforces BEWI's commitment to consolidating its position and enhancing its offerings in the European insulation sector.
- October 2022: The Knauf Group revealed a substantial investment of approximately USD 133.4 million to augment its mineral wool production capacity in Romania. This investment underscores the group's dedication to expanding its manufacturing capabilities in key strategic markets and meeting the growing demand for its products.
- September 2022: Armacell introduced its new high-performance insulation material, "ArmaGel HT," designed for extreme temperature applications in industrial settings. This innovation aims to address critical needs for advanced thermal management in demanding environments.
- August 2022: Owens Corning expanded its sustainability initiatives by launching a new line of insulation products incorporating recycled materials, further demonstrating its commitment to eco-friendly solutions and the circular economy.
Future Outlook for Industrial Insulation Industry Market
The industrial insulation market is poised for sustained and significant growth in the coming years, fueled by ongoing global urbanization, substantial infrastructure development projects, and an ever-increasing demand for advanced energy-efficient solutions. Key strategic partnerships and collaborations are anticipated to play a pivotal role in driving innovation and market penetration. Technological advancements, with a strong focus on developing sustainable materials with enhanced thermal performance and extended lifespans, will be critical for competitive advantage. Market players will also likely focus on expanding their presence into emerging economies and niche applications. The potential for market expansion is considerable, with expert projections indicating a substantial increase in market valuation and volume over the next decade, driven by evolving industry needs and a global imperative for resource efficiency and climate action.
Industrial Insulation Industry Segmentation
-
1. Insulation Material
- 1.1. Mineral Wool
- 1.2. Fiber Glass
- 1.3. Foamed Plastics
- 1.4. Calcium Silicate
- 1.5. Other Insulation Materials
-
2. Product
- 2.1. Blanket
- 2.2. Board
- 2.3. Pipe
- 2.4. Other Products
-
3. End-user Industry
- 3.1. Automotive
- 3.2. Chemical and Petrochemical
- 3.3. Construction
- 3.4. Electrical and Electronics
- 3.5. Oil and Gas
- 3.6. Power Generation
- 3.7. Other End-user Industries
Industrial Insulation Industry Segmentation By Geography
-
1. Asia Pacific
- 1.1. China
- 1.2. India
- 1.3. Japan
- 1.4. South Korea
- 1.5. Rest of Asia Pacific
-
2. North America
- 2.1. United States
- 2.2. Canada
- 2.3. Mexico
-
3. Europe
- 3.1. Germany
- 3.2. United Kingdom
- 3.3. France
- 3.4. Italy
- 3.5. Rest of Europe
-
4. South America
- 4.1. Brazil
- 4.2. Argentina
- 4.3. Rest of South America
- 5. Middle East
-
6. Saudi Arabia
- 6.1. South Africa
- 6.2. Rest of Middle East
Industrial Insulation Industry Regional Market Share
Geographic Coverage of Industrial Insulation Industry
Industrial Insulation Industry REPORT HIGHLIGHTS
| Aspects | Details |
|---|---|
| Study Period | 2020-2034 |
| Base Year | 2025 |
| Estimated Year | 2026 |
| Forecast Period | 2026-2034 |
| Historical Period | 2020-2025 |
| Growth Rate | CAGR of > 5.00% from 2020-2034 |
| Segmentation |
|
Table of Contents
- 1. Introduction
- 1.1. Research Scope
- 1.2. Market Segmentation
- 1.3. Research Objective
- 1.4. Definitions and Assumptions
- 2. Executive Summary
- 2.1. Market Snapshot
- 3. Market Dynamics
- 3.1. Market Drivers
- 3.2. Market Restrains
- 3.3. Market Trends
- 3.4. Market Opportunities
- 4. Market Factor Analysis
- 4.1. Porters Five Forces
- 4.1.1. Bargaining Power of Suppliers
- 4.1.2. Bargaining Power of Buyers
- 4.1.3. Threat of New Entrants
- 4.1.4. Threat of Substitutes
- 4.1.5. Competitive Rivalry
- 4.2. PESTEL analysis
- 4.3. BCG Analysis
- 4.3.1. Stars (High Growth, High Market Share)
- 4.3.2. Cash Cows (Low Growth, High Market Share)
- 4.3.3. Question Mark (High Growth, Low Market Share)
- 4.3.4. Dogs (Low Growth, Low Market Share)
- 4.4. Ansoff Matrix Analysis
- 4.5. Supply Chain Analysis
- 4.6. Regulatory Landscape
- 4.7. Current Market Potential and Opportunity Assessment (TAM–SAM–SOM Framework)
- 4.8. PRI Analyst Note
- 4.1. Porters Five Forces
- 5. Market Analysis, Insights and Forecast 2021-2033
- 5.1. Market Analysis, Insights and Forecast - by Insulation Material
- 5.1.1. Mineral Wool
- 5.1.2. Fiber Glass
- 5.1.3. Foamed Plastics
- 5.1.4. Calcium Silicate
- 5.1.5. Other Insulation Materials
- 5.2. Market Analysis, Insights and Forecast - by Product
- 5.2.1. Blanket
- 5.2.2. Board
- 5.2.3. Pipe
- 5.2.4. Other Products
- 5.3. Market Analysis, Insights and Forecast - by End-user Industry
- 5.3.1. Automotive
- 5.3.2. Chemical and Petrochemical
- 5.3.3. Construction
- 5.3.4. Electrical and Electronics
- 5.3.5. Oil and Gas
- 5.3.6. Power Generation
- 5.3.7. Other End-user Industries
- 5.4. Market Analysis, Insights and Forecast - by Region
- 5.4.1. Asia Pacific
- 5.4.2. North America
- 5.4.3. Europe
- 5.4.4. South America
- 5.4.5. Middle East
- 5.4.6. Saudi Arabia
- 5.1. Market Analysis, Insights and Forecast - by Insulation Material
- 6. Global Industrial Insulation Industry Analysis, Insights and Forecast, 2021-2033
- 6.1. Market Analysis, Insights and Forecast - by Insulation Material
- 6.1.1. Mineral Wool
- 6.1.2. Fiber Glass
- 6.1.3. Foamed Plastics
- 6.1.4. Calcium Silicate
- 6.1.5. Other Insulation Materials
- 6.2. Market Analysis, Insights and Forecast - by Product
- 6.2.1. Blanket
- 6.2.2. Board
- 6.2.3. Pipe
- 6.2.4. Other Products
- 6.3. Market Analysis, Insights and Forecast - by End-user Industry
- 6.3.1. Automotive
- 6.3.2. Chemical and Petrochemical
- 6.3.3. Construction
- 6.3.4. Electrical and Electronics
- 6.3.5. Oil and Gas
- 6.3.6. Power Generation
- 6.3.7. Other End-user Industries
- 6.1. Market Analysis, Insights and Forecast - by Insulation Material
- 7. Asia Pacific Industrial Insulation Industry Analysis, Insights and Forecast, 2020-2032
- 7.1. Market Analysis, Insights and Forecast - by Insulation Material
- 7.1.1. Mineral Wool
- 7.1.2. Fiber Glass
- 7.1.3. Foamed Plastics
- 7.1.4. Calcium Silicate
- 7.1.5. Other Insulation Materials
- 7.2. Market Analysis, Insights and Forecast - by Product
- 7.2.1. Blanket
- 7.2.2. Board
- 7.2.3. Pipe
- 7.2.4. Other Products
- 7.3. Market Analysis, Insights and Forecast - by End-user Industry
- 7.3.1. Automotive
- 7.3.2. Chemical and Petrochemical
- 7.3.3. Construction
- 7.3.4. Electrical and Electronics
- 7.3.5. Oil and Gas
- 7.3.6. Power Generation
- 7.3.7. Other End-user Industries
- 7.1. Market Analysis, Insights and Forecast - by Insulation Material
- 8. North America Industrial Insulation Industry Analysis, Insights and Forecast, 2020-2032
- 8.1. Market Analysis, Insights and Forecast - by Insulation Material
- 8.1.1. Mineral Wool
- 8.1.2. Fiber Glass
- 8.1.3. Foamed Plastics
- 8.1.4. Calcium Silicate
- 8.1.5. Other Insulation Materials
- 8.2. Market Analysis, Insights and Forecast - by Product
- 8.2.1. Blanket
- 8.2.2. Board
- 8.2.3. Pipe
- 8.2.4. Other Products
- 8.3. Market Analysis, Insights and Forecast - by End-user Industry
- 8.3.1. Automotive
- 8.3.2. Chemical and Petrochemical
- 8.3.3. Construction
- 8.3.4. Electrical and Electronics
- 8.3.5. Oil and Gas
- 8.3.6. Power Generation
- 8.3.7. Other End-user Industries
- 8.1. Market Analysis, Insights and Forecast - by Insulation Material
- 9. Europe Industrial Insulation Industry Analysis, Insights and Forecast, 2020-2032
- 9.1. Market Analysis, Insights and Forecast - by Insulation Material
- 9.1.1. Mineral Wool
- 9.1.2. Fiber Glass
- 9.1.3. Foamed Plastics
- 9.1.4. Calcium Silicate
- 9.1.5. Other Insulation Materials
- 9.2. Market Analysis, Insights and Forecast - by Product
- 9.2.1. Blanket
- 9.2.2. Board
- 9.2.3. Pipe
- 9.2.4. Other Products
- 9.3. Market Analysis, Insights and Forecast - by End-user Industry
- 9.3.1. Automotive
- 9.3.2. Chemical and Petrochemical
- 9.3.3. Construction
- 9.3.4. Electrical and Electronics
- 9.3.5. Oil and Gas
- 9.3.6. Power Generation
- 9.3.7. Other End-user Industries
- 9.1. Market Analysis, Insights and Forecast - by Insulation Material
- 10. South America Industrial Insulation Industry Analysis, Insights and Forecast, 2020-2032
- 10.1. Market Analysis, Insights and Forecast - by Insulation Material
- 10.1.1. Mineral Wool
- 10.1.2. Fiber Glass
- 10.1.3. Foamed Plastics
- 10.1.4. Calcium Silicate
- 10.1.5. Other Insulation Materials
- 10.2. Market Analysis, Insights and Forecast - by Product
- 10.2.1. Blanket
- 10.2.2. Board
- 10.2.3. Pipe
- 10.2.4. Other Products
- 10.3. Market Analysis, Insights and Forecast - by End-user Industry
- 10.3.1. Automotive
- 10.3.2. Chemical and Petrochemical
- 10.3.3. Construction
- 10.3.4. Electrical and Electronics
- 10.3.5. Oil and Gas
- 10.3.6. Power Generation
- 10.3.7. Other End-user Industries
- 10.1. Market Analysis, Insights and Forecast - by Insulation Material
- 11. Middle East Industrial Insulation Industry Analysis, Insights and Forecast, 2020-2032
- 11.1. Market Analysis, Insights and Forecast - by Insulation Material
- 11.1.1. Mineral Wool
- 11.1.2. Fiber Glass
- 11.1.3. Foamed Plastics
- 11.1.4. Calcium Silicate
- 11.1.5. Other Insulation Materials
- 11.2. Market Analysis, Insights and Forecast - by Product
- 11.2.1. Blanket
- 11.2.2. Board
- 11.2.3. Pipe
- 11.2.4. Other Products
- 11.3. Market Analysis, Insights and Forecast - by End-user Industry
- 11.3.1. Automotive
- 11.3.2. Chemical and Petrochemical
- 11.3.3. Construction
- 11.3.4. Electrical and Electronics
- 11.3.5. Oil and Gas
- 11.3.6. Power Generation
- 11.3.7. Other End-user Industries
- 11.1. Market Analysis, Insights and Forecast - by Insulation Material
- 12. Saudi Arabia Industrial Insulation Industry Analysis, Insights and Forecast, 2020-2032
- 12.1. Market Analysis, Insights and Forecast - by Insulation Material
- 12.1.1. Mineral Wool
- 12.1.2. Fiber Glass
- 12.1.3. Foamed Plastics
- 12.1.4. Calcium Silicate
- 12.1.5. Other Insulation Materials
- 12.2. Market Analysis, Insights and Forecast - by Product
- 12.2.1. Blanket
- 12.2.2. Board
- 12.2.3. Pipe
- 12.2.4. Other Products
- 12.3. Market Analysis, Insights and Forecast - by End-user Industry
- 12.3.1. Automotive
- 12.3.2. Chemical and Petrochemical
- 12.3.3. Construction
- 12.3.4. Electrical and Electronics
- 12.3.5. Oil and Gas
- 12.3.6. Power Generation
- 12.3.7. Other End-user Industries
- 12.1. Market Analysis, Insights and Forecast - by Insulation Material
- 13. Competitive Analysis
- 13.1. Company Profiles
- 13.1.1 Solvay
- 13.1.1.1. Company Overview
- 13.1.1.2. Products
- 13.1.1.3. Company Financials
- 13.1.1.4. SWOT Analysis
- 13.1.2 BNZ Materials
- 13.1.2.1. Company Overview
- 13.1.2.2. Products
- 13.1.2.3. Company Financials
- 13.1.2.4. SWOT Analysis
- 13.1.3 Cabot Corporation
- 13.1.3.1. Company Overview
- 13.1.3.2. Products
- 13.1.3.3. Company Financials
- 13.1.3.4. SWOT Analysis
- 13.1.4 Armacell
- 13.1.4.1. Company Overview
- 13.1.4.2. Products
- 13.1.4.3. Company Financials
- 13.1.4.4. SWOT Analysis
- 13.1.5 Owens Corning
- 13.1.5.1. Company Overview
- 13.1.5.2. Products
- 13.1.5.3. Company Financials
- 13.1.5.4. SWOT Analysis
- 13.1.6 BASF SE
- 13.1.6.1. Company Overview
- 13.1.6.2. Products
- 13.1.6.3. Company Financials
- 13.1.6.4. SWOT Analysis
- 13.1.7 Rockwool A/S
- 13.1.7.1. Company Overview
- 13.1.7.2. Products
- 13.1.7.3. Company Financials
- 13.1.7.4. SWOT Analysis
- 13.1.8 Knauf Insulation
- 13.1.8.1. Company Overview
- 13.1.8.2. Products
- 13.1.8.3. Company Financials
- 13.1.8.4. SWOT Analysis
- 13.1.9 Temati Group
- 13.1.9.1. Company Overview
- 13.1.9.2. Products
- 13.1.9.3. Company Financials
- 13.1.9.4. SWOT Analysis
- 13.1.10 INSUL-FAB
- 13.1.10.1. Company Overview
- 13.1.10.2. Products
- 13.1.10.3. Company Financials
- 13.1.10.4. SWOT Analysis
- 13.1.11 Johns Manville-Berkshire Hathway Company
- 13.1.11.1. Company Overview
- 13.1.11.2. Products
- 13.1.11.3. Company Financials
- 13.1.11.4. SWOT Analysis
- 13.1.12 Jays Refractory Specialists
- 13.1.12.1. Company Overview
- 13.1.12.2. Products
- 13.1.12.3. Company Financials
- 13.1.12.4. SWOT Analysis
- 13.1.1 Solvay
- 13.2. Market Entropy
- 13.2.1 Company's Key Areas Served
- 13.2.2 Recent Developments
- 13.3. Company Market Share Analysis 2025
- 13.3.1 Top 5 Companies Market Share Analysis
- 13.3.2 Top 3 Companies Market Share Analysis
- 13.4. List of Potential Customers
- 14. Research Methodology
List of Figures
- Figure 1: Global Industrial Insulation Industry Revenue Breakdown (Million, %) by Region 2025 & 2033
- Figure 2: Global Industrial Insulation Industry Volume Breakdown (K Tons, %) by Region 2025 & 2033
- Figure 3: Asia Pacific Industrial Insulation Industry Revenue (Million), by Insulation Material 2025 & 2033
- Figure 4: Asia Pacific Industrial Insulation Industry Volume (K Tons), by Insulation Material 2025 & 2033
- Figure 5: Asia Pacific Industrial Insulation Industry Revenue Share (%), by Insulation Material 2025 & 2033
- Figure 6: Asia Pacific Industrial Insulation Industry Volume Share (%), by Insulation Material 2025 & 2033
- Figure 7: Asia Pacific Industrial Insulation Industry Revenue (Million), by Product 2025 & 2033
- Figure 8: Asia Pacific Industrial Insulation Industry Volume (K Tons), by Product 2025 & 2033
- Figure 9: Asia Pacific Industrial Insulation Industry Revenue Share (%), by Product 2025 & 2033
- Figure 10: Asia Pacific Industrial Insulation Industry Volume Share (%), by Product 2025 & 2033
- Figure 11: Asia Pacific Industrial Insulation Industry Revenue (Million), by End-user Industry 2025 & 2033
- Figure 12: Asia Pacific Industrial Insulation Industry Volume (K Tons), by End-user Industry 2025 & 2033
- Figure 13: Asia Pacific Industrial Insulation Industry Revenue Share (%), by End-user Industry 2025 & 2033
- Figure 14: Asia Pacific Industrial Insulation Industry Volume Share (%), by End-user Industry 2025 & 2033
- Figure 15: Asia Pacific Industrial Insulation Industry Revenue (Million), by Country 2025 & 2033
- Figure 16: Asia Pacific Industrial Insulation Industry Volume (K Tons), by Country 2025 & 2033
- Figure 17: Asia Pacific Industrial Insulation Industry Revenue Share (%), by Country 2025 & 2033
- Figure 18: Asia Pacific Industrial Insulation Industry Volume Share (%), by Country 2025 & 2033
- Figure 19: North America Industrial Insulation Industry Revenue (Million), by Insulation Material 2025 & 2033
- Figure 20: North America Industrial Insulation Industry Volume (K Tons), by Insulation Material 2025 & 2033
- Figure 21: North America Industrial Insulation Industry Revenue Share (%), by Insulation Material 2025 & 2033
- Figure 22: North America Industrial Insulation Industry Volume Share (%), by Insulation Material 2025 & 2033
- Figure 23: North America Industrial Insulation Industry Revenue (Million), by Product 2025 & 2033
- Figure 24: North America Industrial Insulation Industry Volume (K Tons), by Product 2025 & 2033
- Figure 25: North America Industrial Insulation Industry Revenue Share (%), by Product 2025 & 2033
- Figure 26: North America Industrial Insulation Industry Volume Share (%), by Product 2025 & 2033
- Figure 27: North America Industrial Insulation Industry Revenue (Million), by End-user Industry 2025 & 2033
- Figure 28: North America Industrial Insulation Industry Volume (K Tons), by End-user Industry 2025 & 2033
- Figure 29: North America Industrial Insulation Industry Revenue Share (%), by End-user Industry 2025 & 2033
- Figure 30: North America Industrial Insulation Industry Volume Share (%), by End-user Industry 2025 & 2033
- Figure 31: North America Industrial Insulation Industry Revenue (Million), by Country 2025 & 2033
- Figure 32: North America Industrial Insulation Industry Volume (K Tons), by Country 2025 & 2033
- Figure 33: North America Industrial Insulation Industry Revenue Share (%), by Country 2025 & 2033
- Figure 34: North America Industrial Insulation Industry Volume Share (%), by Country 2025 & 2033
- Figure 35: Europe Industrial Insulation Industry Revenue (Million), by Insulation Material 2025 & 2033
- Figure 36: Europe Industrial Insulation Industry Volume (K Tons), by Insulation Material 2025 & 2033
- Figure 37: Europe Industrial Insulation Industry Revenue Share (%), by Insulation Material 2025 & 2033
- Figure 38: Europe Industrial Insulation Industry Volume Share (%), by Insulation Material 2025 & 2033
- Figure 39: Europe Industrial Insulation Industry Revenue (Million), by Product 2025 & 2033
- Figure 40: Europe Industrial Insulation Industry Volume (K Tons), by Product 2025 & 2033
- Figure 41: Europe Industrial Insulation Industry Revenue Share (%), by Product 2025 & 2033
- Figure 42: Europe Industrial Insulation Industry Volume Share (%), by Product 2025 & 2033
- Figure 43: Europe Industrial Insulation Industry Revenue (Million), by End-user Industry 2025 & 2033
- Figure 44: Europe Industrial Insulation Industry Volume (K Tons), by End-user Industry 2025 & 2033
- Figure 45: Europe Industrial Insulation Industry Revenue Share (%), by End-user Industry 2025 & 2033
- Figure 46: Europe Industrial Insulation Industry Volume Share (%), by End-user Industry 2025 & 2033
- Figure 47: Europe Industrial Insulation Industry Revenue (Million), by Country 2025 & 2033
- Figure 48: Europe Industrial Insulation Industry Volume (K Tons), by Country 2025 & 2033
- Figure 49: Europe Industrial Insulation Industry Revenue Share (%), by Country 2025 & 2033
- Figure 50: Europe Industrial Insulation Industry Volume Share (%), by Country 2025 & 2033
- Figure 51: South America Industrial Insulation Industry Revenue (Million), by Insulation Material 2025 & 2033
- Figure 52: South America Industrial Insulation Industry Volume (K Tons), by Insulation Material 2025 & 2033
- Figure 53: South America Industrial Insulation Industry Revenue Share (%), by Insulation Material 2025 & 2033
- Figure 54: South America Industrial Insulation Industry Volume Share (%), by Insulation Material 2025 & 2033
- Figure 55: South America Industrial Insulation Industry Revenue (Million), by Product 2025 & 2033
- Figure 56: South America Industrial Insulation Industry Volume (K Tons), by Product 2025 & 2033
- Figure 57: South America Industrial Insulation Industry Revenue Share (%), by Product 2025 & 2033
- Figure 58: South America Industrial Insulation Industry Volume Share (%), by Product 2025 & 2033
- Figure 59: South America Industrial Insulation Industry Revenue (Million), by End-user Industry 2025 & 2033
- Figure 60: South America Industrial Insulation Industry Volume (K Tons), by End-user Industry 2025 & 2033
- Figure 61: South America Industrial Insulation Industry Revenue Share (%), by End-user Industry 2025 & 2033
- Figure 62: South America Industrial Insulation Industry Volume Share (%), by End-user Industry 2025 & 2033
- Figure 63: South America Industrial Insulation Industry Revenue (Million), by Country 2025 & 2033
- Figure 64: South America Industrial Insulation Industry Volume (K Tons), by Country 2025 & 2033
- Figure 65: South America Industrial Insulation Industry Revenue Share (%), by Country 2025 & 2033
- Figure 66: South America Industrial Insulation Industry Volume Share (%), by Country 2025 & 2033
- Figure 67: Middle East Industrial Insulation Industry Revenue (Million), by Insulation Material 2025 & 2033
- Figure 68: Middle East Industrial Insulation Industry Volume (K Tons), by Insulation Material 2025 & 2033
- Figure 69: Middle East Industrial Insulation Industry Revenue Share (%), by Insulation Material 2025 & 2033
- Figure 70: Middle East Industrial Insulation Industry Volume Share (%), by Insulation Material 2025 & 2033
- Figure 71: Middle East Industrial Insulation Industry Revenue (Million), by Product 2025 & 2033
- Figure 72: Middle East Industrial Insulation Industry Volume (K Tons), by Product 2025 & 2033
- Figure 73: Middle East Industrial Insulation Industry Revenue Share (%), by Product 2025 & 2033
- Figure 74: Middle East Industrial Insulation Industry Volume Share (%), by Product 2025 & 2033
- Figure 75: Middle East Industrial Insulation Industry Revenue (Million), by End-user Industry 2025 & 2033
- Figure 76: Middle East Industrial Insulation Industry Volume (K Tons), by End-user Industry 2025 & 2033
- Figure 77: Middle East Industrial Insulation Industry Revenue Share (%), by End-user Industry 2025 & 2033
- Figure 78: Middle East Industrial Insulation Industry Volume Share (%), by End-user Industry 2025 & 2033
- Figure 79: Middle East Industrial Insulation Industry Revenue (Million), by Country 2025 & 2033
- Figure 80: Middle East Industrial Insulation Industry Volume (K Tons), by Country 2025 & 2033
- Figure 81: Middle East Industrial Insulation Industry Revenue Share (%), by Country 2025 & 2033
- Figure 82: Middle East Industrial Insulation Industry Volume Share (%), by Country 2025 & 2033
- Figure 83: Saudi Arabia Industrial Insulation Industry Revenue (Million), by Insulation Material 2025 & 2033
- Figure 84: Saudi Arabia Industrial Insulation Industry Volume (K Tons), by Insulation Material 2025 & 2033
- Figure 85: Saudi Arabia Industrial Insulation Industry Revenue Share (%), by Insulation Material 2025 & 2033
- Figure 86: Saudi Arabia Industrial Insulation Industry Volume Share (%), by Insulation Material 2025 & 2033
- Figure 87: Saudi Arabia Industrial Insulation Industry Revenue (Million), by Product 2025 & 2033
- Figure 88: Saudi Arabia Industrial Insulation Industry Volume (K Tons), by Product 2025 & 2033
- Figure 89: Saudi Arabia Industrial Insulation Industry Revenue Share (%), by Product 2025 & 2033
- Figure 90: Saudi Arabia Industrial Insulation Industry Volume Share (%), by Product 2025 & 2033
- Figure 91: Saudi Arabia Industrial Insulation Industry Revenue (Million), by End-user Industry 2025 & 2033
- Figure 92: Saudi Arabia Industrial Insulation Industry Volume (K Tons), by End-user Industry 2025 & 2033
- Figure 93: Saudi Arabia Industrial Insulation Industry Revenue Share (%), by End-user Industry 2025 & 2033
- Figure 94: Saudi Arabia Industrial Insulation Industry Volume Share (%), by End-user Industry 2025 & 2033
- Figure 95: Saudi Arabia Industrial Insulation Industry Revenue (Million), by Country 2025 & 2033
- Figure 96: Saudi Arabia Industrial Insulation Industry Volume (K Tons), by Country 2025 & 2033
- Figure 97: Saudi Arabia Industrial Insulation Industry Revenue Share (%), by Country 2025 & 2033
- Figure 98: Saudi Arabia Industrial Insulation Industry Volume Share (%), by Country 2025 & 2033
List of Tables
- Table 1: Global Industrial Insulation Industry Revenue Million Forecast, by Insulation Material 2020 & 2033
- Table 2: Global Industrial Insulation Industry Volume K Tons Forecast, by Insulation Material 2020 & 2033
- Table 3: Global Industrial Insulation Industry Revenue Million Forecast, by Product 2020 & 2033
- Table 4: Global Industrial Insulation Industry Volume K Tons Forecast, by Product 2020 & 2033
- Table 5: Global Industrial Insulation Industry Revenue Million Forecast, by End-user Industry 2020 & 2033
- Table 6: Global Industrial Insulation Industry Volume K Tons Forecast, by End-user Industry 2020 & 2033
- Table 7: Global Industrial Insulation Industry Revenue Million Forecast, by Region 2020 & 2033
- Table 8: Global Industrial Insulation Industry Volume K Tons Forecast, by Region 2020 & 2033
- Table 9: Global Industrial Insulation Industry Revenue Million Forecast, by Insulation Material 2020 & 2033
- Table 10: Global Industrial Insulation Industry Volume K Tons Forecast, by Insulation Material 2020 & 2033
- Table 11: Global Industrial Insulation Industry Revenue Million Forecast, by Product 2020 & 2033
- Table 12: Global Industrial Insulation Industry Volume K Tons Forecast, by Product 2020 & 2033
- Table 13: Global Industrial Insulation Industry Revenue Million Forecast, by End-user Industry 2020 & 2033
- Table 14: Global Industrial Insulation Industry Volume K Tons Forecast, by End-user Industry 2020 & 2033
- Table 15: Global Industrial Insulation Industry Revenue Million Forecast, by Country 2020 & 2033
- Table 16: Global Industrial Insulation Industry Volume K Tons Forecast, by Country 2020 & 2033
- Table 17: China Industrial Insulation Industry Revenue (Million) Forecast, by Application 2020 & 2033
- Table 18: China Industrial Insulation Industry Volume (K Tons) Forecast, by Application 2020 & 2033
- Table 19: India Industrial Insulation Industry Revenue (Million) Forecast, by Application 2020 & 2033
- Table 20: India Industrial Insulation Industry Volume (K Tons) Forecast, by Application 2020 & 2033
- Table 21: Japan Industrial Insulation Industry Revenue (Million) Forecast, by Application 2020 & 2033
- Table 22: Japan Industrial Insulation Industry Volume (K Tons) Forecast, by Application 2020 & 2033
- Table 23: South Korea Industrial Insulation Industry Revenue (Million) Forecast, by Application 2020 & 2033
- Table 24: South Korea Industrial Insulation Industry Volume (K Tons) Forecast, by Application 2020 & 2033
- Table 25: Rest of Asia Pacific Industrial Insulation Industry Revenue (Million) Forecast, by Application 2020 & 2033
- Table 26: Rest of Asia Pacific Industrial Insulation Industry Volume (K Tons) Forecast, by Application 2020 & 2033
- Table 27: Global Industrial Insulation Industry Revenue Million Forecast, by Insulation Material 2020 & 2033
- Table 28: Global Industrial Insulation Industry Volume K Tons Forecast, by Insulation Material 2020 & 2033
- Table 29: Global Industrial Insulation Industry Revenue Million Forecast, by Product 2020 & 2033
- Table 30: Global Industrial Insulation Industry Volume K Tons Forecast, by Product 2020 & 2033
- Table 31: Global Industrial Insulation Industry Revenue Million Forecast, by End-user Industry 2020 & 2033
- Table 32: Global Industrial Insulation Industry Volume K Tons Forecast, by End-user Industry 2020 & 2033
- Table 33: Global Industrial Insulation Industry Revenue Million Forecast, by Country 2020 & 2033
- Table 34: Global Industrial Insulation Industry Volume K Tons Forecast, by Country 2020 & 2033
- Table 35: United States Industrial Insulation Industry Revenue (Million) Forecast, by Application 2020 & 2033
- Table 36: United States Industrial Insulation Industry Volume (K Tons) Forecast, by Application 2020 & 2033
- Table 37: Canada Industrial Insulation Industry Revenue (Million) Forecast, by Application 2020 & 2033
- Table 38: Canada Industrial Insulation Industry Volume (K Tons) Forecast, by Application 2020 & 2033
- Table 39: Mexico Industrial Insulation Industry Revenue (Million) Forecast, by Application 2020 & 2033
- Table 40: Mexico Industrial Insulation Industry Volume (K Tons) Forecast, by Application 2020 & 2033
- Table 41: Global Industrial Insulation Industry Revenue Million Forecast, by Insulation Material 2020 & 2033
- Table 42: Global Industrial Insulation Industry Volume K Tons Forecast, by Insulation Material 2020 & 2033
- Table 43: Global Industrial Insulation Industry Revenue Million Forecast, by Product 2020 & 2033
- Table 44: Global Industrial Insulation Industry Volume K Tons Forecast, by Product 2020 & 2033
- Table 45: Global Industrial Insulation Industry Revenue Million Forecast, by End-user Industry 2020 & 2033
- Table 46: Global Industrial Insulation Industry Volume K Tons Forecast, by End-user Industry 2020 & 2033
- Table 47: Global Industrial Insulation Industry Revenue Million Forecast, by Country 2020 & 2033
- Table 48: Global Industrial Insulation Industry Volume K Tons Forecast, by Country 2020 & 2033
- Table 49: Germany Industrial Insulation Industry Revenue (Million) Forecast, by Application 2020 & 2033
- Table 50: Germany Industrial Insulation Industry Volume (K Tons) Forecast, by Application 2020 & 2033
- Table 51: United Kingdom Industrial Insulation Industry Revenue (Million) Forecast, by Application 2020 & 2033
- Table 52: United Kingdom Industrial Insulation Industry Volume (K Tons) Forecast, by Application 2020 & 2033
- Table 53: France Industrial Insulation Industry Revenue (Million) Forecast, by Application 2020 & 2033
- Table 54: France Industrial Insulation Industry Volume (K Tons) Forecast, by Application 2020 & 2033
- Table 55: Italy Industrial Insulation Industry Revenue (Million) Forecast, by Application 2020 & 2033
- Table 56: Italy Industrial Insulation Industry Volume (K Tons) Forecast, by Application 2020 & 2033
- Table 57: Rest of Europe Industrial Insulation Industry Revenue (Million) Forecast, by Application 2020 & 2033
- Table 58: Rest of Europe Industrial Insulation Industry Volume (K Tons) Forecast, by Application 2020 & 2033
- Table 59: Global Industrial Insulation Industry Revenue Million Forecast, by Insulation Material 2020 & 2033
- Table 60: Global Industrial Insulation Industry Volume K Tons Forecast, by Insulation Material 2020 & 2033
- Table 61: Global Industrial Insulation Industry Revenue Million Forecast, by Product 2020 & 2033
- Table 62: Global Industrial Insulation Industry Volume K Tons Forecast, by Product 2020 & 2033
- Table 63: Global Industrial Insulation Industry Revenue Million Forecast, by End-user Industry 2020 & 2033
- Table 64: Global Industrial Insulation Industry Volume K Tons Forecast, by End-user Industry 2020 & 2033
- Table 65: Global Industrial Insulation Industry Revenue Million Forecast, by Country 2020 & 2033
- Table 66: Global Industrial Insulation Industry Volume K Tons Forecast, by Country 2020 & 2033
- Table 67: Brazil Industrial Insulation Industry Revenue (Million) Forecast, by Application 2020 & 2033
- Table 68: Brazil Industrial Insulation Industry Volume (K Tons) Forecast, by Application 2020 & 2033
- Table 69: Argentina Industrial Insulation Industry Revenue (Million) Forecast, by Application 2020 & 2033
- Table 70: Argentina Industrial Insulation Industry Volume (K Tons) Forecast, by Application 2020 & 2033
- Table 71: Rest of South America Industrial Insulation Industry Revenue (Million) Forecast, by Application 2020 & 2033
- Table 72: Rest of South America Industrial Insulation Industry Volume (K Tons) Forecast, by Application 2020 & 2033
- Table 73: Global Industrial Insulation Industry Revenue Million Forecast, by Insulation Material 2020 & 2033
- Table 74: Global Industrial Insulation Industry Volume K Tons Forecast, by Insulation Material 2020 & 2033
- Table 75: Global Industrial Insulation Industry Revenue Million Forecast, by Product 2020 & 2033
- Table 76: Global Industrial Insulation Industry Volume K Tons Forecast, by Product 2020 & 2033
- Table 77: Global Industrial Insulation Industry Revenue Million Forecast, by End-user Industry 2020 & 2033
- Table 78: Global Industrial Insulation Industry Volume K Tons Forecast, by End-user Industry 2020 & 2033
- Table 79: Global Industrial Insulation Industry Revenue Million Forecast, by Country 2020 & 2033
- Table 80: Global Industrial Insulation Industry Volume K Tons Forecast, by Country 2020 & 2033
- Table 81: Global Industrial Insulation Industry Revenue Million Forecast, by Insulation Material 2020 & 2033
- Table 82: Global Industrial Insulation Industry Volume K Tons Forecast, by Insulation Material 2020 & 2033
- Table 83: Global Industrial Insulation Industry Revenue Million Forecast, by Product 2020 & 2033
- Table 84: Global Industrial Insulation Industry Volume K Tons Forecast, by Product 2020 & 2033
- Table 85: Global Industrial Insulation Industry Revenue Million Forecast, by End-user Industry 2020 & 2033
- Table 86: Global Industrial Insulation Industry Volume K Tons Forecast, by End-user Industry 2020 & 2033
- Table 87: Global Industrial Insulation Industry Revenue Million Forecast, by Country 2020 & 2033
- Table 88: Global Industrial Insulation Industry Volume K Tons Forecast, by Country 2020 & 2033
- Table 89: South Africa Industrial Insulation Industry Revenue (Million) Forecast, by Application 2020 & 2033
- Table 90: South Africa Industrial Insulation Industry Volume (K Tons) Forecast, by Application 2020 & 2033
- Table 91: Rest of Middle East Industrial Insulation Industry Revenue (Million) Forecast, by Application 2020 & 2033
- Table 92: Rest of Middle East Industrial Insulation Industry Volume (K Tons) Forecast, by Application 2020 & 2033
Frequently Asked Questions
1. What is the projected Compound Annual Growth Rate (CAGR) of the Industrial Insulation Industry?
The projected CAGR is approximately > 5.00%.
2. Which companies are prominent players in the Industrial Insulation Industry?
Key companies in the market include Solvay, BNZ Materials, Cabot Corporation, Armacell, Owens Corning, BASF SE, Rockwool A/S, Knauf Insulation, Temati Group, INSUL-FAB, Johns Manville-Berkshire Hathway Company, Jays Refractory Specialists.
3. What are the main segments of the Industrial Insulation Industry?
The market segments include Insulation Material, Product, End-user Industry.
4. Can you provide details about the market size?
The market size is estimated to be USD 7.41 Million as of 2022.
5. What are some drivers contributing to market growth?
Growing Construction and Power Generation Industry; Regulatory Support to Increase Energy Efficiency.
6. What are the notable trends driving market growth?
Power Generation Industry to Dominate the Market.
7. Are there any restraints impacting market growth?
Environmental Hazards; Other Restraints.
8. Can you provide examples of recent developments in the market?
November 2022: BEWI acquired Aislamientos y Envases SL, a Spanish insulation company that provides EPS-based products for packaging and industrial applications, to expand its geographic footprint and strengthen its insulation solutions product portfolio in Spain.
9. What pricing options are available for accessing the report?
Pricing options include single-user, multi-user, and enterprise licenses priced at USD 4750, USD 5250, and USD 8750 respectively.
10. Is the market size provided in terms of value or volume?
The market size is provided in terms of value, measured in Million and volume, measured in K Tons.
11. Are there any specific market keywords associated with the report?
Yes, the market keyword associated with the report is "Industrial Insulation Industry," which aids in identifying and referencing the specific market segment covered.
12. How do I determine which pricing option suits my needs best?
The pricing options vary based on user requirements and access needs. Individual users may opt for single-user licenses, while businesses requiring broader access may choose multi-user or enterprise licenses for cost-effective access to the report.
13. Are there any additional resources or data provided in the Industrial Insulation Industry report?
While the report offers comprehensive insights, it's advisable to review the specific contents or supplementary materials provided to ascertain if additional resources or data are available.
14. How can I stay updated on further developments or reports in the Industrial Insulation Industry?
To stay informed about further developments, trends, and reports in the Industrial Insulation Industry, consider subscribing to industry newsletters, following relevant companies and organizations, or regularly checking reputable industry news sources and publications.
Methodology
Step 1 - Identification of Relevant Samples Size from Population Database


Step 2 - Approaches for Defining Global Market Size (Value, Volume* & Price*)

Note*: In applicable scenarios
Step 3 - Data Sources
Primary Research
- Web Analytics
- Survey Reports
- Research Institute
- Latest Research Reports
- Opinion Leaders
Secondary Research
- Annual Reports
- White Paper
- Latest Press Release
- Industry Association
- Paid Database
- Investor Presentations

Step 4 - Data Triangulation
Involves using different sources of information in order to increase the validity of a study
These sources are likely to be stakeholders in a program - participants, other researchers, program staff, other community members, and so on.
Then we put all data in single framework & apply various statistical tools to find out the dynamic on the market.
During the analysis stage, feedback from the stakeholder groups would be compared to determine areas of agreement as well as areas of divergence