

Key Insights
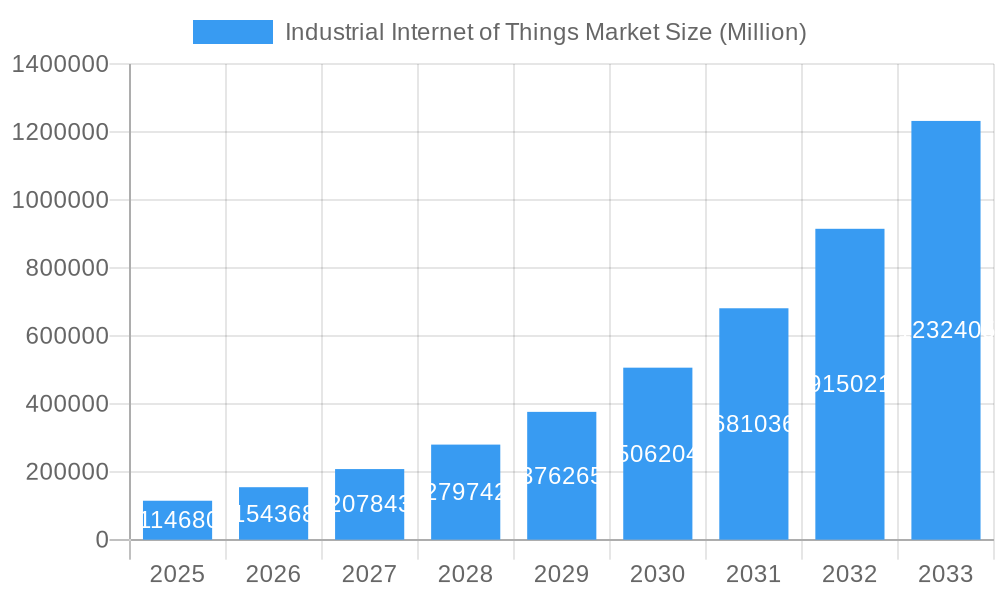
The Industrial Internet of Things (IIoT) market is experiencing robust growth, projected to reach \$114.68 billion in 2025 and exhibiting a remarkable Compound Annual Growth Rate (CAGR) of 34.41%. This expansion is driven by several key factors. Firstly, the increasing adoption of advanced technologies such as artificial intelligence (AI), machine learning (ML), and big data analytics across various industrial sectors is enabling greater automation, efficiency, and predictive maintenance. Secondly, the burgeoning need for real-time data monitoring and control to optimize operational processes and reduce downtime is a significant driver. Thirdly, the convergence of cloud computing and edge computing technologies provides enhanced data processing capabilities and reduces latency, further fueling market growth. Finally, government initiatives promoting digital transformation and smart manufacturing are creating a favorable regulatory environment.
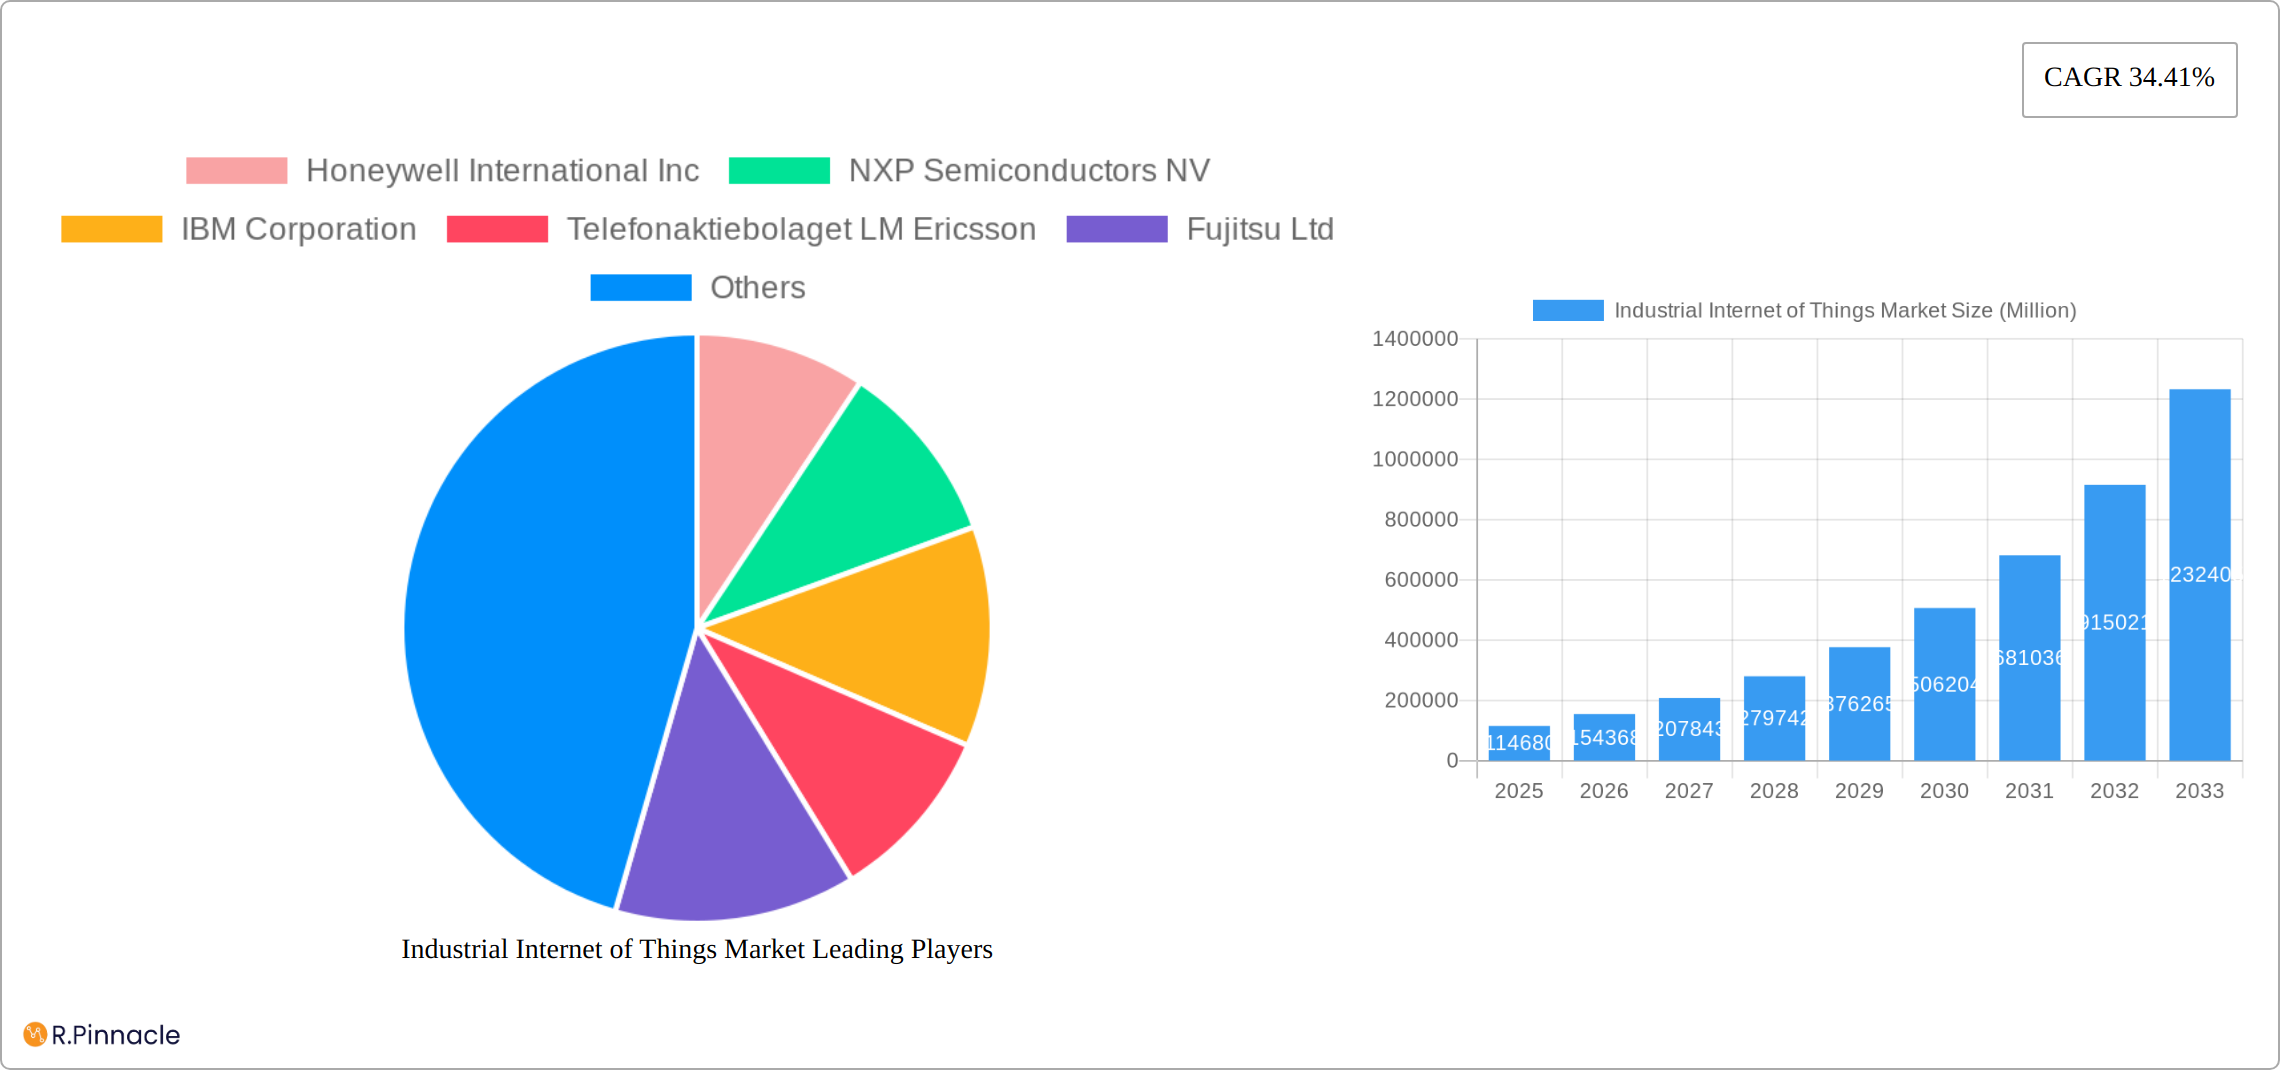
Industrial Internet of Things Market Market Size (In Billion)
Segmentation analysis reveals a diverse landscape. The hardware segment, encompassing sensors, actuators, and gateways, forms a substantial portion of the market. Software solutions, including Industrial IoT platforms and applications, are witnessing rapid growth due to their crucial role in data analysis and process optimization. The services and connectivity segment, covering deployment, integration, and maintenance services, is also expanding significantly. Across end-user verticals, manufacturing leads with the highest adoption, followed by transportation, oil and gas, and utilities. North America currently holds a dominant market share, but regions like Asia-Pacific are exhibiting rapid growth, propelled by increasing industrialization and technological advancements. Leading players such as Honeywell, Siemens, and IBM are investing heavily in R&D to enhance their product offerings and strengthen their market positions. The competitive landscape is characterized by both established players and emerging technology providers. Over the forecast period (2025-2033), continued technological innovation, expanding connectivity infrastructure, and rising industrial automation demands will further accelerate the market's growth trajectory.
Industrial Internet of Things Market Company Market Share
This comprehensive report provides an in-depth analysis of the Industrial Internet of Things (IIoT) market, offering valuable insights for industry professionals, investors, and strategists. The report covers the period from 2019 to 2033, with a focus on the 2025-2033 forecast period. Market size is presented in Millions. Key players include Honeywell International Inc, NXP Semiconductors NV, IBM Corporation, and many more.
Industrial Internet of Things Market Structure & Innovation Trends
The IIoT market exhibits a moderately concentrated structure, with a few dominant players holding significant market share. However, the market is also characterized by a high level of innovation, driven by advancements in areas such as artificial intelligence (AI), machine learning (ML), and cloud computing. Regulatory frameworks, particularly concerning data security and privacy, play a crucial role in shaping market dynamics. Product substitution, primarily through the adoption of more efficient and cost-effective solutions, is an ongoing process. The end-user demographic is diverse, spanning various industries and geographic locations. M&A activities in the IIoT sector have been significant, with deal values ranging from xx Million to xx Million in recent years, consolidating market share and driving technological advancements. Key metrics like market share and M&A deal values are analyzed for each segment.
- Market Concentration: Moderately concentrated, with top 5 players holding approximately xx% market share in 2024.
- Innovation Drivers: AI, ML, Cloud Computing, 5G connectivity.
- Regulatory Frameworks: GDPR, CCPA, and industry-specific regulations impacting data security and privacy.
- Product Substitutes: Evolution towards more energy-efficient and cost-effective hardware and software solutions.
- End-User Demographics: Diverse across manufacturing, transportation, oil & gas, utilities, and other verticals.
- M&A Activity: Significant activity observed, with deal values ranging from xx Million to xx Million in recent years (2019-2024).
Industrial Internet of Things Market Dynamics & Trends
The IIoT market is experiencing robust growth, driven by increasing demand for automation, remote monitoring, predictive maintenance, and improved operational efficiency across various industries. Technological disruptions, such as the widespread adoption of 5G and edge computing, are accelerating market expansion. Consumer preferences are shifting towards more connected, intelligent, and data-driven solutions. The competitive landscape is highly dynamic, with both established players and new entrants vying for market share. The Compound Annual Growth Rate (CAGR) for the period 2025-2033 is projected to be xx%, while market penetration is expected to reach xx% by 2033. This growth is fuelled by factors such as increasing digitalization across industries, the growing need for real-time data analytics, and advancements in sensor technologies.
Dominant Regions & Segments in Industrial Internet of Things Market
The Manufacturing segment dominates the end-user vertical, driven by the high potential for automation and efficiency improvements. Geographically, North America and Europe currently hold the largest market shares, attributed to robust industrial infrastructure and early adoption of IIoT technologies. However, the Asia-Pacific region is projected to exhibit the fastest growth rate due to increasing industrialization and government initiatives promoting digital transformation.
- Leading Region: North America (in 2024)
- Leading Segment (Type): Hardware (in 2024)
- Leading Segment (End-user Vertical): Manufacturing (in 2024)
Key Drivers (Manufacturing):
- High automation potential
- Need for improved production efficiency
- Focus on predictive maintenance
Key Drivers (North America):
- Well-established industrial infrastructure
- High technological adoption rate
- Strong government support for IIoT initiatives
Key Drivers (Asia-Pacific):
- Rapid industrialization
- Increasing government investments in digital infrastructure
- Growing demand for cost-effective solutions
Industrial Internet of Things Market Product Innovations
The Industrial Internet of Things (IIoT) market is experiencing a surge in product innovations driven by the need for enhanced connectivity, sophisticated data analytics, and robust security. A key trend is the seamless integration of Artificial Intelligence (AI) and Machine Learning (ML) into IIoT platforms. This integration facilitates predictive maintenance, enabling proactive identification and mitigation of potential equipment failures, resulting in minimized downtime and optimized operational efficiency. Furthermore, AI/ML empowers improved decision-making by providing real-time insights into operational processes, leading to better resource allocation and cost savings. Simultaneously, the industry is witnessing significant advancements in developing more energy-efficient and cost-effective hardware, including low-power wide-area network (LPWAN) technologies and improved sensor capabilities. These innovations are crucial for expanding IIoT deployments across diverse sectors and ensuring wider market adoption by addressing critical factors such as reduced energy consumption and overall operational costs.
Report Scope & Segmentation Analysis
This report provides a comprehensive analysis of the IIoT market, segmented by Type (Hardware, Software, Services & Connectivity) and End-user Vertical (Manufacturing, Transportation, Oil and Gas, Utility, Building Automation, Agriculture, and Other End-user Verticals). The report meticulously examines each segment's growth trajectory, providing detailed market size estimations and a thorough assessment of the competitive landscape. For instance, the Hardware segment is poised for substantial growth, driven by the escalating demand for sophisticated smart sensors, robust edge computing devices, and secure gateways. The Manufacturing sector currently holds the largest market share, reflecting the significant adoption of IIoT technologies to enhance productivity and optimize production processes. However, other sectors, such as Transportation and Energy, are also exhibiting significant growth potential due to increasing investments in smart infrastructure and digital transformation initiatives.
Key Drivers of Industrial Internet of Things Market Growth
The IIoT market's growth is propelled by several key factors: the increasing need for enhanced operational efficiency and productivity across various industries, the growing adoption of advanced technologies such as AI and ML for data analytics and predictive maintenance, supportive government policies promoting digitalization, and decreasing costs associated with IIoT technologies. Furthermore, the rise of Industry 4.0 and smart manufacturing initiatives is fueling market growth.
Challenges in the Industrial Internet of Things Market Sector
The IIoT market faces challenges such as high initial investment costs, concerns about data security and privacy, the need for robust cybersecurity measures, and the complexity of integrating various IIoT technologies into existing infrastructure. Supply chain disruptions can also impact market growth. Addressing these challenges is crucial for the sustained growth of the IIoT market.
Emerging Opportunities in Industrial Internet of Things Market
Emerging opportunities lie in the expanding adoption of IIoT solutions in sectors like smart cities, healthcare, and agriculture. The development of new technologies such as edge computing and blockchain offers further growth potential. Moreover, the integration of IIoT with other emerging technologies like Extended Reality (XR) and Digital Twins promises to unlock new capabilities and value creation opportunities.
Leading Players in the Industrial Internet of Things Market Market
- Honeywell International Inc
- NXP Semiconductors NV
- IBM Corporation
- Telefonaktiebolaget LM Ericsson
- Fujitsu Ltd
- Cypress Semiconductor Corporation
- Telit Communications Plc
- Emerson Electric Co
- Mitsubishi Electric Corporation
- Cisco Systems Inc
- Siemens AG
- Amazon Web Services Inc
- PTC Inc
- Robert Bosch GmbH
- OMRON Corporation
- Oracle Corporation
- SAP SE
- General Electric Company
Key Developments in Industrial Internet of Things Market Industry
- February 2023: Cisco launched enhanced cloud management tools specifically designed for industrial IoT applications, providing businesses with improved network visibility, granular control, and simplified management capabilities.
- February 2023: KORE unveiled MODGo, a Software-as-a-Service (SaaS) platform that streamlines IoT asset management. This platform simplifies various aspects of IoT implementation and management, reducing complexity and accelerating deployment for businesses of all sizes.
- [Add more recent developments here with dates and brief descriptions. Example: Month Year: Company X announced a new partnership with Company Y to develop… ]
Future Outlook for Industrial Internet of Things Market Market
The IIoT market is poised for continued strong growth, driven by the increasing adoption of advanced technologies, the expansion of connectivity, and the growing demand for data-driven decision-making. Strategic partnerships, technological innovations, and expanding applications across various industries will further accelerate market expansion, creating significant opportunities for both established players and new entrants.
Industrial Internet of Things Market Segmentation
-
1. Type
- 1.1. Hardware
- 1.2. Software
- 1.3. Services & Connectivity
-
2. End-user Vertical
- 2.1. Manufacturing
- 2.2. Transportation
- 2.3. Oil and Gas
- 2.4. Utility
- 2.5. Other End-user Verticals
Industrial Internet of Things Market Segmentation By Geography
- 1. North America
- 2. Europe
- 3. Asia Pacific
- 4. Rest of the World
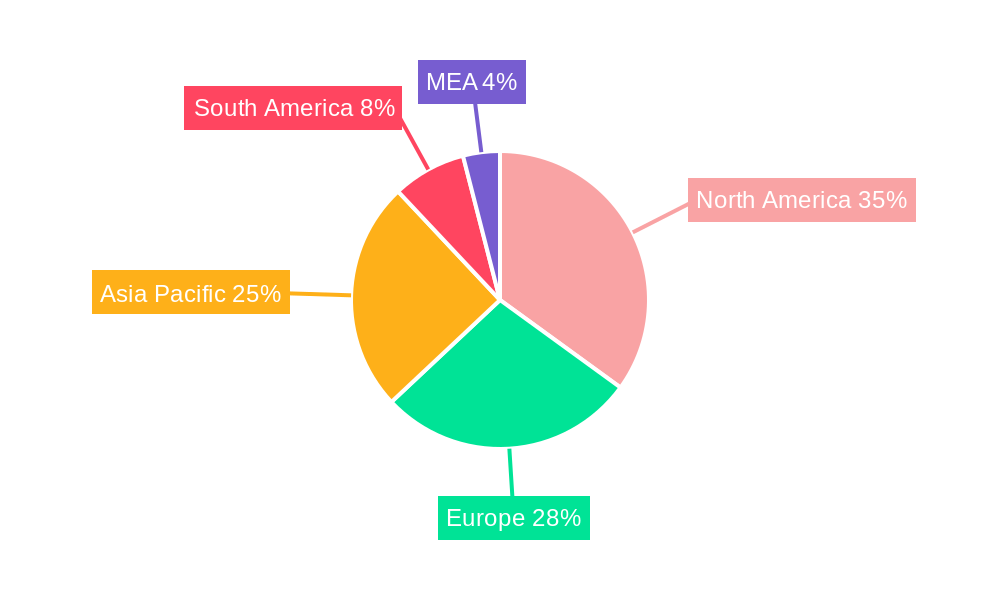
Industrial Internet of Things Market Regional Market Share
Geographic Coverage of Industrial Internet of Things Market
Industrial Internet of Things Market REPORT HIGHLIGHTS
| Aspects | Details |
|---|---|
| Study Period | 2020-2034 |
| Base Year | 2025 |
| Estimated Year | 2026 |
| Forecast Period | 2026-2034 |
| Historical Period | 2020-2025 |
| Growth Rate | CAGR of 34.41% from 2020-2034 |
| Segmentation |
|
Table of Contents
- 1. Introduction
- 1.1. Research Scope
- 1.2. Market Segmentation
- 1.3. Research Methodology
- 1.4. Definitions and Assumptions
- 2. Executive Summary
- 2.1. Introduction
- 3. Market Dynamics
- 3.1. Introduction
- 3.2. Market Drivers
- 3.2.1. Proliferation of digitization and adoption of sensors in plants; Growing demand for automated and efficient process
- 3.3. Market Restrains
- 3.3.1. Issues Related to Security and Privacy of Data and Connectivity of Devices and Interoperability
- 3.4. Market Trends
- 3.4.1. Manufacturing to Hold Major Market Share
- 4. Market Factor Analysis
- 4.1. Porters Five Forces
- 4.2. Supply/Value Chain
- 4.3. PESTEL analysis
- 4.4. Market Entropy
- 4.5. Patent/Trademark Analysis
- 5. Global Industrial Internet of Things Market Analysis, Insights and Forecast, 2020-2032
- 5.1. Market Analysis, Insights and Forecast - by Type
- 5.1.1. Hardware
- 5.1.2. Software
- 5.1.3. Services & Connectivity
- 5.2. Market Analysis, Insights and Forecast - by End-user Vertical
- 5.2.1. Manufacturing
- 5.2.2. Transportation
- 5.2.3. Oil and Gas
- 5.2.4. Utility
- 5.2.5. Other End-user Verticals
- 5.3. Market Analysis, Insights and Forecast - by Region
- 5.3.1. North America
- 5.3.2. Europe
- 5.3.3. Asia Pacific
- 5.3.4. Rest of the World
- 5.1. Market Analysis, Insights and Forecast - by Type
- 6. North America Industrial Internet of Things Market Analysis, Insights and Forecast, 2020-2032
- 6.1. Market Analysis, Insights and Forecast - by Type
- 6.1.1. Hardware
- 6.1.2. Software
- 6.1.3. Services & Connectivity
- 6.2. Market Analysis, Insights and Forecast - by End-user Vertical
- 6.2.1. Manufacturing
- 6.2.2. Transportation
- 6.2.3. Oil and Gas
- 6.2.4. Utility
- 6.2.5. Other End-user Verticals
- 6.1. Market Analysis, Insights and Forecast - by Type
- 7. Europe Industrial Internet of Things Market Analysis, Insights and Forecast, 2020-2032
- 7.1. Market Analysis, Insights and Forecast - by Type
- 7.1.1. Hardware
- 7.1.2. Software
- 7.1.3. Services & Connectivity
- 7.2. Market Analysis, Insights and Forecast - by End-user Vertical
- 7.2.1. Manufacturing
- 7.2.2. Transportation
- 7.2.3. Oil and Gas
- 7.2.4. Utility
- 7.2.5. Other End-user Verticals
- 7.1. Market Analysis, Insights and Forecast - by Type
- 8. Asia Pacific Industrial Internet of Things Market Analysis, Insights and Forecast, 2020-2032
- 8.1. Market Analysis, Insights and Forecast - by Type
- 8.1.1. Hardware
- 8.1.2. Software
- 8.1.3. Services & Connectivity
- 8.2. Market Analysis, Insights and Forecast - by End-user Vertical
- 8.2.1. Manufacturing
- 8.2.2. Transportation
- 8.2.3. Oil and Gas
- 8.2.4. Utility
- 8.2.5. Other End-user Verticals
- 8.1. Market Analysis, Insights and Forecast - by Type
- 9. Rest of the World Industrial Internet of Things Market Analysis, Insights and Forecast, 2020-2032
- 9.1. Market Analysis, Insights and Forecast - by Type
- 9.1.1. Hardware
- 9.1.2. Software
- 9.1.3. Services & Connectivity
- 9.2. Market Analysis, Insights and Forecast - by End-user Vertical
- 9.2.1. Manufacturing
- 9.2.2. Transportation
- 9.2.3. Oil and Gas
- 9.2.4. Utility
- 9.2.5. Other End-user Verticals
- 9.1. Market Analysis, Insights and Forecast - by Type
- 10. Competitive Analysis
- 10.1. Global Market Share Analysis 2025
- 10.2. Company Profiles
- 10.2.1 Honeywell International Inc
- 10.2.1.1. Overview
- 10.2.1.2. Products
- 10.2.1.3. SWOT Analysis
- 10.2.1.4. Recent Developments
- 10.2.1.5. Financials (Based on Availability)
- 10.2.2 NXP Semiconductors NV
- 10.2.2.1. Overview
- 10.2.2.2. Products
- 10.2.2.3. SWOT Analysis
- 10.2.2.4. Recent Developments
- 10.2.2.5. Financials (Based on Availability)
- 10.2.3 IBM Corporation
- 10.2.3.1. Overview
- 10.2.3.2. Products
- 10.2.3.3. SWOT Analysis
- 10.2.3.4. Recent Developments
- 10.2.3.5. Financials (Based on Availability)
- 10.2.4 Telefonaktiebolaget LM Ericsson
- 10.2.4.1. Overview
- 10.2.4.2. Products
- 10.2.4.3. SWOT Analysis
- 10.2.4.4. Recent Developments
- 10.2.4.5. Financials (Based on Availability)
- 10.2.5 Fujitsu Ltd
- 10.2.5.1. Overview
- 10.2.5.2. Products
- 10.2.5.3. SWOT Analysis
- 10.2.5.4. Recent Developments
- 10.2.5.5. Financials (Based on Availability)
- 10.2.6 Cypress Semiconductor Corporation
- 10.2.6.1. Overview
- 10.2.6.2. Products
- 10.2.6.3. SWOT Analysis
- 10.2.6.4. Recent Developments
- 10.2.6.5. Financials (Based on Availability)
- 10.2.7 Telit Communications Plc
- 10.2.7.1. Overview
- 10.2.7.2. Products
- 10.2.7.3. SWOT Analysis
- 10.2.7.4. Recent Developments
- 10.2.7.5. Financials (Based on Availability)
- 10.2.8 Emerson Electric Co
- 10.2.8.1. Overview
- 10.2.8.2. Products
- 10.2.8.3. SWOT Analysis
- 10.2.8.4. Recent Developments
- 10.2.8.5. Financials (Based on Availability)
- 10.2.9 Mitsubishi Electric Corporation
- 10.2.9.1. Overview
- 10.2.9.2. Products
- 10.2.9.3. SWOT Analysis
- 10.2.9.4. Recent Developments
- 10.2.9.5. Financials (Based on Availability)
- 10.2.10 Cisco Systems Inc
- 10.2.10.1. Overview
- 10.2.10.2. Products
- 10.2.10.3. SWOT Analysis
- 10.2.10.4. Recent Developments
- 10.2.10.5. Financials (Based on Availability)
- 10.2.11 Siemens AG
- 10.2.11.1. Overview
- 10.2.11.2. Products
- 10.2.11.3. SWOT Analysis
- 10.2.11.4. Recent Developments
- 10.2.11.5. Financials (Based on Availability)
- 10.2.12 Amazon Web Services Inc
- 10.2.12.1. Overview
- 10.2.12.2. Products
- 10.2.12.3. SWOT Analysis
- 10.2.12.4. Recent Developments
- 10.2.12.5. Financials (Based on Availability)
- 10.2.13 PTC Inc
- 10.2.13.1. Overview
- 10.2.13.2. Products
- 10.2.13.3. SWOT Analysis
- 10.2.13.4. Recent Developments
- 10.2.13.5. Financials (Based on Availability)
- 10.2.14 Robert Bosch GmbH
- 10.2.14.1. Overview
- 10.2.14.2. Products
- 10.2.14.3. SWOT Analysis
- 10.2.14.4. Recent Developments
- 10.2.14.5. Financials (Based on Availability)
- 10.2.15 OMRON Corporation
- 10.2.15.1. Overview
- 10.2.15.2. Products
- 10.2.15.3. SWOT Analysis
- 10.2.15.4. Recent Developments
- 10.2.15.5. Financials (Based on Availability)
- 10.2.16 Oracle Corporation
- 10.2.16.1. Overview
- 10.2.16.2. Products
- 10.2.16.3. SWOT Analysis
- 10.2.16.4. Recent Developments
- 10.2.16.5. Financials (Based on Availability)
- 10.2.17 SAP SE
- 10.2.17.1. Overview
- 10.2.17.2. Products
- 10.2.17.3. SWOT Analysis
- 10.2.17.4. Recent Developments
- 10.2.17.5. Financials (Based on Availability)
- 10.2.18 General Electric Company
- 10.2.18.1. Overview
- 10.2.18.2. Products
- 10.2.18.3. SWOT Analysis
- 10.2.18.4. Recent Developments
- 10.2.18.5. Financials (Based on Availability)
- 10.2.1 Honeywell International Inc
List of Figures
- Figure 1: Global Industrial Internet of Things Market Revenue Breakdown (Million, %) by Region 2025 & 2033
- Figure 2: Global Industrial Internet of Things Market Volume Breakdown (K Unit, %) by Region 2025 & 2033
- Figure 3: North America Industrial Internet of Things Market Revenue (Million), by Type 2025 & 2033
- Figure 4: North America Industrial Internet of Things Market Volume (K Unit), by Type 2025 & 2033
- Figure 5: North America Industrial Internet of Things Market Revenue Share (%), by Type 2025 & 2033
- Figure 6: North America Industrial Internet of Things Market Volume Share (%), by Type 2025 & 2033
- Figure 7: North America Industrial Internet of Things Market Revenue (Million), by End-user Vertical 2025 & 2033
- Figure 8: North America Industrial Internet of Things Market Volume (K Unit), by End-user Vertical 2025 & 2033
- Figure 9: North America Industrial Internet of Things Market Revenue Share (%), by End-user Vertical 2025 & 2033
- Figure 10: North America Industrial Internet of Things Market Volume Share (%), by End-user Vertical 2025 & 2033
- Figure 11: North America Industrial Internet of Things Market Revenue (Million), by Country 2025 & 2033
- Figure 12: North America Industrial Internet of Things Market Volume (K Unit), by Country 2025 & 2033
- Figure 13: North America Industrial Internet of Things Market Revenue Share (%), by Country 2025 & 2033
- Figure 14: North America Industrial Internet of Things Market Volume Share (%), by Country 2025 & 2033
- Figure 15: Europe Industrial Internet of Things Market Revenue (Million), by Type 2025 & 2033
- Figure 16: Europe Industrial Internet of Things Market Volume (K Unit), by Type 2025 & 2033
- Figure 17: Europe Industrial Internet of Things Market Revenue Share (%), by Type 2025 & 2033
- Figure 18: Europe Industrial Internet of Things Market Volume Share (%), by Type 2025 & 2033
- Figure 19: Europe Industrial Internet of Things Market Revenue (Million), by End-user Vertical 2025 & 2033
- Figure 20: Europe Industrial Internet of Things Market Volume (K Unit), by End-user Vertical 2025 & 2033
- Figure 21: Europe Industrial Internet of Things Market Revenue Share (%), by End-user Vertical 2025 & 2033
- Figure 22: Europe Industrial Internet of Things Market Volume Share (%), by End-user Vertical 2025 & 2033
- Figure 23: Europe Industrial Internet of Things Market Revenue (Million), by Country 2025 & 2033
- Figure 24: Europe Industrial Internet of Things Market Volume (K Unit), by Country 2025 & 2033
- Figure 25: Europe Industrial Internet of Things Market Revenue Share (%), by Country 2025 & 2033
- Figure 26: Europe Industrial Internet of Things Market Volume Share (%), by Country 2025 & 2033
- Figure 27: Asia Pacific Industrial Internet of Things Market Revenue (Million), by Type 2025 & 2033
- Figure 28: Asia Pacific Industrial Internet of Things Market Volume (K Unit), by Type 2025 & 2033
- Figure 29: Asia Pacific Industrial Internet of Things Market Revenue Share (%), by Type 2025 & 2033
- Figure 30: Asia Pacific Industrial Internet of Things Market Volume Share (%), by Type 2025 & 2033
- Figure 31: Asia Pacific Industrial Internet of Things Market Revenue (Million), by End-user Vertical 2025 & 2033
- Figure 32: Asia Pacific Industrial Internet of Things Market Volume (K Unit), by End-user Vertical 2025 & 2033
- Figure 33: Asia Pacific Industrial Internet of Things Market Revenue Share (%), by End-user Vertical 2025 & 2033
- Figure 34: Asia Pacific Industrial Internet of Things Market Volume Share (%), by End-user Vertical 2025 & 2033
- Figure 35: Asia Pacific Industrial Internet of Things Market Revenue (Million), by Country 2025 & 2033
- Figure 36: Asia Pacific Industrial Internet of Things Market Volume (K Unit), by Country 2025 & 2033
- Figure 37: Asia Pacific Industrial Internet of Things Market Revenue Share (%), by Country 2025 & 2033
- Figure 38: Asia Pacific Industrial Internet of Things Market Volume Share (%), by Country 2025 & 2033
- Figure 39: Rest of the World Industrial Internet of Things Market Revenue (Million), by Type 2025 & 2033
- Figure 40: Rest of the World Industrial Internet of Things Market Volume (K Unit), by Type 2025 & 2033
- Figure 41: Rest of the World Industrial Internet of Things Market Revenue Share (%), by Type 2025 & 2033
- Figure 42: Rest of the World Industrial Internet of Things Market Volume Share (%), by Type 2025 & 2033
- Figure 43: Rest of the World Industrial Internet of Things Market Revenue (Million), by End-user Vertical 2025 & 2033
- Figure 44: Rest of the World Industrial Internet of Things Market Volume (K Unit), by End-user Vertical 2025 & 2033
- Figure 45: Rest of the World Industrial Internet of Things Market Revenue Share (%), by End-user Vertical 2025 & 2033
- Figure 46: Rest of the World Industrial Internet of Things Market Volume Share (%), by End-user Vertical 2025 & 2033
- Figure 47: Rest of the World Industrial Internet of Things Market Revenue (Million), by Country 2025 & 2033
- Figure 48: Rest of the World Industrial Internet of Things Market Volume (K Unit), by Country 2025 & 2033
- Figure 49: Rest of the World Industrial Internet of Things Market Revenue Share (%), by Country 2025 & 2033
- Figure 50: Rest of the World Industrial Internet of Things Market Volume Share (%), by Country 2025 & 2033
List of Tables
- Table 1: Global Industrial Internet of Things Market Revenue Million Forecast, by Type 2020 & 2033
- Table 2: Global Industrial Internet of Things Market Volume K Unit Forecast, by Type 2020 & 2033
- Table 3: Global Industrial Internet of Things Market Revenue Million Forecast, by End-user Vertical 2020 & 2033
- Table 4: Global Industrial Internet of Things Market Volume K Unit Forecast, by End-user Vertical 2020 & 2033
- Table 5: Global Industrial Internet of Things Market Revenue Million Forecast, by Region 2020 & 2033
- Table 6: Global Industrial Internet of Things Market Volume K Unit Forecast, by Region 2020 & 2033
- Table 7: Global Industrial Internet of Things Market Revenue Million Forecast, by Type 2020 & 2033
- Table 8: Global Industrial Internet of Things Market Volume K Unit Forecast, by Type 2020 & 2033
- Table 9: Global Industrial Internet of Things Market Revenue Million Forecast, by End-user Vertical 2020 & 2033
- Table 10: Global Industrial Internet of Things Market Volume K Unit Forecast, by End-user Vertical 2020 & 2033
- Table 11: Global Industrial Internet of Things Market Revenue Million Forecast, by Country 2020 & 2033
- Table 12: Global Industrial Internet of Things Market Volume K Unit Forecast, by Country 2020 & 2033
- Table 13: Global Industrial Internet of Things Market Revenue Million Forecast, by Type 2020 & 2033
- Table 14: Global Industrial Internet of Things Market Volume K Unit Forecast, by Type 2020 & 2033
- Table 15: Global Industrial Internet of Things Market Revenue Million Forecast, by End-user Vertical 2020 & 2033
- Table 16: Global Industrial Internet of Things Market Volume K Unit Forecast, by End-user Vertical 2020 & 2033
- Table 17: Global Industrial Internet of Things Market Revenue Million Forecast, by Country 2020 & 2033
- Table 18: Global Industrial Internet of Things Market Volume K Unit Forecast, by Country 2020 & 2033
- Table 19: Global Industrial Internet of Things Market Revenue Million Forecast, by Type 2020 & 2033
- Table 20: Global Industrial Internet of Things Market Volume K Unit Forecast, by Type 2020 & 2033
- Table 21: Global Industrial Internet of Things Market Revenue Million Forecast, by End-user Vertical 2020 & 2033
- Table 22: Global Industrial Internet of Things Market Volume K Unit Forecast, by End-user Vertical 2020 & 2033
- Table 23: Global Industrial Internet of Things Market Revenue Million Forecast, by Country 2020 & 2033
- Table 24: Global Industrial Internet of Things Market Volume K Unit Forecast, by Country 2020 & 2033
- Table 25: Global Industrial Internet of Things Market Revenue Million Forecast, by Type 2020 & 2033
- Table 26: Global Industrial Internet of Things Market Volume K Unit Forecast, by Type 2020 & 2033
- Table 27: Global Industrial Internet of Things Market Revenue Million Forecast, by End-user Vertical 2020 & 2033
- Table 28: Global Industrial Internet of Things Market Volume K Unit Forecast, by End-user Vertical 2020 & 2033
- Table 29: Global Industrial Internet of Things Market Revenue Million Forecast, by Country 2020 & 2033
- Table 30: Global Industrial Internet of Things Market Volume K Unit Forecast, by Country 2020 & 2033
Frequently Asked Questions
1. What is the projected Compound Annual Growth Rate (CAGR) of the Industrial Internet of Things Market?
The projected CAGR is approximately 34.41%.
2. Which companies are prominent players in the Industrial Internet of Things Market?
Key companies in the market include Honeywell International Inc, NXP Semiconductors NV, IBM Corporation, Telefonaktiebolaget LM Ericsson, Fujitsu Ltd, Cypress Semiconductor Corporation, Telit Communications Plc, Emerson Electric Co, Mitsubishi Electric Corporation, Cisco Systems Inc, Siemens AG, Amazon Web Services Inc, PTC Inc, Robert Bosch GmbH, OMRON Corporation, Oracle Corporation, SAP SE, General Electric Company.
3. What are the main segments of the Industrial Internet of Things Market?
The market segments include Type, End-user Vertical.
4. Can you provide details about the market size?
The market size is estimated to be USD 114.68 Million as of 2022.
5. What are some drivers contributing to market growth?
Proliferation of digitization and adoption of sensors in plants; Growing demand for automated and efficient process.
6. What are the notable trends driving market growth?
Manufacturing to Hold Major Market Share.
7. Are there any restraints impacting market growth?
Issues Related to Security and Privacy of Data and Connectivity of Devices and Interoperability.
8. Can you provide examples of recent developments in the market?
February 2023: Cisco, a multinational digital communications technology conglomerate corporation, added new products to its suite of cloud tools to provide further visibility and control over networks. The new cloud management tools are designed for industrial IoT (IIoT) apps to simplify IT and OT operations dashboards and provide flexible network intelligence for industrial assets. The options will be made available through Cisco's IoT Operations Dashboard.
9. What pricing options are available for accessing the report?
Pricing options include single-user, multi-user, and enterprise licenses priced at USD 4750, USD 5250, and USD 8750 respectively.
10. Is the market size provided in terms of value or volume?
The market size is provided in terms of value, measured in Million and volume, measured in K Unit.
11. Are there any specific market keywords associated with the report?
Yes, the market keyword associated with the report is "Industrial Internet of Things Market," which aids in identifying and referencing the specific market segment covered.
12. How do I determine which pricing option suits my needs best?
The pricing options vary based on user requirements and access needs. Individual users may opt for single-user licenses, while businesses requiring broader access may choose multi-user or enterprise licenses for cost-effective access to the report.
13. Are there any additional resources or data provided in the Industrial Internet of Things Market report?
While the report offers comprehensive insights, it's advisable to review the specific contents or supplementary materials provided to ascertain if additional resources or data are available.
14. How can I stay updated on further developments or reports in the Industrial Internet of Things Market?
To stay informed about further developments, trends, and reports in the Industrial Internet of Things Market, consider subscribing to industry newsletters, following relevant companies and organizations, or regularly checking reputable industry news sources and publications.
Methodology
Step 1 - Identification of Relevant Samples Size from Population Database


Step 2 - Approaches for Defining Global Market Size (Value, Volume* & Price*)

Note*: In applicable scenarios
Step 3 - Data Sources
Primary Research
- Web Analytics
- Survey Reports
- Research Institute
- Latest Research Reports
- Opinion Leaders
Secondary Research
- Annual Reports
- White Paper
- Latest Press Release
- Industry Association
- Paid Database
- Investor Presentations

Step 4 - Data Triangulation
Involves using different sources of information in order to increase the validity of a study
These sources are likely to be stakeholders in a program - participants, other researchers, program staff, other community members, and so on.
Then we put all data in single framework & apply various statistical tools to find out the dynamic on the market.
During the analysis stage, feedback from the stakeholder groups would be compared to determine areas of agreement as well as areas of divergence