

Key Insights
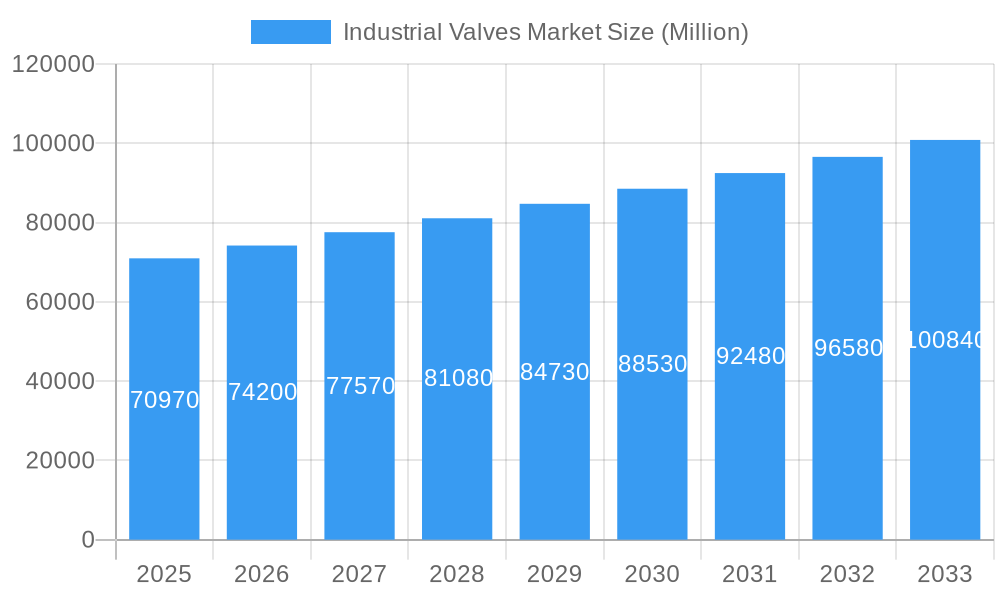
The global industrial valves market, valued at $70.97 billion in 2025, is projected to experience robust growth, driven by the increasing demand across diverse industrial sectors. A Compound Annual Growth Rate (CAGR) of 4.52% from 2025 to 2033 indicates a significant expansion, fueled by several key factors. The rising investments in infrastructure development, particularly in power generation and water management, are major contributors to this growth. Furthermore, the ongoing expansion of the oil and gas industry, coupled with the increasing adoption of automation and smart technologies in industrial processes, is boosting the demand for advanced industrial valves. The market is segmented by valve type (butterfly, ball, globe, gate, plug, and others), product type (quarter-turn, multi-turn, and others), and application (power, water/wastewater, chemicals, oil and gas, and others including food processing, mining, and marine). Growth is expected to be particularly strong in the Asia-Pacific region, driven by rapid industrialization and infrastructure development in countries like China and India.
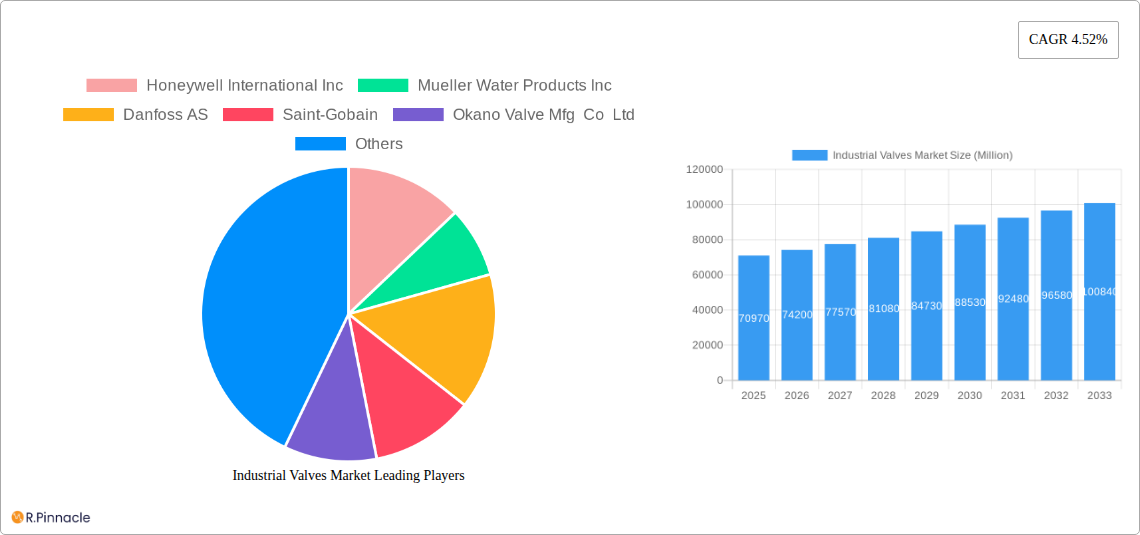
Industrial Valves Market Market Size (In Billion)
Competition in the market is intense, with numerous established players and emerging companies vying for market share. Key players like Honeywell, Mueller Water Products, Danfoss, and Flowserve are leveraging their technological expertise and extensive distribution networks to maintain their positions. However, the market is also witnessing increased participation from regional players, particularly in developing economies. While the market faces certain restraints such as fluctuating raw material prices and potential supply chain disruptions, the overall positive outlook driven by increasing industrial activity and technological advancements is anticipated to outweigh these challenges, ensuring continuous market expansion throughout the forecast period. The market is also expected to witness a shift towards more energy-efficient and sustainable valve technologies in response to growing environmental concerns.
Industrial Valves Market Company Market Share
Industrial Valves Market Report: 2019-2033 Forecast
This comprehensive report provides an in-depth analysis of the global Industrial Valves Market, offering crucial insights for industry professionals, investors, and strategic decision-makers. The report covers the period from 2019 to 2033, with a focus on the 2025-2033 forecast period. Benefit from detailed segmentation analysis, competitive landscape mapping, and key trend identification to inform your business strategies. The market is valued at xx Million in 2025 and is projected to reach xx Million by 2033, exhibiting a CAGR of xx%.
Industrial Valves Market Market Structure & Innovation Trends
The Industrial Valves Market is characterized by a moderately concentrated landscape, with several major players holding significant market share. Honeywell International Inc, Mueller Water Products Inc, Danfoss AS, and Flowserve Corporation are among the key players, each contributing a substantial portion to the overall market volume. However, the market also accommodates numerous smaller players, creating a competitive dynamic.
Market Concentration: The market exhibits a Herfindahl-Hirschman Index (HHI) of xx, suggesting a moderately concentrated market structure. The top 5 players account for approximately xx% of the market share in 2025.
Innovation Drivers: Key innovation drivers include the development of advanced materials (e.g., corrosion-resistant alloys), improved automation and control systems, and the integration of smart technologies for predictive maintenance and remote monitoring.
Regulatory Frameworks: Stringent environmental regulations and safety standards significantly impact the market. Compliance with these standards necessitates the adoption of advanced valve technologies.
Product Substitutes: While few direct substitutes exist for industrial valves, alternative solutions, such as advanced piping systems or specialized flow control technologies, can influence market dynamics.
End-User Demographics: The market's end-user base spans diverse industries, including power generation, water and wastewater management, chemicals, oil and gas, and food processing. Growth in these sectors directly impacts market demand.
M&A Activities: Recent significant mergers and acquisitions (M&As), such as the Flowserve Corporation's acquisition of Velan Inc. in February 2023 for USD 245 Million, underscore the industry's consolidation trends and strategic investments in expanding product portfolios and market reach. These activities, along with others, contribute to a shifting market landscape.
Industrial Valves Market Market Dynamics & Trends
The Industrial Valves Market is experiencing robust growth driven by several factors. The increasing demand for efficient and reliable flow control solutions across various industrial sectors contributes significantly to market expansion. This demand is further fueled by investments in infrastructure projects (especially in developing economies), growth in energy production, and stringent environmental regulations mandating efficient resource management. Technological advancements, such as smart valves with improved monitoring and control capabilities, also stimulate market growth. The market faces some challenges, however, including price fluctuations in raw materials, supply chain disruptions, and intense competition from both established players and emerging market entrants. The market penetration of smart valves is expected to increase from xx% in 2025 to xx% by 2033, driven by the adoption of Industry 4.0 technologies.
The global Industrial Valves Market is projected to experience substantial growth, with a CAGR of xx% during the forecast period (2025-2033). Several factors, such as the increasing adoption of advanced technologies in industrial processes and the growing demand for enhanced safety and efficiency in valve operations, are key growth drivers.
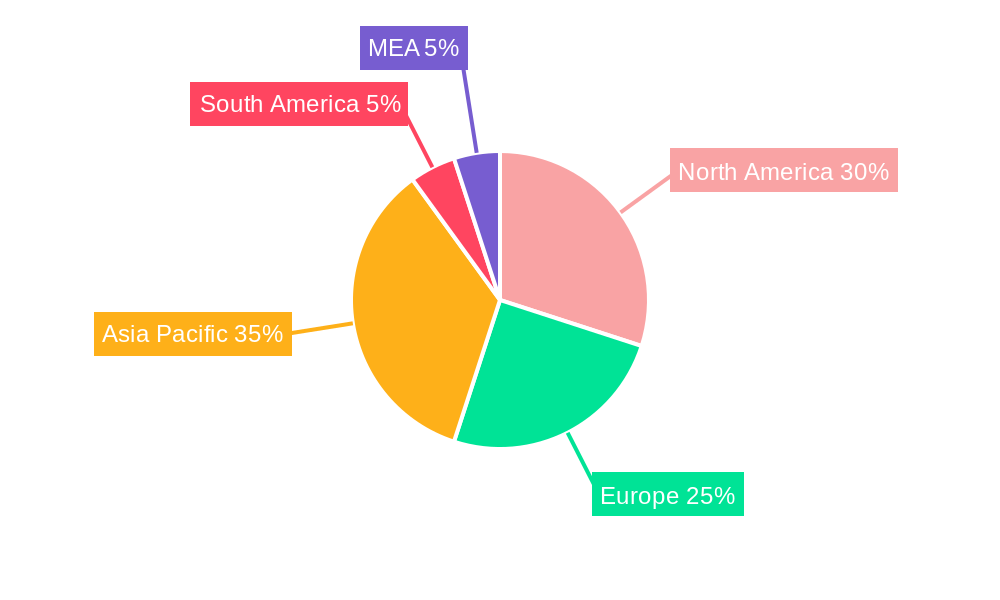
Dominant Regions & Segments in Industrial Valves Market
The Asia-Pacific region is projected to dominate the Industrial Valves Market during the forecast period, driven by rapid industrialization, substantial infrastructure development, and the increasing adoption of advanced technologies. North America and Europe also hold significant market shares, with established industrial sectors and high technology adoption rates.
Key Drivers:
- Asia-Pacific: Rapid industrialization, large-scale infrastructure projects, and rising energy demands.
- North America: Established industrial base, high technology adoption, and stringent environmental regulations.
- Europe: Stringent emission standards, focus on sustainable technologies, and substantial investments in renewable energy infrastructure.
Segment Dominance:
By Type: The Ball Valve segment is expected to dominate the market owing to its versatility, ease of operation, and wide applicability across various industrial sectors.
By Product: Quarter-turn valves dominate due to their speed and ease of operation, while multi-turn valves are preferred for precision control applications.
By Application: The Oil and Gas sector is expected to account for a substantial share due to the significant investment in exploration and extraction activities, followed closely by the Power and Water & Wastewater Management sectors.
Industrial Valves Market Product Innovations
Recent advancements in industrial valves include the development of smart valves with integrated sensors and communication capabilities enabling real-time monitoring and predictive maintenance. Materials science improvements have led to valves with enhanced corrosion resistance and durability, particularly crucial in harsh environments like those found in oil and gas extraction or chemical processing. These innovations enhance operational efficiency, reduce downtime, and improve safety. The increasing adoption of these improved valves reflects the industry’s ongoing focus on optimizing industrial processes.
Report Scope & Segmentation Analysis
This report segments the Industrial Valves Market based on type (Butterfly Valve, Ball Valve, Globe Valve, Gate Valve, Plug Valve, Other Types), product (Quarter-turn Valve, Multi-turn Valve, Other Products), and application (Power, Water and Wastewater Management, Chemicals, Oil and Gas, Other Applications). Each segment's market size, growth projections, and competitive dynamics are analyzed in detail.
Type: Each valve type caters to specific needs, leading to varying market shares and growth trajectories. For example, the ball valve segment is expected to grow at a CAGR of xx% due to its simple design and reliable performance.
Product: Quarter-turn and multi-turn valves represent significant market segments, with growth driven by advancements in materials and actuation mechanisms.
Application: The oil and gas sector drives significant demand, while the water and wastewater industry is seeing growth due to infrastructure upgrades.
Key Drivers of Industrial Valves Market Growth
Several factors are driving the growth of the Industrial Valves Market. These include increasing industrial automation, the growing need for energy-efficient solutions, and the stringent environmental regulations impacting industrial practices. Furthermore, rising investments in infrastructure projects globally, particularly in developing economies, are creating significant opportunities for valve manufacturers. The increasing adoption of smart technologies for improved process control and predictive maintenance also plays a significant role.
Challenges in the Industrial Valves Market Sector
The Industrial Valves Market faces several challenges, including fluctuating raw material prices, supply chain disruptions, and intense competition. These factors directly impact production costs and profitability, potentially leading to price volatility. Additionally, stringent safety and environmental regulations necessitate ongoing investments in compliance, adding to operational expenses.
Emerging Opportunities in Industrial Valves Market
Several emerging opportunities are shaping the future of the Industrial Valves Market. The rise of smart factories and the increasing adoption of Industry 4.0 technologies are driving the demand for advanced, digitally integrated valves. Furthermore, the growing focus on sustainable and energy-efficient operations is creating opportunities for valves with improved energy efficiency and reduced environmental impact. New applications in renewable energy sectors, such as solar and wind power, represent further market expansion opportunities.
Leading Players in the Industrial Valves Market Market
- Honeywell International Inc (Honeywell)
- Mueller Water Products Inc (Mueller Water Products)
- Danfoss AS (Danfoss)
- Saint-Gobain (Saint-Gobain)
- Okano Valve Mfg Co Ltd
- ALFA LAVAL (Alfa Laval)
- Flowserve Corporation (Flowserve)
- The Weir Group PLC (Weir Group)
- Georg Fischer Ltd (Georg Fischer)
- NIBCO Inc (NIBCO)
- Baker Hughes (Baker Hughes)
- Hitachi Ltd (Hitachi)
- Xylem
- Emerson Electric Co (Emerson Electric)
- Zhejiang Dunan Valve Co Ltd
- CIRCOR International Inc (CIRCOR International)
- AVK Holding AS
- ITT Inc (ITT)
- KLINGER Group (KLINGER Group)
- IMI (IMI)
- Crane Co (Crane Co)
- SLB (SLB)
- Valvitalia SpA
- Curtiss-Wright Corporation (Curtiss-Wright)
- TechnipFMC PLC (TechnipFMC)
- KITZ Corporation (KITZ)
Key Developments in Industrial Valves Market Industry
- September 2023: Danfoss India opened a new 43,000 sq ft distribution center in Chennai, expanding its reach and logistics capabilities within the region.
- February 2023: Flowserve Corporation's acquisition of Velan Inc. for USD 245 Million significantly strengthened its market position and product portfolio.
- November 2022: IMI Saudi Industry launched a new 5,000 m2 facility in Dammam, boosting local manufacturing capacity and supporting Saudi Arabia's localization initiatives.
- November 2022: James Walker introduced the Supagraf HT valve stem seal, a significant advancement for high-temperature and corrosive applications.
Future Outlook for Industrial Valves Market Market
The Industrial Valves Market is poised for continued growth, fueled by ongoing industrialization, infrastructure development, and the increasing adoption of advanced technologies. The focus on sustainable and energy-efficient solutions will continue to shape product development and market demand. Strategic partnerships, mergers, and acquisitions are expected to further consolidate the market, driving innovation and expansion into new geographical regions and application areas. The long-term outlook remains positive, with significant potential for growth driven by the increasing integration of smart technologies and the expanding adoption of automated industrial processes.
Industrial Valves Market Segmentation
-
1. Type
- 1.1. Butterfly Valve
- 1.2. Ball Valve
- 1.3. Globe Valve
- 1.4. Gate Valve
- 1.5. Plug Valve
- 1.6. Other Types
-
2. Product
- 2.1. Quarter-turn Valve
- 2.2. Multi-turn Valve
- 2.3. Other Products
-
3. Application
- 3.1. Power
- 3.2. Water and Wastewater Management
- 3.3. Chemicals
- 3.4. Oil and Gas
- 3.5. Other Ap
Industrial Valves Market Segmentation By Geography
-
1. Asia Pacific
- 1.1. China
- 1.2. India
- 1.3. Japan
- 1.4. South Korea
- 1.5. Indonesia
- 1.6. Vietnam
- 1.7. Malaysia
- 1.8. Thailand
- 1.9. Rest of Asia Pacific
-
2. North America
- 2.1. United States
- 2.2. Canada
- 2.3. Mexico
-
3. Europe
- 3.1. Germany
- 3.2. United Kingdom
- 3.3. Italy
- 3.4. France
- 3.5. NORDIC
- 3.6. Turkey
- 3.7. Russia
- 3.8. Spain
- 3.9. Rest of Europe
-
4. South America
- 4.1. Brazil
- 4.2. Argentina
- 4.3. Colombia
- 4.4. Rest of South America
-
5. Middle East and Africa
- 5.1. Saudi Arabia
- 5.2. South Africa
- 5.3. United Arab Emirates
- 5.4. Qatar
- 5.5. Nigeria
- 5.6. Egypt
- 5.7. Rest of Middle East and Africa
Industrial Valves Market Regional Market Share
Geographic Coverage of Industrial Valves Market
Industrial Valves Market REPORT HIGHLIGHTS
| Aspects | Details |
|---|---|
| Study Period | 2020-2034 |
| Base Year | 2025 |
| Estimated Year | 2026 |
| Forecast Period | 2026-2034 |
| Historical Period | 2020-2025 |
| Growth Rate | CAGR of 4.52% from 2020-2034 |
| Segmentation |
|
Table of Contents
- 1. Introduction
- 1.1. Research Scope
- 1.2. Market Segmentation
- 1.3. Research Objective
- 1.4. Definitions and Assumptions
- 2. Executive Summary
- 2.1. Market Snapshot
- 3. Market Dynamics
- 3.1. Market Drivers
- 3.2. Market Restrains
- 3.3. Market Trends
- 3.4. Market Opportunities
- 4. Market Factor Analysis
- 4.1. Porters Five Forces
- 4.1.1. Bargaining Power of Suppliers
- 4.1.2. Bargaining Power of Buyers
- 4.1.3. Threat of New Entrants
- 4.1.4. Threat of Substitutes
- 4.1.5. Competitive Rivalry
- 4.2. PESTEL analysis
- 4.3. BCG Analysis
- 4.3.1. Stars (High Growth, High Market Share)
- 4.3.2. Cash Cows (Low Growth, High Market Share)
- 4.3.3. Question Mark (High Growth, Low Market Share)
- 4.3.4. Dogs (Low Growth, Low Market Share)
- 4.4. Ansoff Matrix Analysis
- 4.5. Supply Chain Analysis
- 4.6. Regulatory Landscape
- 4.7. Current Market Potential and Opportunity Assessment (TAM–SAM–SOM Framework)
- 4.8. PRI Analyst Note
- 4.1. Porters Five Forces
- 5. Market Analysis, Insights and Forecast 2021-2033
- 5.1. Market Analysis, Insights and Forecast - by Type
- 5.1.1. Butterfly Valve
- 5.1.2. Ball Valve
- 5.1.3. Globe Valve
- 5.1.4. Gate Valve
- 5.1.5. Plug Valve
- 5.1.6. Other Types
- 5.2. Market Analysis, Insights and Forecast - by Product
- 5.2.1. Quarter-turn Valve
- 5.2.2. Multi-turn Valve
- 5.2.3. Other Products
- 5.3. Market Analysis, Insights and Forecast - by Application
- 5.3.1. Power
- 5.3.2. Water and Wastewater Management
- 5.3.3. Chemicals
- 5.3.4. Oil and Gas
- 5.3.5. Other Ap
- 5.4. Market Analysis, Insights and Forecast - by Region
- 5.4.1. Asia Pacific
- 5.4.2. North America
- 5.4.3. Europe
- 5.4.4. South America
- 5.4.5. Middle East and Africa
- 5.1. Market Analysis, Insights and Forecast - by Type
- 6. Global Industrial Valves Market Analysis, Insights and Forecast, 2021-2033
- 6.1. Market Analysis, Insights and Forecast - by Type
- 6.1.1. Butterfly Valve
- 6.1.2. Ball Valve
- 6.1.3. Globe Valve
- 6.1.4. Gate Valve
- 6.1.5. Plug Valve
- 6.1.6. Other Types
- 6.2. Market Analysis, Insights and Forecast - by Product
- 6.2.1. Quarter-turn Valve
- 6.2.2. Multi-turn Valve
- 6.2.3. Other Products
- 6.3. Market Analysis, Insights and Forecast - by Application
- 6.3.1. Power
- 6.3.2. Water and Wastewater Management
- 6.3.3. Chemicals
- 6.3.4. Oil and Gas
- 6.3.5. Other Ap
- 6.1. Market Analysis, Insights and Forecast - by Type
- 7. Asia Pacific Industrial Valves Market Analysis, Insights and Forecast, 2020-2032
- 7.1. Market Analysis, Insights and Forecast - by Type
- 7.1.1. Butterfly Valve
- 7.1.2. Ball Valve
- 7.1.3. Globe Valve
- 7.1.4. Gate Valve
- 7.1.5. Plug Valve
- 7.1.6. Other Types
- 7.2. Market Analysis, Insights and Forecast - by Product
- 7.2.1. Quarter-turn Valve
- 7.2.2. Multi-turn Valve
- 7.2.3. Other Products
- 7.3. Market Analysis, Insights and Forecast - by Application
- 7.3.1. Power
- 7.3.2. Water and Wastewater Management
- 7.3.3. Chemicals
- 7.3.4. Oil and Gas
- 7.3.5. Other Ap
- 7.1. Market Analysis, Insights and Forecast - by Type
- 8. North America Industrial Valves Market Analysis, Insights and Forecast, 2020-2032
- 8.1. Market Analysis, Insights and Forecast - by Type
- 8.1.1. Butterfly Valve
- 8.1.2. Ball Valve
- 8.1.3. Globe Valve
- 8.1.4. Gate Valve
- 8.1.5. Plug Valve
- 8.1.6. Other Types
- 8.2. Market Analysis, Insights and Forecast - by Product
- 8.2.1. Quarter-turn Valve
- 8.2.2. Multi-turn Valve
- 8.2.3. Other Products
- 8.3. Market Analysis, Insights and Forecast - by Application
- 8.3.1. Power
- 8.3.2. Water and Wastewater Management
- 8.3.3. Chemicals
- 8.3.4. Oil and Gas
- 8.3.5. Other Ap
- 8.1. Market Analysis, Insights and Forecast - by Type
- 9. Europe Industrial Valves Market Analysis, Insights and Forecast, 2020-2032
- 9.1. Market Analysis, Insights and Forecast - by Type
- 9.1.1. Butterfly Valve
- 9.1.2. Ball Valve
- 9.1.3. Globe Valve
- 9.1.4. Gate Valve
- 9.1.5. Plug Valve
- 9.1.6. Other Types
- 9.2. Market Analysis, Insights and Forecast - by Product
- 9.2.1. Quarter-turn Valve
- 9.2.2. Multi-turn Valve
- 9.2.3. Other Products
- 9.3. Market Analysis, Insights and Forecast - by Application
- 9.3.1. Power
- 9.3.2. Water and Wastewater Management
- 9.3.3. Chemicals
- 9.3.4. Oil and Gas
- 9.3.5. Other Ap
- 9.1. Market Analysis, Insights and Forecast - by Type
- 10. South America Industrial Valves Market Analysis, Insights and Forecast, 2020-2032
- 10.1. Market Analysis, Insights and Forecast - by Type
- 10.1.1. Butterfly Valve
- 10.1.2. Ball Valve
- 10.1.3. Globe Valve
- 10.1.4. Gate Valve
- 10.1.5. Plug Valve
- 10.1.6. Other Types
- 10.2. Market Analysis, Insights and Forecast - by Product
- 10.2.1. Quarter-turn Valve
- 10.2.2. Multi-turn Valve
- 10.2.3. Other Products
- 10.3. Market Analysis, Insights and Forecast - by Application
- 10.3.1. Power
- 10.3.2. Water and Wastewater Management
- 10.3.3. Chemicals
- 10.3.4. Oil and Gas
- 10.3.5. Other Ap
- 10.1. Market Analysis, Insights and Forecast - by Type
- 11. Middle East and Africa Industrial Valves Market Analysis, Insights and Forecast, 2020-2032
- 11.1. Market Analysis, Insights and Forecast - by Type
- 11.1.1. Butterfly Valve
- 11.1.2. Ball Valve
- 11.1.3. Globe Valve
- 11.1.4. Gate Valve
- 11.1.5. Plug Valve
- 11.1.6. Other Types
- 11.2. Market Analysis, Insights and Forecast - by Product
- 11.2.1. Quarter-turn Valve
- 11.2.2. Multi-turn Valve
- 11.2.3. Other Products
- 11.3. Market Analysis, Insights and Forecast - by Application
- 11.3.1. Power
- 11.3.2. Water and Wastewater Management
- 11.3.3. Chemicals
- 11.3.4. Oil and Gas
- 11.3.5. Other Ap
- 11.1. Market Analysis, Insights and Forecast - by Type
- 12. Competitive Analysis
- 12.1. Company Profiles
- 12.1.1 Honeywell International Inc
- 12.1.1.1. Company Overview
- 12.1.1.2. Products
- 12.1.1.3. Company Financials
- 12.1.1.4. SWOT Analysis
- 12.1.2 Mueller Water Products Inc
- 12.1.2.1. Company Overview
- 12.1.2.2. Products
- 12.1.2.3. Company Financials
- 12.1.2.4. SWOT Analysis
- 12.1.3 Danfoss AS
- 12.1.3.1. Company Overview
- 12.1.3.2. Products
- 12.1.3.3. Company Financials
- 12.1.3.4. SWOT Analysis
- 12.1.4 Saint-Gobain
- 12.1.4.1. Company Overview
- 12.1.4.2. Products
- 12.1.4.3. Company Financials
- 12.1.4.4. SWOT Analysis
- 12.1.5 Okano Valve Mfg Co Ltd
- 12.1.5.1. Company Overview
- 12.1.5.2. Products
- 12.1.5.3. Company Financials
- 12.1.5.4. SWOT Analysis
- 12.1.6 ALFA LAVAL
- 12.1.6.1. Company Overview
- 12.1.6.2. Products
- 12.1.6.3. Company Financials
- 12.1.6.4. SWOT Analysis
- 12.1.7 Flowserve Corporation
- 12.1.7.1. Company Overview
- 12.1.7.2. Products
- 12.1.7.3. Company Financials
- 12.1.7.4. SWOT Analysis
- 12.1.8 The Weir Group PLC
- 12.1.8.1. Company Overview
- 12.1.8.2. Products
- 12.1.8.3. Company Financials
- 12.1.8.4. SWOT Analysis
- 12.1.9 Georg Fischer Ltd
- 12.1.9.1. Company Overview
- 12.1.9.2. Products
- 12.1.9.3. Company Financials
- 12.1.9.4. SWOT Analysis
- 12.1.10 NIBCO Inc
- 12.1.10.1. Company Overview
- 12.1.10.2. Products
- 12.1.10.3. Company Financials
- 12.1.10.4. SWOT Analysis
- 12.1.11 Baker Hughes
- 12.1.11.1. Company Overview
- 12.1.11.2. Products
- 12.1.11.3. Company Financials
- 12.1.11.4. SWOT Analysis
- 12.1.12 Hitachi Ltd
- 12.1.12.1. Company Overview
- 12.1.12.2. Products
- 12.1.12.3. Company Financials
- 12.1.12.4. SWOT Analysis
- 12.1.13 Xylem*List Not Exhaustive
- 12.1.13.1. Company Overview
- 12.1.13.2. Products
- 12.1.13.3. Company Financials
- 12.1.13.4. SWOT Analysis
- 12.1.14 Emerson Electric Co
- 12.1.14.1. Company Overview
- 12.1.14.2. Products
- 12.1.14.3. Company Financials
- 12.1.14.4. SWOT Analysis
- 12.1.15 Zhejiang Dunan Valve Co Ltd
- 12.1.15.1. Company Overview
- 12.1.15.2. Products
- 12.1.15.3. Company Financials
- 12.1.15.4. SWOT Analysis
- 12.1.16 CIRCOR International Inc
- 12.1.16.1. Company Overview
- 12.1.16.2. Products
- 12.1.16.3. Company Financials
- 12.1.16.4. SWOT Analysis
- 12.1.17 AVK Holding AS
- 12.1.17.1. Company Overview
- 12.1.17.2. Products
- 12.1.17.3. Company Financials
- 12.1.17.4. SWOT Analysis
- 12.1.18 ITT Inc
- 12.1.18.1. Company Overview
- 12.1.18.2. Products
- 12.1.18.3. Company Financials
- 12.1.18.4. SWOT Analysis
- 12.1.19 KLINGER Group
- 12.1.19.1. Company Overview
- 12.1.19.2. Products
- 12.1.19.3. Company Financials
- 12.1.19.4. SWOT Analysis
- 12.1.20 IMI
- 12.1.20.1. Company Overview
- 12.1.20.2. Products
- 12.1.20.3. Company Financials
- 12.1.20.4. SWOT Analysis
- 12.1.21 Crane Co
- 12.1.21.1. Company Overview
- 12.1.21.2. Products
- 12.1.21.3. Company Financials
- 12.1.21.4. SWOT Analysis
- 12.1.22 SLB
- 12.1.22.1. Company Overview
- 12.1.22.2. Products
- 12.1.22.3. Company Financials
- 12.1.22.4. SWOT Analysis
- 12.1.23 Valvitalia SpA
- 12.1.23.1. Company Overview
- 12.1.23.2. Products
- 12.1.23.3. Company Financials
- 12.1.23.4. SWOT Analysis
- 12.1.24 Curtiss-Wright Corporation
- 12.1.24.1. Company Overview
- 12.1.24.2. Products
- 12.1.24.3. Company Financials
- 12.1.24.4. SWOT Analysis
- 12.1.25 TechnipFMC PLC
- 12.1.25.1. Company Overview
- 12.1.25.2. Products
- 12.1.25.3. Company Financials
- 12.1.25.4. SWOT Analysis
- 12.1.26 KITZ Corporation
- 12.1.26.1. Company Overview
- 12.1.26.2. Products
- 12.1.26.3. Company Financials
- 12.1.26.4. SWOT Analysis
- 12.1.1 Honeywell International Inc
- 12.2. Market Entropy
- 12.2.1 Company's Key Areas Served
- 12.2.2 Recent Developments
- 12.3. Company Market Share Analysis 2025
- 12.3.1 Top 5 Companies Market Share Analysis
- 12.3.2 Top 3 Companies Market Share Analysis
- 12.4. List of Potential Customers
- 13. Research Methodology
List of Figures
- Figure 1: Global Industrial Valves Market Revenue Breakdown (Million, %) by Region 2025 & 2033
- Figure 2: Asia Pacific Industrial Valves Market Revenue (Million), by Type 2025 & 2033
- Figure 3: Asia Pacific Industrial Valves Market Revenue Share (%), by Type 2025 & 2033
- Figure 4: Asia Pacific Industrial Valves Market Revenue (Million), by Product 2025 & 2033
- Figure 5: Asia Pacific Industrial Valves Market Revenue Share (%), by Product 2025 & 2033
- Figure 6: Asia Pacific Industrial Valves Market Revenue (Million), by Application 2025 & 2033
- Figure 7: Asia Pacific Industrial Valves Market Revenue Share (%), by Application 2025 & 2033
- Figure 8: Asia Pacific Industrial Valves Market Revenue (Million), by Country 2025 & 2033
- Figure 9: Asia Pacific Industrial Valves Market Revenue Share (%), by Country 2025 & 2033
- Figure 10: North America Industrial Valves Market Revenue (Million), by Type 2025 & 2033
- Figure 11: North America Industrial Valves Market Revenue Share (%), by Type 2025 & 2033
- Figure 12: North America Industrial Valves Market Revenue (Million), by Product 2025 & 2033
- Figure 13: North America Industrial Valves Market Revenue Share (%), by Product 2025 & 2033
- Figure 14: North America Industrial Valves Market Revenue (Million), by Application 2025 & 2033
- Figure 15: North America Industrial Valves Market Revenue Share (%), by Application 2025 & 2033
- Figure 16: North America Industrial Valves Market Revenue (Million), by Country 2025 & 2033
- Figure 17: North America Industrial Valves Market Revenue Share (%), by Country 2025 & 2033
- Figure 18: Europe Industrial Valves Market Revenue (Million), by Type 2025 & 2033
- Figure 19: Europe Industrial Valves Market Revenue Share (%), by Type 2025 & 2033
- Figure 20: Europe Industrial Valves Market Revenue (Million), by Product 2025 & 2033
- Figure 21: Europe Industrial Valves Market Revenue Share (%), by Product 2025 & 2033
- Figure 22: Europe Industrial Valves Market Revenue (Million), by Application 2025 & 2033
- Figure 23: Europe Industrial Valves Market Revenue Share (%), by Application 2025 & 2033
- Figure 24: Europe Industrial Valves Market Revenue (Million), by Country 2025 & 2033
- Figure 25: Europe Industrial Valves Market Revenue Share (%), by Country 2025 & 2033
- Figure 26: South America Industrial Valves Market Revenue (Million), by Type 2025 & 2033
- Figure 27: South America Industrial Valves Market Revenue Share (%), by Type 2025 & 2033
- Figure 28: South America Industrial Valves Market Revenue (Million), by Product 2025 & 2033
- Figure 29: South America Industrial Valves Market Revenue Share (%), by Product 2025 & 2033
- Figure 30: South America Industrial Valves Market Revenue (Million), by Application 2025 & 2033
- Figure 31: South America Industrial Valves Market Revenue Share (%), by Application 2025 & 2033
- Figure 32: South America Industrial Valves Market Revenue (Million), by Country 2025 & 2033
- Figure 33: South America Industrial Valves Market Revenue Share (%), by Country 2025 & 2033
- Figure 34: Middle East and Africa Industrial Valves Market Revenue (Million), by Type 2025 & 2033
- Figure 35: Middle East and Africa Industrial Valves Market Revenue Share (%), by Type 2025 & 2033
- Figure 36: Middle East and Africa Industrial Valves Market Revenue (Million), by Product 2025 & 2033
- Figure 37: Middle East and Africa Industrial Valves Market Revenue Share (%), by Product 2025 & 2033
- Figure 38: Middle East and Africa Industrial Valves Market Revenue (Million), by Application 2025 & 2033
- Figure 39: Middle East and Africa Industrial Valves Market Revenue Share (%), by Application 2025 & 2033
- Figure 40: Middle East and Africa Industrial Valves Market Revenue (Million), by Country 2025 & 2033
- Figure 41: Middle East and Africa Industrial Valves Market Revenue Share (%), by Country 2025 & 2033
List of Tables
- Table 1: Global Industrial Valves Market Revenue Million Forecast, by Type 2020 & 2033
- Table 2: Global Industrial Valves Market Revenue Million Forecast, by Product 2020 & 2033
- Table 3: Global Industrial Valves Market Revenue Million Forecast, by Application 2020 & 2033
- Table 4: Global Industrial Valves Market Revenue Million Forecast, by Region 2020 & 2033
- Table 5: Global Industrial Valves Market Revenue Million Forecast, by Type 2020 & 2033
- Table 6: Global Industrial Valves Market Revenue Million Forecast, by Product 2020 & 2033
- Table 7: Global Industrial Valves Market Revenue Million Forecast, by Application 2020 & 2033
- Table 8: Global Industrial Valves Market Revenue Million Forecast, by Country 2020 & 2033
- Table 9: China Industrial Valves Market Revenue (Million) Forecast, by Application 2020 & 2033
- Table 10: India Industrial Valves Market Revenue (Million) Forecast, by Application 2020 & 2033
- Table 11: Japan Industrial Valves Market Revenue (Million) Forecast, by Application 2020 & 2033
- Table 12: South Korea Industrial Valves Market Revenue (Million) Forecast, by Application 2020 & 2033
- Table 13: Indonesia Industrial Valves Market Revenue (Million) Forecast, by Application 2020 & 2033
- Table 14: Vietnam Industrial Valves Market Revenue (Million) Forecast, by Application 2020 & 2033
- Table 15: Malaysia Industrial Valves Market Revenue (Million) Forecast, by Application 2020 & 2033
- Table 16: Thailand Industrial Valves Market Revenue (Million) Forecast, by Application 2020 & 2033
- Table 17: Rest of Asia Pacific Industrial Valves Market Revenue (Million) Forecast, by Application 2020 & 2033
- Table 18: Global Industrial Valves Market Revenue Million Forecast, by Type 2020 & 2033
- Table 19: Global Industrial Valves Market Revenue Million Forecast, by Product 2020 & 2033
- Table 20: Global Industrial Valves Market Revenue Million Forecast, by Application 2020 & 2033
- Table 21: Global Industrial Valves Market Revenue Million Forecast, by Country 2020 & 2033
- Table 22: United States Industrial Valves Market Revenue (Million) Forecast, by Application 2020 & 2033
- Table 23: Canada Industrial Valves Market Revenue (Million) Forecast, by Application 2020 & 2033
- Table 24: Mexico Industrial Valves Market Revenue (Million) Forecast, by Application 2020 & 2033
- Table 25: Global Industrial Valves Market Revenue Million Forecast, by Type 2020 & 2033
- Table 26: Global Industrial Valves Market Revenue Million Forecast, by Product 2020 & 2033
- Table 27: Global Industrial Valves Market Revenue Million Forecast, by Application 2020 & 2033
- Table 28: Global Industrial Valves Market Revenue Million Forecast, by Country 2020 & 2033
- Table 29: Germany Industrial Valves Market Revenue (Million) Forecast, by Application 2020 & 2033
- Table 30: United Kingdom Industrial Valves Market Revenue (Million) Forecast, by Application 2020 & 2033
- Table 31: Italy Industrial Valves Market Revenue (Million) Forecast, by Application 2020 & 2033
- Table 32: France Industrial Valves Market Revenue (Million) Forecast, by Application 2020 & 2033
- Table 33: NORDIC Industrial Valves Market Revenue (Million) Forecast, by Application 2020 & 2033
- Table 34: Turkey Industrial Valves Market Revenue (Million) Forecast, by Application 2020 & 2033
- Table 35: Russia Industrial Valves Market Revenue (Million) Forecast, by Application 2020 & 2033
- Table 36: Spain Industrial Valves Market Revenue (Million) Forecast, by Application 2020 & 2033
- Table 37: Rest of Europe Industrial Valves Market Revenue (Million) Forecast, by Application 2020 & 2033
- Table 38: Global Industrial Valves Market Revenue Million Forecast, by Type 2020 & 2033
- Table 39: Global Industrial Valves Market Revenue Million Forecast, by Product 2020 & 2033
- Table 40: Global Industrial Valves Market Revenue Million Forecast, by Application 2020 & 2033
- Table 41: Global Industrial Valves Market Revenue Million Forecast, by Country 2020 & 2033
- Table 42: Brazil Industrial Valves Market Revenue (Million) Forecast, by Application 2020 & 2033
- Table 43: Argentina Industrial Valves Market Revenue (Million) Forecast, by Application 2020 & 2033
- Table 44: Colombia Industrial Valves Market Revenue (Million) Forecast, by Application 2020 & 2033
- Table 45: Rest of South America Industrial Valves Market Revenue (Million) Forecast, by Application 2020 & 2033
- Table 46: Global Industrial Valves Market Revenue Million Forecast, by Type 2020 & 2033
- Table 47: Global Industrial Valves Market Revenue Million Forecast, by Product 2020 & 2033
- Table 48: Global Industrial Valves Market Revenue Million Forecast, by Application 2020 & 2033
- Table 49: Global Industrial Valves Market Revenue Million Forecast, by Country 2020 & 2033
- Table 50: Saudi Arabia Industrial Valves Market Revenue (Million) Forecast, by Application 2020 & 2033
- Table 51: South Africa Industrial Valves Market Revenue (Million) Forecast, by Application 2020 & 2033
- Table 52: United Arab Emirates Industrial Valves Market Revenue (Million) Forecast, by Application 2020 & 2033
- Table 53: Qatar Industrial Valves Market Revenue (Million) Forecast, by Application 2020 & 2033
- Table 54: Nigeria Industrial Valves Market Revenue (Million) Forecast, by Application 2020 & 2033
- Table 55: Egypt Industrial Valves Market Revenue (Million) Forecast, by Application 2020 & 2033
- Table 56: Rest of Middle East and Africa Industrial Valves Market Revenue (Million) Forecast, by Application 2020 & 2033
Frequently Asked Questions
1. What is the projected Compound Annual Growth Rate (CAGR) of the Industrial Valves Market?
The projected CAGR is approximately 4.52%.
2. Which companies are prominent players in the Industrial Valves Market?
Key companies in the market include Honeywell International Inc, Mueller Water Products Inc, Danfoss AS, Saint-Gobain, Okano Valve Mfg Co Ltd, ALFA LAVAL, Flowserve Corporation, The Weir Group PLC, Georg Fischer Ltd, NIBCO Inc, Baker Hughes, Hitachi Ltd, Xylem*List Not Exhaustive, Emerson Electric Co, Zhejiang Dunan Valve Co Ltd, CIRCOR International Inc, AVK Holding AS, ITT Inc, KLINGER Group, IMI, Crane Co, SLB, Valvitalia SpA, Curtiss-Wright Corporation, TechnipFMC PLC, KITZ Corporation.
3. What are the main segments of the Industrial Valves Market?
The market segments include Type, Product, Application.
4. Can you provide details about the market size?
The market size is estimated to be USD 70.97 Million as of 2022.
5. What are some drivers contributing to market growth?
Growing Demand from the Power and Chemical Industry; Increase in Demand for Desalination Activity.
6. What are the notable trends driving market growth?
Increasing Demand from the Power Industry.
7. Are there any restraints impacting market growth?
Stagnant Industrial Growth in Developed Countries; Other Restraints.
8. Can you provide examples of recent developments in the market?
September 2023: Danfoss India opened a new India distribution center in Chennai, India, that is spread over 43,000 square feet and has a 4,000 pallet position facility to support growth plans. This new distribution unit will likely aggregate Danfoss products from Asia, Europe, Latin America, and Denmark.
9. What pricing options are available for accessing the report?
Pricing options include single-user, multi-user, and enterprise licenses priced at USD 4750, USD 5250, and USD 8750 respectively.
10. Is the market size provided in terms of value or volume?
The market size is provided in terms of value, measured in Million.
11. Are there any specific market keywords associated with the report?
Yes, the market keyword associated with the report is "Industrial Valves Market," which aids in identifying and referencing the specific market segment covered.
12. How do I determine which pricing option suits my needs best?
The pricing options vary based on user requirements and access needs. Individual users may opt for single-user licenses, while businesses requiring broader access may choose multi-user or enterprise licenses for cost-effective access to the report.
13. Are there any additional resources or data provided in the Industrial Valves Market report?
While the report offers comprehensive insights, it's advisable to review the specific contents or supplementary materials provided to ascertain if additional resources or data are available.
14. How can I stay updated on further developments or reports in the Industrial Valves Market?
To stay informed about further developments, trends, and reports in the Industrial Valves Market, consider subscribing to industry newsletters, following relevant companies and organizations, or regularly checking reputable industry news sources and publications.
Methodology
Step 1 - Identification of Relevant Samples Size from Population Database


Step 2 - Approaches for Defining Global Market Size (Value, Volume* & Price*)

Note*: In applicable scenarios
Step 3 - Data Sources
Primary Research
- Web Analytics
- Survey Reports
- Research Institute
- Latest Research Reports
- Opinion Leaders
Secondary Research
- Annual Reports
- White Paper
- Latest Press Release
- Industry Association
- Paid Database
- Investor Presentations

Step 4 - Data Triangulation
Involves using different sources of information in order to increase the validity of a study
These sources are likely to be stakeholders in a program - participants, other researchers, program staff, other community members, and so on.
Then we put all data in single framework & apply various statistical tools to find out the dynamic on the market.
During the analysis stage, feedback from the stakeholder groups would be compared to determine areas of agreement as well as areas of divergence