

Key Insights
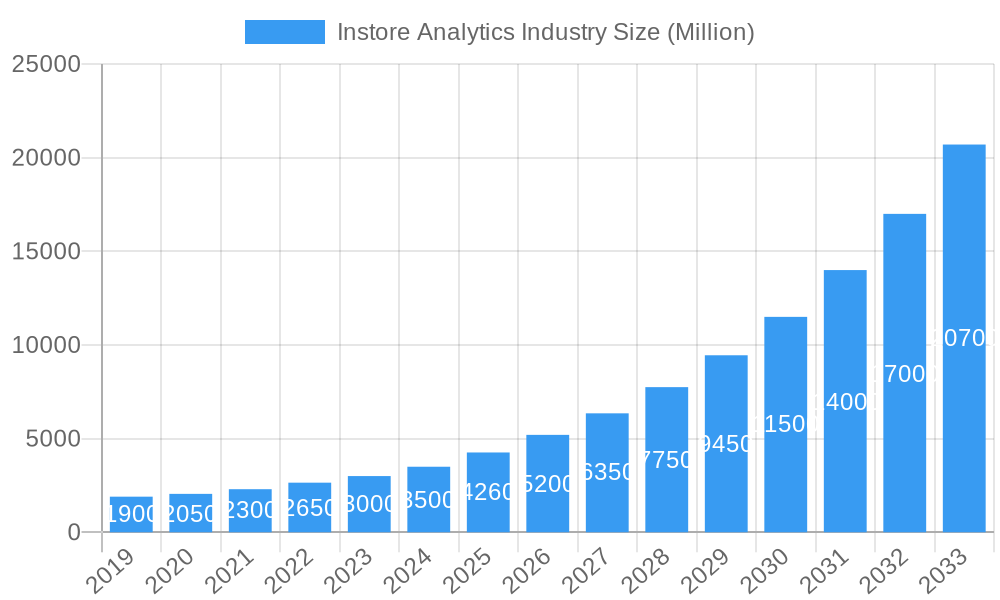
The Instore Analytics industry is poised for exceptional growth, currently valued at $4.26 billion and projected to expand at a robust Compound Annual Growth Rate (CAGR) of 24.23% over the forecast period of 2025-2033. This significant expansion is fueled by an increasing need among retailers to understand and optimize the in-store customer journey, enhance operational efficiency, and drive sales. Key drivers include the growing adoption of advanced technologies like AI and IoT for real-time data collection and analysis, the demand for personalized customer experiences, and the imperative for retailers to gain a competitive edge in an increasingly data-driven market. The market is segmented across various components, including software and services, with deployment models ranging from cloud-based solutions to on-premises systems. Large enterprises and small to medium-sized businesses are both actively investing in these solutions to manage customer interactions, ensure risk and compliance, streamline store operations, and optimize merchandise planning.
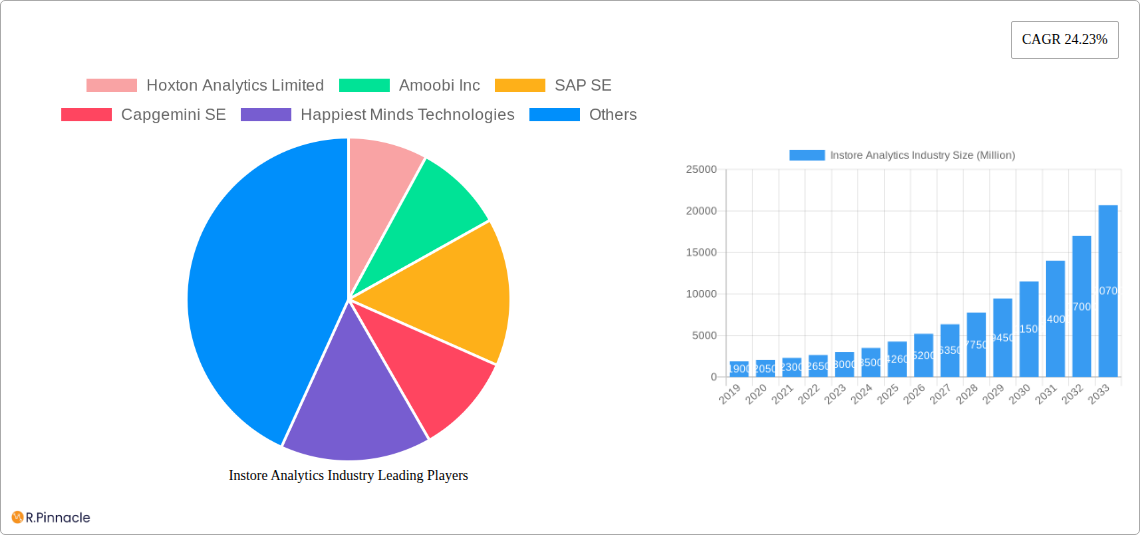
Instore Analytics Industry Market Size (In Billion)
The instore analytics market is witnessing a strong surge driven by the imperative for retailers to bridge the gap between online and offline shopping experiences. The ability to gain granular insights into customer behavior within physical stores, from foot traffic patterns and dwell times to purchase journeys and product interactions, is paramount. This has led to significant investments in advanced solutions that leverage technologies such as video analytics, Wi-Fi tracking, and sensor networks. While the market benefits from the overarching trend of digital transformation in retail, it also faces challenges such as data privacy concerns and the need for significant upfront investment in hardware and software. Nevertheless, the projected CAGR of 24.23% underscores the immense value proposition of instore analytics in driving operational excellence and enhancing profitability for retailers globally. The market's growth is expected to be particularly strong in regions like North America and Europe, with a rapidly expanding presence in Asia Pacific as well.
Instore Analytics Industry Company Market Share
This in-depth report offers a definitive analysis of the global Instore Analytics Industry, covering market size, trends, growth drivers, challenges, and future projections from the historical period of 2019–2024 to a forecast period extending to 2033. Leveraging a base year of 2025, this study provides actionable insights for industry professionals, stakeholders, and investors seeking to understand and capitalize on the evolving instore analytics landscape. Explore key segments, dominant regions, product innovations, and strategic developments from leading players like Hoxton Analytics Limited, Amoobi Inc, SAP SE, and more.
Instore Analytics Industry Market Structure & Innovation Trends
The instore analytics market exhibits a moderate to high concentration, with a few major players holding significant market share, estimated to be XX Million in 2025. Innovation is primarily driven by advancements in AI, machine learning, IoT, and computer vision, enabling more sophisticated data collection and analysis for retailers. Regulatory frameworks surrounding data privacy, such as GDPR and CCPA, are increasingly influencing market strategies and product development. Product substitutes, including traditional POS systems and manual customer tracking methods, are gradually being replaced by advanced analytics solutions. End-user demographics are expanding beyond large enterprises to include a growing number of small and medium enterprises (SMEs) seeking to optimize their physical store performance. Mergers and acquisitions (M&A) are a notable trend, with deal values in the instore analytics sector reaching an estimated XX Million over the historical period, indicating a drive for consolidation and expansion of capabilities.
Instore Analytics Industry Market Dynamics & Trends
The instore analytics market is experiencing robust growth, fueled by a confluence of escalating retail competition and the imperative for data-driven decision-making. The XX% Compound Annual Growth Rate (CAGR) projected for the forecast period highlights the significant expansion potential. Key growth drivers include the increasing need for retailers to understand customer behavior, optimize store layouts, manage inventory effectively, and enhance the overall in-store experience. Technological disruptions are central to this growth, with the pervasive adoption of AI and machine learning transforming raw data into actionable insights. The integration of IoT devices, such as smart shelves and sensors, provides real-time data streams on foot traffic, dwell times, and product interactions. Consumer preferences are increasingly shifting towards personalized shopping experiences, compelling retailers to leverage instore analytics to tailor offers and recommendations. Competitive dynamics are intensifying, with established technology giants and innovative startups vying for market share. Companies are differentiating themselves through advanced analytics capabilities, user-friendly interfaces, and specialized solutions for various retail applications like customer management and store operations. The market penetration of sophisticated instore analytics solutions is expected to reach XX% by 2033, signifying a widespread adoption across the retail sector. The estimated market size for instore analytics is projected to reach XX Million by 2033.
Dominant Regions & Segments in Instore Analytics Industry
North America currently dominates the instore analytics market, driven by early adoption of advanced technologies, a mature retail sector, and significant investment in R&D. The United States, in particular, leads in terms of market size and the deployment of sophisticated instore analytics solutions.
Key Segment Dominance:
- Component: Software
- Drivers: The increasing demand for advanced analytical tools, predictive modeling capabilities, and integrated platforms for data visualization and reporting fuels the dominance of software solutions. The ability to process and analyze vast amounts of data efficiently is a critical factor.
- Analysis: Software forms the core of instore analytics, enabling functionalities such as customer journey mapping, sentiment analysis, and sales forecasting. Cloud-based software solutions are gaining significant traction due to their scalability, flexibility, and cost-effectiveness.
- Deployment: Cloud
- Drivers: The scalability, accessibility, and cost-efficiency of cloud-based deployments make them the preferred choice for retailers of all sizes. Reduced IT infrastructure burden and faster deployment times are key advantages.
- Analysis: Cloud deployment offers seamless integration with existing retail systems and provides a robust platform for data storage and processing. This trend is expected to continue, with cloud solutions accounting for a substantial portion of the market share.
- Organization Size: Large Enterprises
- Drivers: Larger enterprises possess the financial resources and the complex operational needs that necessitate advanced instore analytics for optimizing multi-location retail operations, understanding diverse customer segments, and managing extensive product portfolios.
- Analysis: Large retailers are at the forefront of adopting comprehensive instore analytics suites to gain a competitive edge. They often implement integrated solutions that encompass multiple applications, from customer management to merchandise optimization.
- Application: Store Operations Management
- Drivers: The direct impact of store operations on customer satisfaction and profitability makes this a critical application. Optimizing staffing, managing queues, and improving store layout directly translate to enhanced sales and operational efficiency.
- Analysis: Instore analytics provides invaluable insights for optimizing staffing schedules based on predicted foot traffic, analyzing dwell times in different store zones, and identifying bottlenecks in customer flow. This leads to improved resource allocation and a better shopping experience.
While other segments like Services, On-Premises, SMEs, Customer Management, Risk and Compliance Management, and Merchandise Management are also crucial and experiencing significant growth, the aforementioned segments currently hold a dominant position due to their foundational importance and widespread adoption. The market size for instore analytics is projected to reach XX Million by 2033.
Instore Analytics Industry Product Innovations
Recent product innovations in the instore analytics industry are characterized by the integration of advanced AI and machine learning algorithms for deeper customer insights. Companies are developing solutions that offer real-time foot traffic analysis, heat mapping of store areas, and predictive modeling for inventory management. Enhanced computer vision capabilities allow for more accurate demographic analysis and the tracking of customer interactions with products. The focus is on delivering user-friendly dashboards and actionable recommendations that directly impact sales and customer experience. Competitive advantages are being gained through the ability to seamlessly integrate with existing POS systems and e-commerce platforms, providing a unified view of the customer journey. The market size for instore analytics is projected to reach XX Million by 2033.
Instore Analytics Industry Report Scope & Segmentation Analysis
This report comprehensively segments the Instore Analytics Industry across several key dimensions to provide granular insights.
- Component: This segmentation analyzes the market split between Software solutions, which provide the analytical engines and platforms, and Services, encompassing implementation, consulting, and ongoing support.
- Deployment: We dissect the market based on deployment models, distinguishing between Cloud-based solutions, leveraging remote servers for scalability and accessibility, and On-Premises solutions, installed and managed within the client's own IT infrastructure.
- Organization Size: The analysis categorizes the market by Large Enterprises, characterized by extensive operations and significant data volumes, and Small & Medium Enterprises (SMEs), who are increasingly adopting cost-effective and scalable instore analytics solutions.
- Application: This crucial segmentation explores the diverse applications of instore analytics, including Customer Management (understanding behavior, personalization), Risk and Compliance Management (loss prevention, security), Store Operations Management (layout optimization, staffing), and Merchandise Management (inventory, product placement), alongside Other Applications that may emerge. Growth projections and competitive dynamics are detailed for each segment, with the overall market size estimated to reach XX Million by 2033.
Key Drivers of Instore Analytics Industry Growth
The instore analytics industry is propelled by several critical growth drivers. Technologically, the rapid evolution of AI, machine learning, and IoT devices enables more sophisticated data capture and analysis, unlocking deeper customer insights. Economically, the intense competition within the retail sector mandates that businesses leverage data to optimize operations, enhance customer experience, and drive sales growth. Regulatory factors, while sometimes posing challenges, also drive adoption as companies seek to comply with data privacy laws and improve security. For instance, the need to understand customer traffic patterns for staffing optimization and the implementation of contactless payment systems are direct drivers. The estimated market size for instore analytics is projected to reach XX Million by 2033.
Challenges in the Instore Analytics Industry Sector
Despite its significant growth, the instore analytics sector faces several challenges. Regulatory hurdles, particularly concerning data privacy and consent management, can complicate data collection and analysis, impacting market penetration. Supply chain issues, though less direct for software-centric solutions, can affect the availability and cost of hardware components for IoT deployments. Competitive pressures are intense, with a crowded market leading to pricing challenges and the need for continuous innovation. Furthermore, the initial investment in technology and the need for skilled personnel to interpret and act on analytics can be a barrier, particularly for smaller businesses. The quantifiable impact of these challenges can lead to slower adoption rates in certain regions or segments, potentially affecting the market growth trajectory. The estimated market size for instore analytics is projected to reach XX Million by 2033.
Emerging Opportunities in Instore Analytics Industry
Emerging opportunities in the instore analytics industry are abundant and diverse. The growing demand for hyper-personalization in retail presents a significant opportunity for analytics platforms to deliver tailored customer experiences. The expansion of omnichannel retail strategies necessitates integrated instore and online analytics to provide a seamless customer journey. Advancements in edge computing offer the potential for real-time data processing directly at the store level, enabling faster decision-making. Furthermore, the increasing adoption of smart store technologies, such as interactive displays and augmented reality experiences, will generate new data streams that instore analytics can leverage. The focus on sustainability and operational efficiency is also opening doors for analytics solutions that optimize energy consumption and reduce waste. The estimated market size for instore analytics is projected to reach XX Million by 2033.
Leading Players in the Instore Analytics Industry Market
- Hoxton Analytics Limited
- Amoobi Inc
- SAP SE
- Capgemini SE
- Happiest Minds Technologies
- Cloud4Wi Inc
- Motionloft Inc
- Capillary Technologies
- Thinkinside SRL
- RetailNext Inc
- Trax Image Recognition
Key Developments in Instore Analytics Industry Industry
- December 2022: JRNI, a leading customer engagement platform, partnered with Mad Mobiles, a Retail associate platform for managing online and in-store customer shopping experiences. This integration would provide clients with a complete solution to replicate an in-person, in-store shopping experience from anywhere.
- November 2022: A California-based retail firm acquired the UK-based firm The Retail Performance Company from Ipsos to boost its foot traffic and In-store analytics in Europe and Asia. Under this partnership, the company adds 40 new employees to its stores, expands its operations into Philippines, and grows further in the UK market.
Future Outlook for Instore Analytics Industry Market
The future outlook for the instore analytics industry is exceptionally strong, poised for continued robust growth driven by technological advancements and the evolving demands of the retail landscape. The increasing integration of AI and machine learning will unlock even more sophisticated predictive capabilities, enabling retailers to proactively manage inventory, personalize customer interactions, and optimize store operations with unprecedented precision. The expansion of omnichannel strategies will further necessitate unified analytics platforms that bridge the gap between physical and digital retail environments. Investments in smart store technologies and the growing emphasis on data-driven decision-making across all retail verticals will accelerate adoption. Strategic opportunities lie in developing specialized analytics solutions for niche retail segments and in fostering partnerships that expand market reach and technological integration. The market size for instore analytics is projected to reach XX Million by 2033.
Instore Analytics Industry Segmentation
-
1. Component
- 1.1. Software
- 1.2. Services
-
2. Deployment
- 2.1. Cloud
- 2.2. On-Premises
-
3. Organization Size
- 3.1. Large Enterprises
- 3.2. Small & Medium Enterprises
-
4. Application
- 4.1. Customer Management
- 4.2. Risk and Compliance Management
- 4.3. Store Operations Management
- 4.4. Merchandise Management
- 4.5. Other Applications
Instore Analytics Industry Segmentation By Geography
- 1. North America
- 2. Europe
- 3. Asia Pacific
- 4. Latin America
- 5. Middle East and Africa
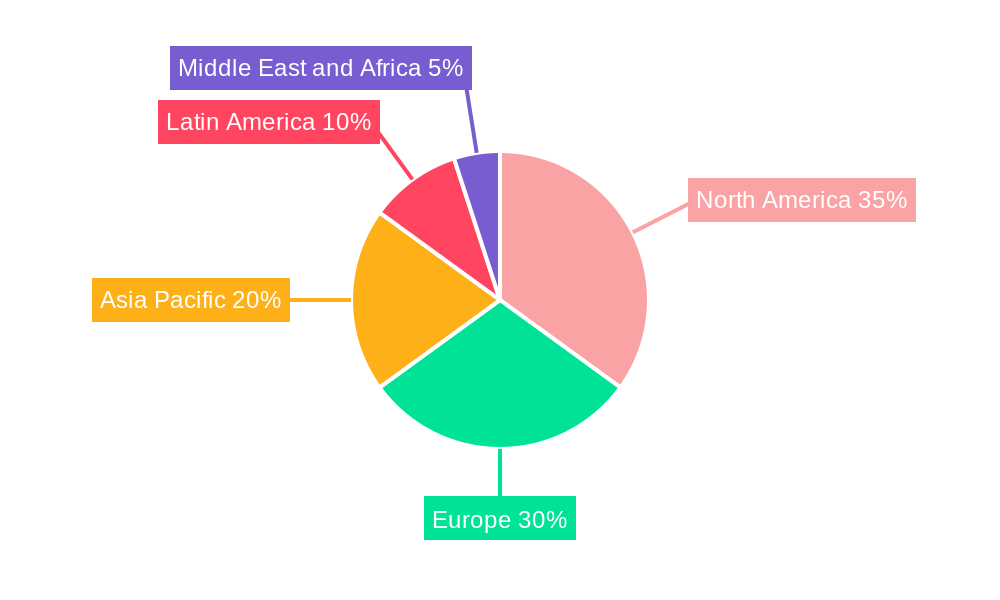
Instore Analytics Industry Regional Market Share
Geographic Coverage of Instore Analytics Industry
Instore Analytics Industry REPORT HIGHLIGHTS
| Aspects | Details |
|---|---|
| Study Period | 2020-2034 |
| Base Year | 2025 |
| Estimated Year | 2026 |
| Forecast Period | 2026-2034 |
| Historical Period | 2020-2025 |
| Growth Rate | CAGR of 24.23% from 2020-2034 |
| Segmentation |
|
Table of Contents
- 1. Introduction
- 1.1. Research Scope
- 1.2. Market Segmentation
- 1.3. Research Objective
- 1.4. Definitions and Assumptions
- 2. Executive Summary
- 2.1. Market Snapshot
- 3. Market Dynamics
- 3.1. Market Drivers
- 3.2. Market Restrains
- 3.3. Market Trends
- 3.4. Market Opportunities
- 4. Market Factor Analysis
- 4.1. Porters Five Forces
- 4.1.1. Bargaining Power of Suppliers
- 4.1.2. Bargaining Power of Buyers
- 4.1.3. Threat of New Entrants
- 4.1.4. Threat of Substitutes
- 4.1.5. Competitive Rivalry
- 4.2. PESTEL analysis
- 4.3. BCG Analysis
- 4.3.1. Stars (High Growth, High Market Share)
- 4.3.2. Cash Cows (Low Growth, High Market Share)
- 4.3.3. Question Mark (High Growth, Low Market Share)
- 4.3.4. Dogs (Low Growth, Low Market Share)
- 4.4. Ansoff Matrix Analysis
- 4.5. Supply Chain Analysis
- 4.6. Regulatory Landscape
- 4.7. Current Market Potential and Opportunity Assessment (TAM–SAM–SOM Framework)
- 4.8. PRI Analyst Note
- 4.1. Porters Five Forces
- 5. Market Analysis, Insights and Forecast 2021-2033
- 5.1. Market Analysis, Insights and Forecast - by Component
- 5.1.1. Software
- 5.1.2. Services
- 5.2. Market Analysis, Insights and Forecast - by Deployment
- 5.2.1. Cloud
- 5.2.2. On-Premises
- 5.3. Market Analysis, Insights and Forecast - by Organization Size
- 5.3.1. Large Enterprises
- 5.3.2. Small & Medium Enterprises
- 5.4. Market Analysis, Insights and Forecast - by Application
- 5.4.1. Customer Management
- 5.4.2. Risk and Compliance Management
- 5.4.3. Store Operations Management
- 5.4.4. Merchandise Management
- 5.4.5. Other Applications
- 5.5. Market Analysis, Insights and Forecast - by Region
- 5.5.1. North America
- 5.5.2. Europe
- 5.5.3. Asia Pacific
- 5.5.4. Latin America
- 5.5.5. Middle East and Africa
- 5.1. Market Analysis, Insights and Forecast - by Component
- 6. Global Instore Analytics Industry Analysis, Insights and Forecast, 2021-2033
- 6.1. Market Analysis, Insights and Forecast - by Component
- 6.1.1. Software
- 6.1.2. Services
- 6.2. Market Analysis, Insights and Forecast - by Deployment
- 6.2.1. Cloud
- 6.2.2. On-Premises
- 6.3. Market Analysis, Insights and Forecast - by Organization Size
- 6.3.1. Large Enterprises
- 6.3.2. Small & Medium Enterprises
- 6.4. Market Analysis, Insights and Forecast - by Application
- 6.4.1. Customer Management
- 6.4.2. Risk and Compliance Management
- 6.4.3. Store Operations Management
- 6.4.4. Merchandise Management
- 6.4.5. Other Applications
- 6.1. Market Analysis, Insights and Forecast - by Component
- 7. North America Instore Analytics Industry Analysis, Insights and Forecast, 2020-2032
- 7.1. Market Analysis, Insights and Forecast - by Component
- 7.1.1. Software
- 7.1.2. Services
- 7.2. Market Analysis, Insights and Forecast - by Deployment
- 7.2.1. Cloud
- 7.2.2. On-Premises
- 7.3. Market Analysis, Insights and Forecast - by Organization Size
- 7.3.1. Large Enterprises
- 7.3.2. Small & Medium Enterprises
- 7.4. Market Analysis, Insights and Forecast - by Application
- 7.4.1. Customer Management
- 7.4.2. Risk and Compliance Management
- 7.4.3. Store Operations Management
- 7.4.4. Merchandise Management
- 7.4.5. Other Applications
- 7.1. Market Analysis, Insights and Forecast - by Component
- 8. Europe Instore Analytics Industry Analysis, Insights and Forecast, 2020-2032
- 8.1. Market Analysis, Insights and Forecast - by Component
- 8.1.1. Software
- 8.1.2. Services
- 8.2. Market Analysis, Insights and Forecast - by Deployment
- 8.2.1. Cloud
- 8.2.2. On-Premises
- 8.3. Market Analysis, Insights and Forecast - by Organization Size
- 8.3.1. Large Enterprises
- 8.3.2. Small & Medium Enterprises
- 8.4. Market Analysis, Insights and Forecast - by Application
- 8.4.1. Customer Management
- 8.4.2. Risk and Compliance Management
- 8.4.3. Store Operations Management
- 8.4.4. Merchandise Management
- 8.4.5. Other Applications
- 8.1. Market Analysis, Insights and Forecast - by Component
- 9. Asia Pacific Instore Analytics Industry Analysis, Insights and Forecast, 2020-2032
- 9.1. Market Analysis, Insights and Forecast - by Component
- 9.1.1. Software
- 9.1.2. Services
- 9.2. Market Analysis, Insights and Forecast - by Deployment
- 9.2.1. Cloud
- 9.2.2. On-Premises
- 9.3. Market Analysis, Insights and Forecast - by Organization Size
- 9.3.1. Large Enterprises
- 9.3.2. Small & Medium Enterprises
- 9.4. Market Analysis, Insights and Forecast - by Application
- 9.4.1. Customer Management
- 9.4.2. Risk and Compliance Management
- 9.4.3. Store Operations Management
- 9.4.4. Merchandise Management
- 9.4.5. Other Applications
- 9.1. Market Analysis, Insights and Forecast - by Component
- 10. Latin America Instore Analytics Industry Analysis, Insights and Forecast, 2020-2032
- 10.1. Market Analysis, Insights and Forecast - by Component
- 10.1.1. Software
- 10.1.2. Services
- 10.2. Market Analysis, Insights and Forecast - by Deployment
- 10.2.1. Cloud
- 10.2.2. On-Premises
- 10.3. Market Analysis, Insights and Forecast - by Organization Size
- 10.3.1. Large Enterprises
- 10.3.2. Small & Medium Enterprises
- 10.4. Market Analysis, Insights and Forecast - by Application
- 10.4.1. Customer Management
- 10.4.2. Risk and Compliance Management
- 10.4.3. Store Operations Management
- 10.4.4. Merchandise Management
- 10.4.5. Other Applications
- 10.1. Market Analysis, Insights and Forecast - by Component
- 11. Middle East and Africa Instore Analytics Industry Analysis, Insights and Forecast, 2020-2032
- 11.1. Market Analysis, Insights and Forecast - by Component
- 11.1.1. Software
- 11.1.2. Services
- 11.2. Market Analysis, Insights and Forecast - by Deployment
- 11.2.1. Cloud
- 11.2.2. On-Premises
- 11.3. Market Analysis, Insights and Forecast - by Organization Size
- 11.3.1. Large Enterprises
- 11.3.2. Small & Medium Enterprises
- 11.4. Market Analysis, Insights and Forecast - by Application
- 11.4.1. Customer Management
- 11.4.2. Risk and Compliance Management
- 11.4.3. Store Operations Management
- 11.4.4. Merchandise Management
- 11.4.5. Other Applications
- 11.1. Market Analysis, Insights and Forecast - by Component
- 12. Competitive Analysis
- 12.1. Company Profiles
- 12.1.1 Hoxton Analytics Limited
- 12.1.1.1. Company Overview
- 12.1.1.2. Products
- 12.1.1.3. Company Financials
- 12.1.1.4. SWOT Analysis
- 12.1.2 Amoobi Inc
- 12.1.2.1. Company Overview
- 12.1.2.2. Products
- 12.1.2.3. Company Financials
- 12.1.2.4. SWOT Analysis
- 12.1.3 SAP SE
- 12.1.3.1. Company Overview
- 12.1.3.2. Products
- 12.1.3.3. Company Financials
- 12.1.3.4. SWOT Analysis
- 12.1.4 Capgemini SE
- 12.1.4.1. Company Overview
- 12.1.4.2. Products
- 12.1.4.3. Company Financials
- 12.1.4.4. SWOT Analysis
- 12.1.5 Happiest Minds Technologies
- 12.1.5.1. Company Overview
- 12.1.5.2. Products
- 12.1.5.3. Company Financials
- 12.1.5.4. SWOT Analysis
- 12.1.6 Cloud4Wi Inc
- 12.1.6.1. Company Overview
- 12.1.6.2. Products
- 12.1.6.3. Company Financials
- 12.1.6.4. SWOT Analysis
- 12.1.7 Motionloft Inc
- 12.1.7.1. Company Overview
- 12.1.7.2. Products
- 12.1.7.3. Company Financials
- 12.1.7.4. SWOT Analysis
- 12.1.8 Capillary Technologies
- 12.1.8.1. Company Overview
- 12.1.8.2. Products
- 12.1.8.3. Company Financials
- 12.1.8.4. SWOT Analysis
- 12.1.9 Thinkinside SRL
- 12.1.9.1. Company Overview
- 12.1.9.2. Products
- 12.1.9.3. Company Financials
- 12.1.9.4. SWOT Analysis
- 12.1.10 RetailNext Inc
- 12.1.10.1. Company Overview
- 12.1.10.2. Products
- 12.1.10.3. Company Financials
- 12.1.10.4. SWOT Analysis
- 12.1.11 Trax Image Recognition
- 12.1.11.1. Company Overview
- 12.1.11.2. Products
- 12.1.11.3. Company Financials
- 12.1.11.4. SWOT Analysis
- 12.1.1 Hoxton Analytics Limited
- 12.2. Market Entropy
- 12.2.1 Company's Key Areas Served
- 12.2.2 Recent Developments
- 12.3. Company Market Share Analysis 2025
- 12.3.1 Top 5 Companies Market Share Analysis
- 12.3.2 Top 3 Companies Market Share Analysis
- 12.4. List of Potential Customers
- 13. Research Methodology
List of Figures
- Figure 1: Global Instore Analytics Industry Revenue Breakdown (Million, %) by Region 2025 & 2033
- Figure 2: North America Instore Analytics Industry Revenue (Million), by Component 2025 & 2033
- Figure 3: North America Instore Analytics Industry Revenue Share (%), by Component 2025 & 2033
- Figure 4: North America Instore Analytics Industry Revenue (Million), by Deployment 2025 & 2033
- Figure 5: North America Instore Analytics Industry Revenue Share (%), by Deployment 2025 & 2033
- Figure 6: North America Instore Analytics Industry Revenue (Million), by Organization Size 2025 & 2033
- Figure 7: North America Instore Analytics Industry Revenue Share (%), by Organization Size 2025 & 2033
- Figure 8: North America Instore Analytics Industry Revenue (Million), by Application 2025 & 2033
- Figure 9: North America Instore Analytics Industry Revenue Share (%), by Application 2025 & 2033
- Figure 10: North America Instore Analytics Industry Revenue (Million), by Country 2025 & 2033
- Figure 11: North America Instore Analytics Industry Revenue Share (%), by Country 2025 & 2033
- Figure 12: Europe Instore Analytics Industry Revenue (Million), by Component 2025 & 2033
- Figure 13: Europe Instore Analytics Industry Revenue Share (%), by Component 2025 & 2033
- Figure 14: Europe Instore Analytics Industry Revenue (Million), by Deployment 2025 & 2033
- Figure 15: Europe Instore Analytics Industry Revenue Share (%), by Deployment 2025 & 2033
- Figure 16: Europe Instore Analytics Industry Revenue (Million), by Organization Size 2025 & 2033
- Figure 17: Europe Instore Analytics Industry Revenue Share (%), by Organization Size 2025 & 2033
- Figure 18: Europe Instore Analytics Industry Revenue (Million), by Application 2025 & 2033
- Figure 19: Europe Instore Analytics Industry Revenue Share (%), by Application 2025 & 2033
- Figure 20: Europe Instore Analytics Industry Revenue (Million), by Country 2025 & 2033
- Figure 21: Europe Instore Analytics Industry Revenue Share (%), by Country 2025 & 2033
- Figure 22: Asia Pacific Instore Analytics Industry Revenue (Million), by Component 2025 & 2033
- Figure 23: Asia Pacific Instore Analytics Industry Revenue Share (%), by Component 2025 & 2033
- Figure 24: Asia Pacific Instore Analytics Industry Revenue (Million), by Deployment 2025 & 2033
- Figure 25: Asia Pacific Instore Analytics Industry Revenue Share (%), by Deployment 2025 & 2033
- Figure 26: Asia Pacific Instore Analytics Industry Revenue (Million), by Organization Size 2025 & 2033
- Figure 27: Asia Pacific Instore Analytics Industry Revenue Share (%), by Organization Size 2025 & 2033
- Figure 28: Asia Pacific Instore Analytics Industry Revenue (Million), by Application 2025 & 2033
- Figure 29: Asia Pacific Instore Analytics Industry Revenue Share (%), by Application 2025 & 2033
- Figure 30: Asia Pacific Instore Analytics Industry Revenue (Million), by Country 2025 & 2033
- Figure 31: Asia Pacific Instore Analytics Industry Revenue Share (%), by Country 2025 & 2033
- Figure 32: Latin America Instore Analytics Industry Revenue (Million), by Component 2025 & 2033
- Figure 33: Latin America Instore Analytics Industry Revenue Share (%), by Component 2025 & 2033
- Figure 34: Latin America Instore Analytics Industry Revenue (Million), by Deployment 2025 & 2033
- Figure 35: Latin America Instore Analytics Industry Revenue Share (%), by Deployment 2025 & 2033
- Figure 36: Latin America Instore Analytics Industry Revenue (Million), by Organization Size 2025 & 2033
- Figure 37: Latin America Instore Analytics Industry Revenue Share (%), by Organization Size 2025 & 2033
- Figure 38: Latin America Instore Analytics Industry Revenue (Million), by Application 2025 & 2033
- Figure 39: Latin America Instore Analytics Industry Revenue Share (%), by Application 2025 & 2033
- Figure 40: Latin America Instore Analytics Industry Revenue (Million), by Country 2025 & 2033
- Figure 41: Latin America Instore Analytics Industry Revenue Share (%), by Country 2025 & 2033
- Figure 42: Middle East and Africa Instore Analytics Industry Revenue (Million), by Component 2025 & 2033
- Figure 43: Middle East and Africa Instore Analytics Industry Revenue Share (%), by Component 2025 & 2033
- Figure 44: Middle East and Africa Instore Analytics Industry Revenue (Million), by Deployment 2025 & 2033
- Figure 45: Middle East and Africa Instore Analytics Industry Revenue Share (%), by Deployment 2025 & 2033
- Figure 46: Middle East and Africa Instore Analytics Industry Revenue (Million), by Organization Size 2025 & 2033
- Figure 47: Middle East and Africa Instore Analytics Industry Revenue Share (%), by Organization Size 2025 & 2033
- Figure 48: Middle East and Africa Instore Analytics Industry Revenue (Million), by Application 2025 & 2033
- Figure 49: Middle East and Africa Instore Analytics Industry Revenue Share (%), by Application 2025 & 2033
- Figure 50: Middle East and Africa Instore Analytics Industry Revenue (Million), by Country 2025 & 2033
- Figure 51: Middle East and Africa Instore Analytics Industry Revenue Share (%), by Country 2025 & 2033
List of Tables
- Table 1: Global Instore Analytics Industry Revenue Million Forecast, by Component 2020 & 2033
- Table 2: Global Instore Analytics Industry Revenue Million Forecast, by Deployment 2020 & 2033
- Table 3: Global Instore Analytics Industry Revenue Million Forecast, by Organization Size 2020 & 2033
- Table 4: Global Instore Analytics Industry Revenue Million Forecast, by Application 2020 & 2033
- Table 5: Global Instore Analytics Industry Revenue Million Forecast, by Region 2020 & 2033
- Table 6: Global Instore Analytics Industry Revenue Million Forecast, by Component 2020 & 2033
- Table 7: Global Instore Analytics Industry Revenue Million Forecast, by Deployment 2020 & 2033
- Table 8: Global Instore Analytics Industry Revenue Million Forecast, by Organization Size 2020 & 2033
- Table 9: Global Instore Analytics Industry Revenue Million Forecast, by Application 2020 & 2033
- Table 10: Global Instore Analytics Industry Revenue Million Forecast, by Country 2020 & 2033
- Table 11: Global Instore Analytics Industry Revenue Million Forecast, by Component 2020 & 2033
- Table 12: Global Instore Analytics Industry Revenue Million Forecast, by Deployment 2020 & 2033
- Table 13: Global Instore Analytics Industry Revenue Million Forecast, by Organization Size 2020 & 2033
- Table 14: Global Instore Analytics Industry Revenue Million Forecast, by Application 2020 & 2033
- Table 15: Global Instore Analytics Industry Revenue Million Forecast, by Country 2020 & 2033
- Table 16: Global Instore Analytics Industry Revenue Million Forecast, by Component 2020 & 2033
- Table 17: Global Instore Analytics Industry Revenue Million Forecast, by Deployment 2020 & 2033
- Table 18: Global Instore Analytics Industry Revenue Million Forecast, by Organization Size 2020 & 2033
- Table 19: Global Instore Analytics Industry Revenue Million Forecast, by Application 2020 & 2033
- Table 20: Global Instore Analytics Industry Revenue Million Forecast, by Country 2020 & 2033
- Table 21: Global Instore Analytics Industry Revenue Million Forecast, by Component 2020 & 2033
- Table 22: Global Instore Analytics Industry Revenue Million Forecast, by Deployment 2020 & 2033
- Table 23: Global Instore Analytics Industry Revenue Million Forecast, by Organization Size 2020 & 2033
- Table 24: Global Instore Analytics Industry Revenue Million Forecast, by Application 2020 & 2033
- Table 25: Global Instore Analytics Industry Revenue Million Forecast, by Country 2020 & 2033
- Table 26: Global Instore Analytics Industry Revenue Million Forecast, by Component 2020 & 2033
- Table 27: Global Instore Analytics Industry Revenue Million Forecast, by Deployment 2020 & 2033
- Table 28: Global Instore Analytics Industry Revenue Million Forecast, by Organization Size 2020 & 2033
- Table 29: Global Instore Analytics Industry Revenue Million Forecast, by Application 2020 & 2033
- Table 30: Global Instore Analytics Industry Revenue Million Forecast, by Country 2020 & 2033
Frequently Asked Questions
1. What is the projected Compound Annual Growth Rate (CAGR) of the Instore Analytics Industry?
The projected CAGR is approximately 24.23%.
2. Which companies are prominent players in the Instore Analytics Industry?
Key companies in the market include Hoxton Analytics Limited, Amoobi Inc, SAP SE, Capgemini SE, Happiest Minds Technologies, Cloud4Wi Inc, Motionloft Inc, Capillary Technologies, Thinkinside SRL, RetailNext Inc, Trax Image Recognition.
3. What are the main segments of the Instore Analytics Industry?
The market segments include Component, Deployment, Organization Size, Application.
4. Can you provide details about the market size?
The market size is estimated to be USD 4.26 Million as of 2022.
5. What are some drivers contributing to market growth?
Increasing advantage of the Cloud; Need for Better Customer Service and Enhanced Shopping Experience; Customer Management Segment to Witness Significant Market Growth.
6. What are the notable trends driving market growth?
Customer Management Segment to Witness Significant Market Growth.
7. Are there any restraints impacting market growth?
Lack of Personnel Skills.
8. Can you provide examples of recent developments in the market?
December 2022 - JRNI, a leading customer engagement platform, partnered with Mad Mobiles, a Retail associate platform for managing online and in-store customer shopping experiences. This integration would provide clients with a complete solution to replicate an in-person, in-store shopping experience from anywhere.
9. What pricing options are available for accessing the report?
Pricing options include single-user, multi-user, and enterprise licenses priced at USD 4750, USD 5250, and USD 8750 respectively.
10. Is the market size provided in terms of value or volume?
The market size is provided in terms of value, measured in Million.
11. Are there any specific market keywords associated with the report?
Yes, the market keyword associated with the report is "Instore Analytics Industry," which aids in identifying and referencing the specific market segment covered.
12. How do I determine which pricing option suits my needs best?
The pricing options vary based on user requirements and access needs. Individual users may opt for single-user licenses, while businesses requiring broader access may choose multi-user or enterprise licenses for cost-effective access to the report.
13. Are there any additional resources or data provided in the Instore Analytics Industry report?
While the report offers comprehensive insights, it's advisable to review the specific contents or supplementary materials provided to ascertain if additional resources or data are available.
14. How can I stay updated on further developments or reports in the Instore Analytics Industry?
To stay informed about further developments, trends, and reports in the Instore Analytics Industry, consider subscribing to industry newsletters, following relevant companies and organizations, or regularly checking reputable industry news sources and publications.
Methodology
Step 1 - Identification of Relevant Samples Size from Population Database


Step 2 - Approaches for Defining Global Market Size (Value, Volume* & Price*)

Note*: In applicable scenarios
Step 3 - Data Sources
Primary Research
- Web Analytics
- Survey Reports
- Research Institute
- Latest Research Reports
- Opinion Leaders
Secondary Research
- Annual Reports
- White Paper
- Latest Press Release
- Industry Association
- Paid Database
- Investor Presentations

Step 4 - Data Triangulation
Involves using different sources of information in order to increase the validity of a study
These sources are likely to be stakeholders in a program - participants, other researchers, program staff, other community members, and so on.
Then we put all data in single framework & apply various statistical tools to find out the dynamic on the market.
During the analysis stage, feedback from the stakeholder groups would be compared to determine areas of agreement as well as areas of divergence