

Key Insights
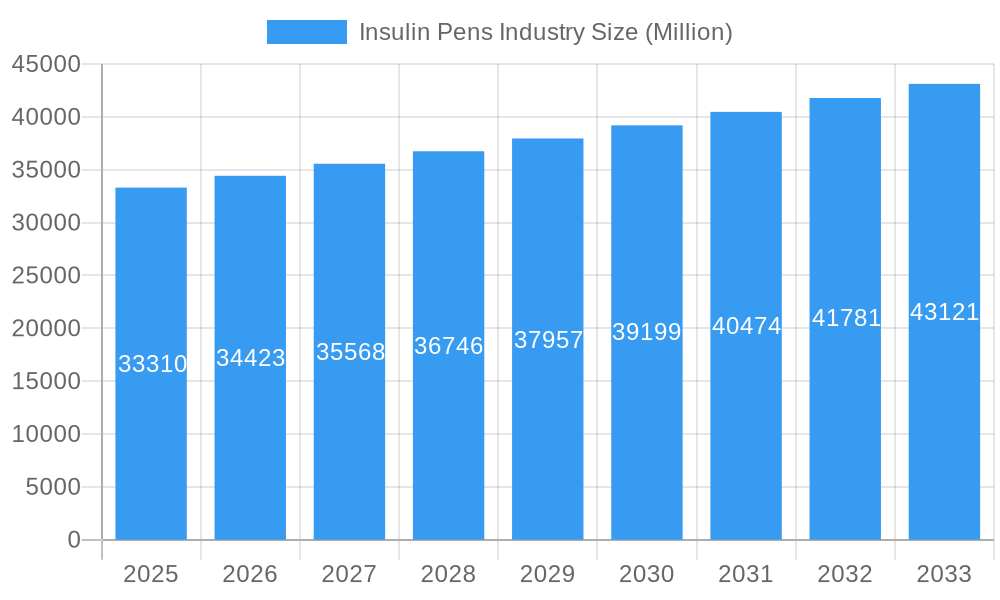
The global insulin pens market, valued at $33.31 billion in 2025, is projected to experience steady growth, driven by the rising prevalence of diabetes worldwide and an increasing preference for convenient and accurate insulin delivery systems. The market's compound annual growth rate (CAGR) of 3.40% from 2025 to 2033 indicates a substantial expansion over the forecast period. Key drivers include the growing diabetic population, particularly in developing economies with rising incidences of type 2 diabetes, and technological advancements leading to the development of more sophisticated and user-friendly insulin pens. The increasing awareness of diabetes management and the rising adoption of self-monitoring blood glucose (SMBG) devices contribute to market growth. The market is segmented by product type, with reusable (cartridge) and disposable pens dominating the landscape. Reusable pens offer cost-effectiveness in the long run, while disposable pens provide ease of use and hygiene. Major market players like Eli Lilly, Sanofi, Novo Nordisk, and others are continuously innovating to improve insulin delivery mechanisms and expand their market share through strategic partnerships and product launches.
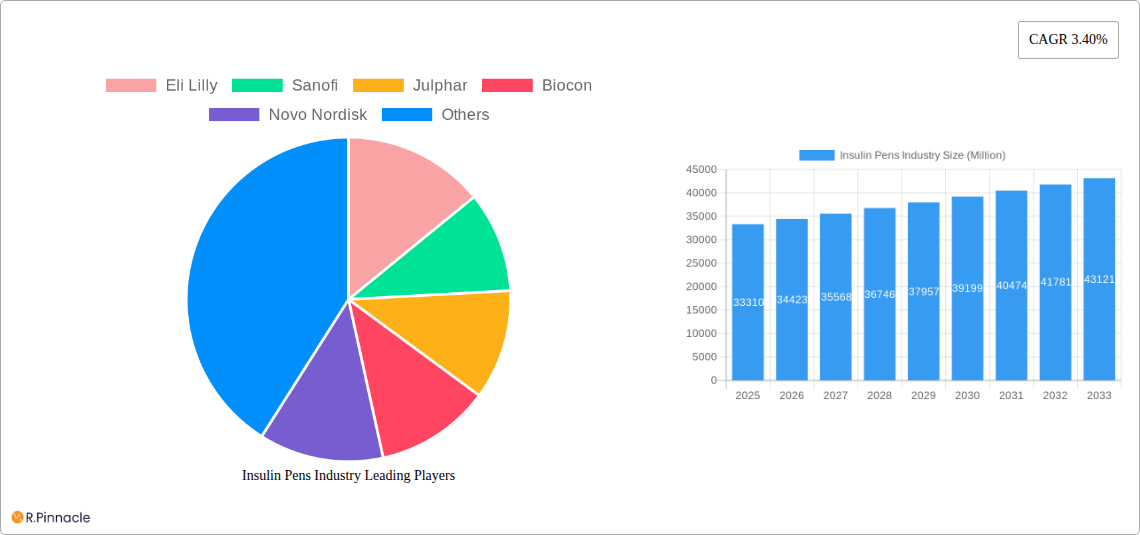
Insulin Pens Industry Market Size (In Billion)
While the market shows strong growth potential, some restraints include the high cost of insulin pens, particularly in low- and middle-income countries, and potential side effects associated with insulin therapy, impacting patient compliance and market penetration. However, ongoing research and development focused on improving the efficacy and affordability of insulin, along with government initiatives to increase access to diabetes care, are expected to mitigate these challenges. Regional variations are expected, with North America and Europe maintaining a significant market share due to high diabetes prevalence and better healthcare infrastructure. The Asia-Pacific region is anticipated to witness significant growth driven by the increasing diabetic population and improving healthcare access. The competitive landscape is characterized by a mix of established pharmaceutical companies and emerging players constantly introducing new products and technologies. The future growth of the insulin pens market is heavily reliant on effective diabetes management strategies and accessibility to quality healthcare services across all regions.
Insulin Pens Industry Company Market Share
Insulin Pens Industry: A Comprehensive Market Report (2019-2033)
This comprehensive report provides an in-depth analysis of the global insulin pens industry, covering market size, growth drivers, competitive landscape, and future outlook. The study period spans from 2019 to 2033, with 2025 serving as both the base and estimated year. The report offers actionable insights for industry professionals, investors, and stakeholders seeking to navigate this dynamic market.
Insulin Pens Industry Market Structure & Innovation Trends
The insulin pens market exhibits a moderately concentrated structure, dominated by a handful of multinational pharmaceutical companies. Key players like Novo Nordisk, Sanofi, Eli Lilly, Biocon, and Julphar hold significant market share, with their combined presence accounting for approximately xx% of the global market in 2024. Market share fluctuations are influenced by factors such as product innovation, regulatory approvals, and pricing strategies. Mergers and acquisitions (M&A) have played a notable role in shaping the industry landscape. For instance, recent M&A deals, while not publicly disclosed in terms of exact values, indicate a strong trend towards consolidation and expansion into newer technologies. Innovation is driven by the need for improved insulin delivery systems, enhanced patient compliance, and the integration of digital health technologies. Stringent regulatory frameworks governing the approval and marketing of insulin pens necessitate substantial investments in research and development. Product substitutes, such as insulin pumps and injectable insulin vials, pose competitive challenges, while the growing prevalence of diabetes fuels market expansion. The end-user demographic is primarily comprised of individuals with type 1 and type 2 diabetes, spanning various age groups and geographic regions.
Insulin Pens Industry Market Dynamics & Trends
The global insulin pens market is experiencing robust growth, driven by several key factors. The rising prevalence of diabetes worldwide, particularly type 2 diabetes, significantly contributes to the increasing demand for insulin delivery systems. Technological advancements, such as the development of smart insulin pens and personalized diabetes management platforms, are enhancing patient convenience and therapeutic outcomes. Consumer preferences are increasingly shifting towards user-friendly, disposable pens, mirroring the convenience factor of other pharmaceutical products. This preference drives the demand for advanced disposable pens over reusable ones. Competitive dynamics are marked by innovation, strategic partnerships, and geographic expansion efforts by leading players. The market is expected to witness a Compound Annual Growth Rate (CAGR) of xx% during the forecast period (2025-2033). Market penetration is particularly strong in developed nations, but growth opportunities exist in emerging markets with expanding healthcare infrastructure and increasing awareness of diabetes management.
Dominant Regions & Segments in Insulin Pens Industry
North America currently holds the leading position in the insulin pens market, driven by factors such as high diabetes prevalence, advanced healthcare infrastructure, and high disposable incomes. Europe follows closely behind, exhibiting robust growth. Within the product segments, disposable pens demonstrate higher market share than reusable pens (cartridges), owing to improved user convenience.
Key Drivers in North America:
- High prevalence of diabetes
- Advanced healthcare infrastructure
- High adoption of advanced technologies
- Favorable reimbursement policies
Key Drivers in Europe:
- Rising diabetes prevalence
- Well-established healthcare systems
- Growing awareness of diabetes management
Key Drivers for Disposable Pens:
- Enhanced convenience
- Reduced risk of contamination
- Single-use nature minimizes maintenance
The detailed dominance analysis reveals that North America's strong position is attributed to a combination of high diabetes prevalence, substantial investments in healthcare, and high disposable incomes among consumers. The robust regulatory framework in the region further contributes to the market's sustained growth, ensuring the safe and effective use of insulin pens.
Insulin Pens Industry Product Innovations
Recent innovations in the insulin pens market focus on improving user experience, accuracy, and data integration. Smart insulin pen caps, such as the one developed by Bigfoot Biomedical, offer improved dosing guidance based on blood glucose levels. Eli Lilly's Tempo Personalized Diabetes Management Platform integrates a smart button, app, and a prefilled insulin pen for personalized diabetes management. These innovations enhance patient adherence, reduce the risk of hypoglycemic events, and improve overall diabetes management. The market is witnessing a significant shift towards connected devices, integrating insulin pens with mobile applications to monitor insulin usage and provide personalized feedback.
Report Scope & Segmentation Analysis
This report segments the insulin pens market by product type:
Reusable Pens (Cartridge): This segment is characterized by slower growth compared to disposable pens. Reusable pens offer cost-effectiveness but demand regular maintenance and cleaning. This segment is expected to reach a market size of $xx Million by 2033 with a CAGR of xx%. Competition is moderate.
Disposable Pens: This segment displays higher growth potential due to increased convenience and reduced risk of infection. The market size for disposable pens is projected to reach $xx Million by 2033, exhibiting a CAGR of xx%. Competition in this segment is more intense due to its larger market size and higher growth rate.
Key Drivers of Insulin Pens Industry Growth
Several key factors are driving the growth of the insulin pens industry:
- The rising prevalence of diabetes globally, fueled by sedentary lifestyles and unhealthy diets, significantly boosts demand.
- Technological advancements resulting in innovative, user-friendly insulin pens improve patient compliance and therapy outcomes.
- Favorable regulatory environments and supportive healthcare policies are accelerating market expansion in key regions.
- Increased healthcare expenditure, particularly in developed nations, allows greater access to advanced insulin delivery systems.
Challenges in the Insulin Pens Industry Sector
The insulin pens industry faces several challenges:
- Stringent regulatory processes for approval and market entry introduce significant time and cost barriers.
- Supply chain disruptions and raw material shortages can impact product availability and pricing.
- Intense competition amongst established players and emerging companies adds pressure on pricing and margins. The impact of these challenges can result in an estimated xx% reduction in overall market growth, negatively affecting profit margins and potentially decreasing the availability of innovative products.
Emerging Opportunities in Insulin Pens Industry
The insulin pens market presents several emerging opportunities:
- Expansion into untapped markets in developing countries with rapidly increasing diabetes prevalence provides substantial growth potential.
- The integration of artificial intelligence (AI) and machine learning (ML) in insulin delivery systems offers improved personalization and enhanced therapeutic outcomes.
- Development of biosimilar insulin pens could reduce treatment costs, making insulin therapy more accessible to a wider population.
Leading Players in the Insulin Pens Industry Market
- Eli Lilly
- Sanofi
- Julphar
- Biocon
- Novo Nordisk
Key Developments in Insulin Pens Industry
- November 2022: Eli Lilly announced the rollout of the Tempo Personalized Diabetes Management Platform, a significant advancement in personalized diabetes care.
- May 2021: Bigfoot Biomedical received FDA clearance for a smart insulin pen cap, enhancing dosing accuracy and patient convenience.
Future Outlook for Insulin Pens Industry Market
The insulin pens market is poised for sustained growth, driven by the global increase in diabetes prevalence, technological innovations, and expansion into emerging markets. Strategic partnerships, product diversification, and investment in research and development will be crucial for companies to maintain a competitive edge and capitalize on future growth opportunities. The market anticipates strong growth fueled by ongoing developments in smart technology and personalized medicine, potentially exceeding previous growth estimations by xx% by 2033.
Insulin Pens Industry Segmentation
-
1. Product
- 1.1. Reusable pens (Cartridge)
- 1.2. Disposable Pens
Insulin Pens Industry Segmentation By Geography
-
1. North America
- 1.1. United States
- 1.2. Canada
- 1.3. Rest of North America
-
2. Europe
- 2.1. Germany
- 2.2. United Kingdom
- 2.3. France
- 2.4. Russia
- 2.5. Spain
- 2.6. Italy
- 2.7. Rest of Europe
-
3. Asia Pacific
- 3.1. India
- 3.2. China
- 3.3. Japan
- 3.4. South Korea
- 3.5. Australia
- 3.6. Vietnam
- 3.7. Malaysia
- 3.8. Indonesia
- 3.9. Philippines
- 3.10. Thailand
- 3.11. Rest of the Asia Pacific
-
4. Latin America
- 4.1. Brazil
- 4.2. Mexico
- 4.3. Rest of Latin America
-
5. Middle East and Africa
- 5.1. Egypt
- 5.2. Saudi Arabia
- 5.3. Iran
- 5.4. South Africa
- 5.5. Oman
- 5.6. Rest of the Middle East and Africa
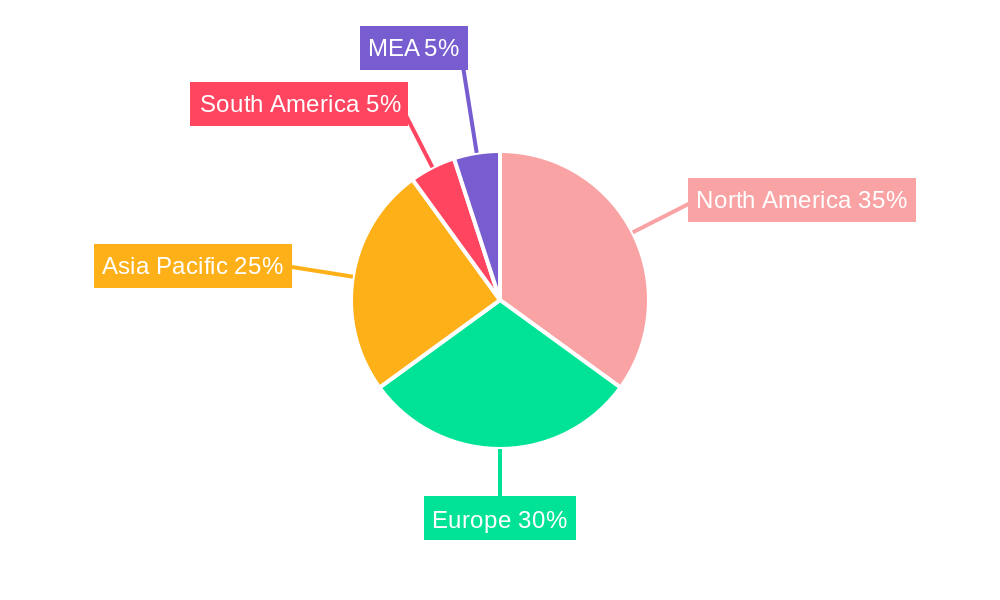
Insulin Pens Industry Regional Market Share
Geographic Coverage of Insulin Pens Industry
Insulin Pens Industry REPORT HIGHLIGHTS
| Aspects | Details |
|---|---|
| Study Period | 2020-2034 |
| Base Year | 2025 |
| Estimated Year | 2026 |
| Forecast Period | 2026-2034 |
| Historical Period | 2020-2025 |
| Growth Rate | CAGR of 3.40% from 2020-2034 |
| Segmentation |
|
Table of Contents
- 1. Introduction
- 1.1. Research Scope
- 1.2. Market Segmentation
- 1.3. Research Objective
- 1.4. Definitions and Assumptions
- 2. Executive Summary
- 2.1. Market Snapshot
- 3. Market Dynamics
- 3.1. Market Drivers
- 3.2. Market Restrains
- 3.3. Market Trends
- 3.4. Market Opportunities
- 4. Market Factor Analysis
- 4.1. Porters Five Forces
- 4.1.1. Bargaining Power of Suppliers
- 4.1.2. Bargaining Power of Buyers
- 4.1.3. Threat of New Entrants
- 4.1.4. Threat of Substitutes
- 4.1.5. Competitive Rivalry
- 4.2. PESTEL analysis
- 4.3. BCG Analysis
- 4.3.1. Stars (High Growth, High Market Share)
- 4.3.2. Cash Cows (Low Growth, High Market Share)
- 4.3.3. Question Mark (High Growth, Low Market Share)
- 4.3.4. Dogs (Low Growth, Low Market Share)
- 4.4. Ansoff Matrix Analysis
- 4.5. Supply Chain Analysis
- 4.6. Regulatory Landscape
- 4.7. Current Market Potential and Opportunity Assessment (TAM–SAM–SOM Framework)
- 4.8. PRI Analyst Note
- 4.1. Porters Five Forces
- 5. Market Analysis, Insights and Forecast 2021-2033
- 5.1. Market Analysis, Insights and Forecast - by Product
- 5.1.1. Reusable pens (Cartridge)
- 5.1.2. Disposable Pens
- 5.2. Market Analysis, Insights and Forecast - by Region
- 5.2.1. North America
- 5.2.2. Europe
- 5.2.3. Asia Pacific
- 5.2.4. Latin America
- 5.2.5. Middle East and Africa
- 5.1. Market Analysis, Insights and Forecast - by Product
- 6. Global Insulin Pens Industry Analysis, Insights and Forecast, 2021-2033
- 6.1. Market Analysis, Insights and Forecast - by Product
- 6.1.1. Reusable pens (Cartridge)
- 6.1.2. Disposable Pens
- 6.1. Market Analysis, Insights and Forecast - by Product
- 7. North America Insulin Pens Industry Analysis, Insights and Forecast, 2020-2032
- 7.1. Market Analysis, Insights and Forecast - by Product
- 7.1.1. Reusable pens (Cartridge)
- 7.1.2. Disposable Pens
- 7.1. Market Analysis, Insights and Forecast - by Product
- 8. Europe Insulin Pens Industry Analysis, Insights and Forecast, 2020-2032
- 8.1. Market Analysis, Insights and Forecast - by Product
- 8.1.1. Reusable pens (Cartridge)
- 8.1.2. Disposable Pens
- 8.1. Market Analysis, Insights and Forecast - by Product
- 9. Asia Pacific Insulin Pens Industry Analysis, Insights and Forecast, 2020-2032
- 9.1. Market Analysis, Insights and Forecast - by Product
- 9.1.1. Reusable pens (Cartridge)
- 9.1.2. Disposable Pens
- 9.1. Market Analysis, Insights and Forecast - by Product
- 10. Latin America Insulin Pens Industry Analysis, Insights and Forecast, 2020-2032
- 10.1. Market Analysis, Insights and Forecast - by Product
- 10.1.1. Reusable pens (Cartridge)
- 10.1.2. Disposable Pens
- 10.1. Market Analysis, Insights and Forecast - by Product
- 11. Middle East and Africa Insulin Pens Industry Analysis, Insights and Forecast, 2020-2032
- 11.1. Market Analysis, Insights and Forecast - by Product
- 11.1.1. Reusable pens (Cartridge)
- 11.1.2. Disposable Pens
- 11.1. Market Analysis, Insights and Forecast - by Product
- 12. Competitive Analysis
- 12.1. Company Profiles
- 12.1.1 Eli Lilly
- 12.1.1.1. Company Overview
- 12.1.1.2. Products
- 12.1.1.3. Company Financials
- 12.1.1.4. SWOT Analysis
- 12.1.2 Sanofi
- 12.1.2.1. Company Overview
- 12.1.2.2. Products
- 12.1.2.3. Company Financials
- 12.1.2.4. SWOT Analysis
- 12.1.3 Julphar
- 12.1.3.1. Company Overview
- 12.1.3.2. Products
- 12.1.3.3. Company Financials
- 12.1.3.4. SWOT Analysis
- 12.1.4 Biocon
- 12.1.4.1. Company Overview
- 12.1.4.2. Products
- 12.1.4.3. Company Financials
- 12.1.4.4. SWOT Analysis
- 12.1.5 Novo Nordisk
- 12.1.5.1. Company Overview
- 12.1.5.2. Products
- 12.1.5.3. Company Financials
- 12.1.5.4. SWOT Analysis
- 12.1.1 Eli Lilly
- 12.2. Market Entropy
- 12.2.1 Company's Key Areas Served
- 12.2.2 Recent Developments
- 12.3. Company Market Share Analysis 2025
- 12.3.1 Top 5 Companies Market Share Analysis
- 12.3.2 Top 3 Companies Market Share Analysis
- 12.4. List of Potential Customers
- 13. Research Methodology
List of Figures
- Figure 1: Global Insulin Pens Industry Revenue Breakdown (Million, %) by Region 2025 & 2033
- Figure 2: Global Insulin Pens Industry Volume Breakdown (K Unit, %) by Region 2025 & 2033
- Figure 3: North America Insulin Pens Industry Revenue (Million), by Product 2025 & 2033
- Figure 4: North America Insulin Pens Industry Volume (K Unit), by Product 2025 & 2033
- Figure 5: North America Insulin Pens Industry Revenue Share (%), by Product 2025 & 2033
- Figure 6: North America Insulin Pens Industry Volume Share (%), by Product 2025 & 2033
- Figure 7: North America Insulin Pens Industry Revenue (Million), by Country 2025 & 2033
- Figure 8: North America Insulin Pens Industry Volume (K Unit), by Country 2025 & 2033
- Figure 9: North America Insulin Pens Industry Revenue Share (%), by Country 2025 & 2033
- Figure 10: North America Insulin Pens Industry Volume Share (%), by Country 2025 & 2033
- Figure 11: Europe Insulin Pens Industry Revenue (Million), by Product 2025 & 2033
- Figure 12: Europe Insulin Pens Industry Volume (K Unit), by Product 2025 & 2033
- Figure 13: Europe Insulin Pens Industry Revenue Share (%), by Product 2025 & 2033
- Figure 14: Europe Insulin Pens Industry Volume Share (%), by Product 2025 & 2033
- Figure 15: Europe Insulin Pens Industry Revenue (Million), by Country 2025 & 2033
- Figure 16: Europe Insulin Pens Industry Volume (K Unit), by Country 2025 & 2033
- Figure 17: Europe Insulin Pens Industry Revenue Share (%), by Country 2025 & 2033
- Figure 18: Europe Insulin Pens Industry Volume Share (%), by Country 2025 & 2033
- Figure 19: Asia Pacific Insulin Pens Industry Revenue (Million), by Product 2025 & 2033
- Figure 20: Asia Pacific Insulin Pens Industry Volume (K Unit), by Product 2025 & 2033
- Figure 21: Asia Pacific Insulin Pens Industry Revenue Share (%), by Product 2025 & 2033
- Figure 22: Asia Pacific Insulin Pens Industry Volume Share (%), by Product 2025 & 2033
- Figure 23: Asia Pacific Insulin Pens Industry Revenue (Million), by Country 2025 & 2033
- Figure 24: Asia Pacific Insulin Pens Industry Volume (K Unit), by Country 2025 & 2033
- Figure 25: Asia Pacific Insulin Pens Industry Revenue Share (%), by Country 2025 & 2033
- Figure 26: Asia Pacific Insulin Pens Industry Volume Share (%), by Country 2025 & 2033
- Figure 27: Latin America Insulin Pens Industry Revenue (Million), by Product 2025 & 2033
- Figure 28: Latin America Insulin Pens Industry Volume (K Unit), by Product 2025 & 2033
- Figure 29: Latin America Insulin Pens Industry Revenue Share (%), by Product 2025 & 2033
- Figure 30: Latin America Insulin Pens Industry Volume Share (%), by Product 2025 & 2033
- Figure 31: Latin America Insulin Pens Industry Revenue (Million), by Country 2025 & 2033
- Figure 32: Latin America Insulin Pens Industry Volume (K Unit), by Country 2025 & 2033
- Figure 33: Latin America Insulin Pens Industry Revenue Share (%), by Country 2025 & 2033
- Figure 34: Latin America Insulin Pens Industry Volume Share (%), by Country 2025 & 2033
- Figure 35: Middle East and Africa Insulin Pens Industry Revenue (Million), by Product 2025 & 2033
- Figure 36: Middle East and Africa Insulin Pens Industry Volume (K Unit), by Product 2025 & 2033
- Figure 37: Middle East and Africa Insulin Pens Industry Revenue Share (%), by Product 2025 & 2033
- Figure 38: Middle East and Africa Insulin Pens Industry Volume Share (%), by Product 2025 & 2033
- Figure 39: Middle East and Africa Insulin Pens Industry Revenue (Million), by Country 2025 & 2033
- Figure 40: Middle East and Africa Insulin Pens Industry Volume (K Unit), by Country 2025 & 2033
- Figure 41: Middle East and Africa Insulin Pens Industry Revenue Share (%), by Country 2025 & 2033
- Figure 42: Middle East and Africa Insulin Pens Industry Volume Share (%), by Country 2025 & 2033
List of Tables
- Table 1: Global Insulin Pens Industry Revenue Million Forecast, by Product 2020 & 2033
- Table 2: Global Insulin Pens Industry Volume K Unit Forecast, by Product 2020 & 2033
- Table 3: Global Insulin Pens Industry Revenue Million Forecast, by Region 2020 & 2033
- Table 4: Global Insulin Pens Industry Volume K Unit Forecast, by Region 2020 & 2033
- Table 5: Global Insulin Pens Industry Revenue Million Forecast, by Product 2020 & 2033
- Table 6: Global Insulin Pens Industry Volume K Unit Forecast, by Product 2020 & 2033
- Table 7: Global Insulin Pens Industry Revenue Million Forecast, by Country 2020 & 2033
- Table 8: Global Insulin Pens Industry Volume K Unit Forecast, by Country 2020 & 2033
- Table 9: United States Insulin Pens Industry Revenue (Million) Forecast, by Application 2020 & 2033
- Table 10: United States Insulin Pens Industry Volume (K Unit) Forecast, by Application 2020 & 2033
- Table 11: Canada Insulin Pens Industry Revenue (Million) Forecast, by Application 2020 & 2033
- Table 12: Canada Insulin Pens Industry Volume (K Unit) Forecast, by Application 2020 & 2033
- Table 13: Rest of North America Insulin Pens Industry Revenue (Million) Forecast, by Application 2020 & 2033
- Table 14: Rest of North America Insulin Pens Industry Volume (K Unit) Forecast, by Application 2020 & 2033
- Table 15: Global Insulin Pens Industry Revenue Million Forecast, by Product 2020 & 2033
- Table 16: Global Insulin Pens Industry Volume K Unit Forecast, by Product 2020 & 2033
- Table 17: Global Insulin Pens Industry Revenue Million Forecast, by Country 2020 & 2033
- Table 18: Global Insulin Pens Industry Volume K Unit Forecast, by Country 2020 & 2033
- Table 19: Germany Insulin Pens Industry Revenue (Million) Forecast, by Application 2020 & 2033
- Table 20: Germany Insulin Pens Industry Volume (K Unit) Forecast, by Application 2020 & 2033
- Table 21: United Kingdom Insulin Pens Industry Revenue (Million) Forecast, by Application 2020 & 2033
- Table 22: United Kingdom Insulin Pens Industry Volume (K Unit) Forecast, by Application 2020 & 2033
- Table 23: France Insulin Pens Industry Revenue (Million) Forecast, by Application 2020 & 2033
- Table 24: France Insulin Pens Industry Volume (K Unit) Forecast, by Application 2020 & 2033
- Table 25: Russia Insulin Pens Industry Revenue (Million) Forecast, by Application 2020 & 2033
- Table 26: Russia Insulin Pens Industry Volume (K Unit) Forecast, by Application 2020 & 2033
- Table 27: Spain Insulin Pens Industry Revenue (Million) Forecast, by Application 2020 & 2033
- Table 28: Spain Insulin Pens Industry Volume (K Unit) Forecast, by Application 2020 & 2033
- Table 29: Italy Insulin Pens Industry Revenue (Million) Forecast, by Application 2020 & 2033
- Table 30: Italy Insulin Pens Industry Volume (K Unit) Forecast, by Application 2020 & 2033
- Table 31: Rest of Europe Insulin Pens Industry Revenue (Million) Forecast, by Application 2020 & 2033
- Table 32: Rest of Europe Insulin Pens Industry Volume (K Unit) Forecast, by Application 2020 & 2033
- Table 33: Global Insulin Pens Industry Revenue Million Forecast, by Product 2020 & 2033
- Table 34: Global Insulin Pens Industry Volume K Unit Forecast, by Product 2020 & 2033
- Table 35: Global Insulin Pens Industry Revenue Million Forecast, by Country 2020 & 2033
- Table 36: Global Insulin Pens Industry Volume K Unit Forecast, by Country 2020 & 2033
- Table 37: India Insulin Pens Industry Revenue (Million) Forecast, by Application 2020 & 2033
- Table 38: India Insulin Pens Industry Volume (K Unit) Forecast, by Application 2020 & 2033
- Table 39: China Insulin Pens Industry Revenue (Million) Forecast, by Application 2020 & 2033
- Table 40: China Insulin Pens Industry Volume (K Unit) Forecast, by Application 2020 & 2033
- Table 41: Japan Insulin Pens Industry Revenue (Million) Forecast, by Application 2020 & 2033
- Table 42: Japan Insulin Pens Industry Volume (K Unit) Forecast, by Application 2020 & 2033
- Table 43: South Korea Insulin Pens Industry Revenue (Million) Forecast, by Application 2020 & 2033
- Table 44: South Korea Insulin Pens Industry Volume (K Unit) Forecast, by Application 2020 & 2033
- Table 45: Australia Insulin Pens Industry Revenue (Million) Forecast, by Application 2020 & 2033
- Table 46: Australia Insulin Pens Industry Volume (K Unit) Forecast, by Application 2020 & 2033
- Table 47: Vietnam Insulin Pens Industry Revenue (Million) Forecast, by Application 2020 & 2033
- Table 48: Vietnam Insulin Pens Industry Volume (K Unit) Forecast, by Application 2020 & 2033
- Table 49: Malaysia Insulin Pens Industry Revenue (Million) Forecast, by Application 2020 & 2033
- Table 50: Malaysia Insulin Pens Industry Volume (K Unit) Forecast, by Application 2020 & 2033
- Table 51: Indonesia Insulin Pens Industry Revenue (Million) Forecast, by Application 2020 & 2033
- Table 52: Indonesia Insulin Pens Industry Volume (K Unit) Forecast, by Application 2020 & 2033
- Table 53: Philippines Insulin Pens Industry Revenue (Million) Forecast, by Application 2020 & 2033
- Table 54: Philippines Insulin Pens Industry Volume (K Unit) Forecast, by Application 2020 & 2033
- Table 55: Thailand Insulin Pens Industry Revenue (Million) Forecast, by Application 2020 & 2033
- Table 56: Thailand Insulin Pens Industry Volume (K Unit) Forecast, by Application 2020 & 2033
- Table 57: Rest of the Asia Pacific Insulin Pens Industry Revenue (Million) Forecast, by Application 2020 & 2033
- Table 58: Rest of the Asia Pacific Insulin Pens Industry Volume (K Unit) Forecast, by Application 2020 & 2033
- Table 59: Global Insulin Pens Industry Revenue Million Forecast, by Product 2020 & 2033
- Table 60: Global Insulin Pens Industry Volume K Unit Forecast, by Product 2020 & 2033
- Table 61: Global Insulin Pens Industry Revenue Million Forecast, by Country 2020 & 2033
- Table 62: Global Insulin Pens Industry Volume K Unit Forecast, by Country 2020 & 2033
- Table 63: Brazil Insulin Pens Industry Revenue (Million) Forecast, by Application 2020 & 2033
- Table 64: Brazil Insulin Pens Industry Volume (K Unit) Forecast, by Application 2020 & 2033
- Table 65: Mexico Insulin Pens Industry Revenue (Million) Forecast, by Application 2020 & 2033
- Table 66: Mexico Insulin Pens Industry Volume (K Unit) Forecast, by Application 2020 & 2033
- Table 67: Rest of Latin America Insulin Pens Industry Revenue (Million) Forecast, by Application 2020 & 2033
- Table 68: Rest of Latin America Insulin Pens Industry Volume (K Unit) Forecast, by Application 2020 & 2033
- Table 69: Global Insulin Pens Industry Revenue Million Forecast, by Product 2020 & 2033
- Table 70: Global Insulin Pens Industry Volume K Unit Forecast, by Product 2020 & 2033
- Table 71: Global Insulin Pens Industry Revenue Million Forecast, by Country 2020 & 2033
- Table 72: Global Insulin Pens Industry Volume K Unit Forecast, by Country 2020 & 2033
- Table 73: Egypt Insulin Pens Industry Revenue (Million) Forecast, by Application 2020 & 2033
- Table 74: Egypt Insulin Pens Industry Volume (K Unit) Forecast, by Application 2020 & 2033
- Table 75: Saudi Arabia Insulin Pens Industry Revenue (Million) Forecast, by Application 2020 & 2033
- Table 76: Saudi Arabia Insulin Pens Industry Volume (K Unit) Forecast, by Application 2020 & 2033
- Table 77: Iran Insulin Pens Industry Revenue (Million) Forecast, by Application 2020 & 2033
- Table 78: Iran Insulin Pens Industry Volume (K Unit) Forecast, by Application 2020 & 2033
- Table 79: South Africa Insulin Pens Industry Revenue (Million) Forecast, by Application 2020 & 2033
- Table 80: South Africa Insulin Pens Industry Volume (K Unit) Forecast, by Application 2020 & 2033
- Table 81: Oman Insulin Pens Industry Revenue (Million) Forecast, by Application 2020 & 2033
- Table 82: Oman Insulin Pens Industry Volume (K Unit) Forecast, by Application 2020 & 2033
- Table 83: Rest of the Middle East and Africa Insulin Pens Industry Revenue (Million) Forecast, by Application 2020 & 2033
- Table 84: Rest of the Middle East and Africa Insulin Pens Industry Volume (K Unit) Forecast, by Application 2020 & 2033
Frequently Asked Questions
1. What is the projected Compound Annual Growth Rate (CAGR) of the Insulin Pens Industry?
The projected CAGR is approximately 3.40%.
2. Which companies are prominent players in the Insulin Pens Industry?
Key companies in the market include Eli Lilly, Sanofi, Julphar, Biocon, Novo Nordisk.
3. What are the main segments of the Insulin Pens Industry?
The market segments include Product.
4. Can you provide details about the market size?
The market size is estimated to be USD 33.31 Million as of 2022.
5. What are some drivers contributing to market growth?
; The Rise in Global Prevalence of Cases of Obesity due to Modern Sedentary Lifestyles; Rise in Awareness and Disposable Income in Developed Economies.
6. What are the notable trends driving market growth?
The Market is Expected to Grow as the Number of Diabetes Patients Increase Year-On-Year.
7. Are there any restraints impacting market growth?
; Highly Cost of Branded Products in Emerging Countries; Severe Adverse Associated with Medication Including Seizures. Suicidal Attempts and Even Death; Adoption of Traditional Yoga and Herbal Products.
8. Can you provide examples of recent developments in the market?
Nov 2022: Lilly was expected to begin the rollout of the Tempo Personalized Diabetes Management Platform. The platform consists of three key components: the Tempo Smart Button, a compatible app, TempoSmart, and a prefilled insulin pen, Tempo Pen, which work together to deliver personalized guidance for adults with diabetes.
9. What pricing options are available for accessing the report?
Pricing options include single-user, multi-user, and enterprise licenses priced at USD 4750, USD 5250, and USD 8750 respectively.
10. Is the market size provided in terms of value or volume?
The market size is provided in terms of value, measured in Million and volume, measured in K Unit.
11. Are there any specific market keywords associated with the report?
Yes, the market keyword associated with the report is "Insulin Pens Industry," which aids in identifying and referencing the specific market segment covered.
12. How do I determine which pricing option suits my needs best?
The pricing options vary based on user requirements and access needs. Individual users may opt for single-user licenses, while businesses requiring broader access may choose multi-user or enterprise licenses for cost-effective access to the report.
13. Are there any additional resources or data provided in the Insulin Pens Industry report?
While the report offers comprehensive insights, it's advisable to review the specific contents or supplementary materials provided to ascertain if additional resources or data are available.
14. How can I stay updated on further developments or reports in the Insulin Pens Industry?
To stay informed about further developments, trends, and reports in the Insulin Pens Industry, consider subscribing to industry newsletters, following relevant companies and organizations, or regularly checking reputable industry news sources and publications.
Methodology
Step 1 - Identification of Relevant Samples Size from Population Database


Step 2 - Approaches for Defining Global Market Size (Value, Volume* & Price*)

Note*: In applicable scenarios
Step 3 - Data Sources
Primary Research
- Web Analytics
- Survey Reports
- Research Institute
- Latest Research Reports
- Opinion Leaders
Secondary Research
- Annual Reports
- White Paper
- Latest Press Release
- Industry Association
- Paid Database
- Investor Presentations

Step 4 - Data Triangulation
Involves using different sources of information in order to increase the validity of a study
These sources are likely to be stakeholders in a program - participants, other researchers, program staff, other community members, and so on.
Then we put all data in single framework & apply various statistical tools to find out the dynamic on the market.
During the analysis stage, feedback from the stakeholder groups would be compared to determine areas of agreement as well as areas of divergence