

Key Insights
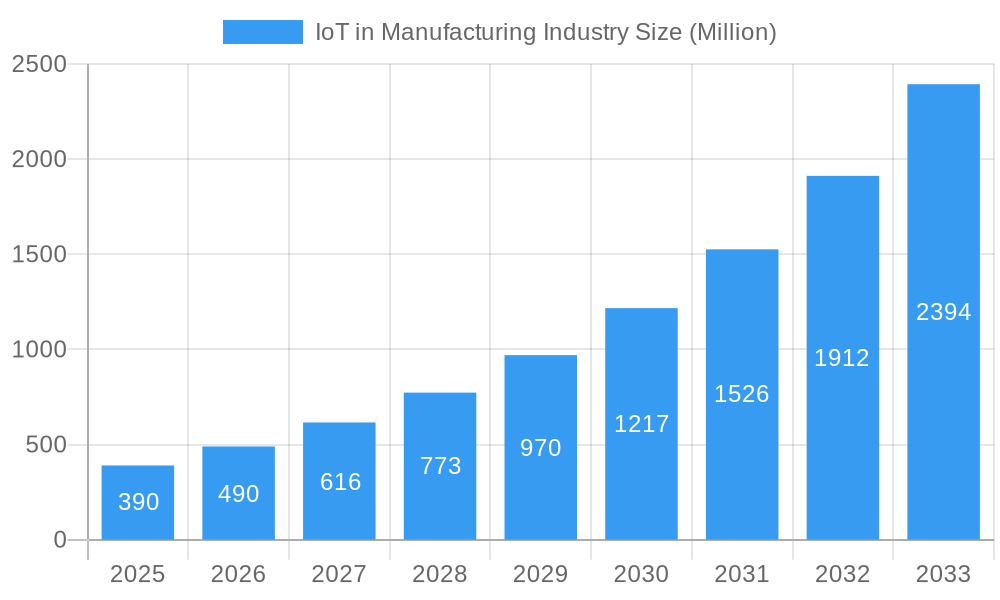
The Industrial Internet of Things (IIoT) in the manufacturing sector is experiencing robust growth, projected to reach a market size of $0.39 billion in 2025 and expand significantly over the forecast period (2025-2033). A compound annual growth rate (CAGR) of 25.33% signifies substantial market expansion driven by several key factors. Increased automation needs, the desire for improved operational efficiency, predictive maintenance capabilities, and real-time data analytics are major catalysts. Manufacturers are increasingly adopting IIoT solutions to optimize production processes, reduce downtime, enhance supply chain visibility, and improve overall product quality. The diverse range of applications—from process optimization and predictive maintenance to asset and workforce management—further fuels this growth. Segmentation reveals strong demand across various verticals, including automotive, food and agriculture equipment, and industrial equipment, with significant contributions from software solutions (application security, data management, and monitoring) and diverse connectivity options (cellular, satellite, RFID, etc.).
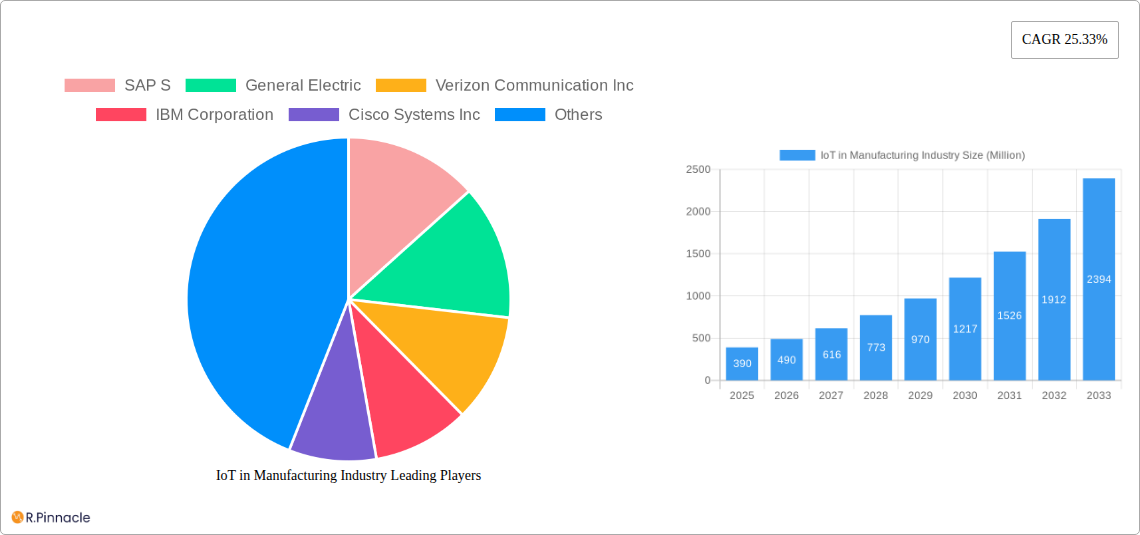
IoT in Manufacturing Industry Market Size (In Million)
The market's growth trajectory is influenced by various trends, including the increasing adoption of cloud-based IIoT platforms, the rise of edge computing for faster data processing, and the growing integration of artificial intelligence and machine learning for enhanced decision-making. However, challenges such as high initial investment costs, cybersecurity concerns, data integration complexities, and a shortage of skilled professionals could potentially hinder growth. To mitigate these challenges, manufacturers are focusing on strategic partnerships, developing robust cybersecurity measures, and investing in training programs to upskill their workforce. Geographical expansion is expected, with North America and Europe maintaining a strong lead, while Asia-Pacific is poised for considerable growth due to rapid industrialization and technological advancements in countries like China and India. The competitive landscape features a mix of established technology giants and specialized IIoT solution providers, fostering innovation and competition.
IoT in Manufacturing Industry Company Market Share
IoT in Manufacturing Industry: A Comprehensive Market Report (2019-2033)
This comprehensive report provides a detailed analysis of the Internet of Things (IoT) in the manufacturing industry, projecting a market valued at $XX Million by 2033. The report covers market structure, innovation trends, dynamics, dominant regions and segments, product innovations, and future outlook, offering actionable insights for industry professionals. The study period spans from 2019 to 2033, with 2025 serving as both the base and estimated year. Key players like SAP, General Electric, and Cisco are analyzed, providing a holistic view of this rapidly evolving sector.
IoT in Manufacturing Industry Market Structure & Innovation Trends
The IoT in manufacturing market exhibits a moderately concentrated structure, with a few major players holding significant market share. SAP, General Electric, and Siemens AG collectively account for an estimated xx% of the market, while other key players such as IBM, Cisco, and Microsoft compete intensely for the remaining share. Innovation is driven by the need for improved efficiency, enhanced productivity, predictive maintenance capabilities, and increased data-driven decision-making.
- Market Concentration: High, with key players holding significant market share.
- Innovation Drivers: Efficiency gains, predictive maintenance, data analytics.
- Regulatory Frameworks: Vary by region, impacting adoption and implementation.
- Product Substitutes: Limited, but existing legacy systems pose a challenge.
- End-User Demographics: Primarily large enterprises, with increasing adoption by SMEs.
- M&A Activity: Significant M&A activity witnessed in the historical period (2019-2024), with deals valued at over $XX Million. This reflects consolidation and expansion strategies by key players.
IoT in Manufacturing Industry Market Dynamics & Trends
The IoT in manufacturing market is experiencing robust growth, fueled by several key factors. The market is projected to exhibit a Compound Annual Growth Rate (CAGR) of xx% during the forecast period (2025-2033). Increased automation, the rising adoption of Industry 4.0 principles, and the need for real-time data analytics are major drivers. Technological advancements such as 5G, edge computing, and AI are further accelerating adoption. However, the market faces challenges including security concerns, data integration complexities, and the need for skilled workforce. Market penetration is currently at xx% in developed regions and is expected to increase significantly across emerging economies.
Dominant Regions & Segments in IoT in Manufacturing Industry
The North American region currently dominates the IoT in manufacturing market, driven by robust technological advancements, early adoption, and a well-established manufacturing base. Europe and Asia-Pacific are also key markets experiencing significant growth.
- By Services: System Integration and Deployment holds the largest market share, followed by Managed Services.
- By Application: Predictive Maintenance and Process Optimization are dominant applications.
- By End-user Vertical: Automotive, Industrial Equipment, and Electronics and Communication Equipment segments lead the market.
- By Software: Data Management and Analytics is the leading software segment.
- By Connectivity: Cellular Networks and Wi-Fi are primary connectivity options, with a growing interest in 5G adoption.
Key Drivers:
- North America: Strong technological advancements and early adoption.
- Europe: Stringent environmental regulations and focus on sustainability.
- Asia-Pacific: Rapid industrialization and cost-effective manufacturing.
IoT in Manufacturing Industry Product Innovations
Recent product innovations focus on improving the security, scalability, and interoperability of IoT solutions within manufacturing environments. The integration of AI and machine learning into IoT platforms enables predictive maintenance and advanced process optimization. New edge computing capabilities minimize latency and improve real-time decision-making, addressing key market demands for enhanced efficiency and reduced downtime.
Report Scope & Segmentation Analysis
This report segments the IoT in manufacturing market by Services (Professional, System Integration and Deployment, Managed, Other Services), Application (Process Optimization, Predictive Maintenance, Asset Management, Workforce Management, Emergency and Incident Management, Logistics and Supply Chain Management, Inventory Management), End-user Vertical (Automotive, Food and Agriculture Equipment, Industrial Equipment, Electronics and Communication Equipment, Chemicals and Materials Equipment, Other End-user Verticals), Software (Application Security, Data Management and Analytics, Monitoring, Network Management, Other Software), and Connectivity (Satellite Network, Cellular Network, RFID, NFC, Wi-Fi, Other Connectivities). Each segment is analyzed in detail, with growth projections and competitive dynamics provided. Market sizes for each segment are projected to reach $XX Million by 2033, with varying growth rates across segments.
Key Drivers of IoT in Manufacturing Industry Growth
The growth of the IoT in manufacturing industry is primarily driven by technological advancements (e.g., 5G, AI, edge computing), economic incentives (e.g., government subsidies for digital transformation), and regulatory pressures (e.g., environmental regulations promoting efficient resource use). These factors are creating a favorable environment for wider adoption of IoT solutions across diverse manufacturing sectors.
Challenges in the IoT in Manufacturing Industry Sector
Key challenges include the high initial investment costs associated with implementing IoT solutions, cybersecurity risks, data privacy concerns, the complexity of integrating legacy systems with new IoT technologies, and a shortage of skilled professionals capable of managing and maintaining complex IoT infrastructures. These factors can significantly impact the adoption rate and return on investment for businesses.
Emerging Opportunities in IoT in Manufacturing Industry
Emerging opportunities lie in the expansion of IoT applications into new manufacturing segments, such as personalized manufacturing and the integration of blockchain technology for improved supply chain transparency and security. Advancements in AI and machine learning offer potential for improved predictive maintenance, process optimization, and overall operational efficiency, creating new revenue streams and competitive advantages.
Leading Players in the IoT in Manufacturing Industry Market
Key Developments in IoT in Manufacturing Industry Industry
- February 2022: Cisco enhanced its IoT portfolio to simplify LPWAN/4G/5G connectivity management for service providers, opening new revenue streams.
- August 2022: Intel partnered with Check Point Software to integrate Quantum IoT Protect into Intel Pathfinder for RISC-V, bolstering IoT device security.
Future Outlook for IoT in Manufacturing Industry Market
The future of the IoT in manufacturing market is exceptionally promising. Continued technological advancements, increasing demand for enhanced efficiency and productivity, and supportive government policies will fuel market growth. Strategic partnerships and collaborations between technology providers and manufacturers will further accelerate the adoption of IoT solutions, creating a more interconnected and data-driven manufacturing landscape.
IoT in Manufacturing Industry Segmentation
-
1. Software
- 1.1. Application Security
- 1.2. Data Management and Analytics
- 1.3. Monitoring
- 1.4. Network Management
- 1.5. Other Software
-
2. Connectivity
- 2.1. Satellite Network
- 2.2. Cellular Network
- 2.3. RFID
- 2.4. NFC
- 2.5. Wi-Fi
- 2.6. Other Connectivities
-
3. Services
- 3.1. Professional
- 3.2. System Integration and Deployment
- 3.3. Managed
- 3.4. Other Services
-
4. Application
- 4.1. Process Optimization
- 4.2. Predictive Maintenance
- 4.3. Asset Management
- 4.4. Workforce Management
- 4.5. Emergency and Incident Management
- 4.6. Logistics and Supply Chain Management
- 4.7. Inventory Management
-
5. End-user Vertical
- 5.1. Automotive
- 5.2. Food and Agriculture Equipment
- 5.3. Industrial Equipment
- 5.4. Electronics and Communication Equipment
- 5.5. Chemicals and Materials Equipment
- 5.6. Other End-user Verticals
IoT in Manufacturing Industry Segmentation By Geography
-
1. North America
- 1.1. United States
- 1.2. Canada
-
2. Europe
- 2.1. Germany
- 2.2. United Kingdom
- 2.3. France
- 2.4. Spain
-
3. Asia
- 3.1. China
- 3.2. Japan
- 3.3. India
- 3.4. Australia and New Zealand
-
4. Latin America
- 4.1. Brazil
- 4.2. Mexico
- 4.3. Argentina
-
5. Middle East and Africa
- 5.1. United Arab Emirates
- 5.2. Saudi Arabia
- 5.3. South Africa
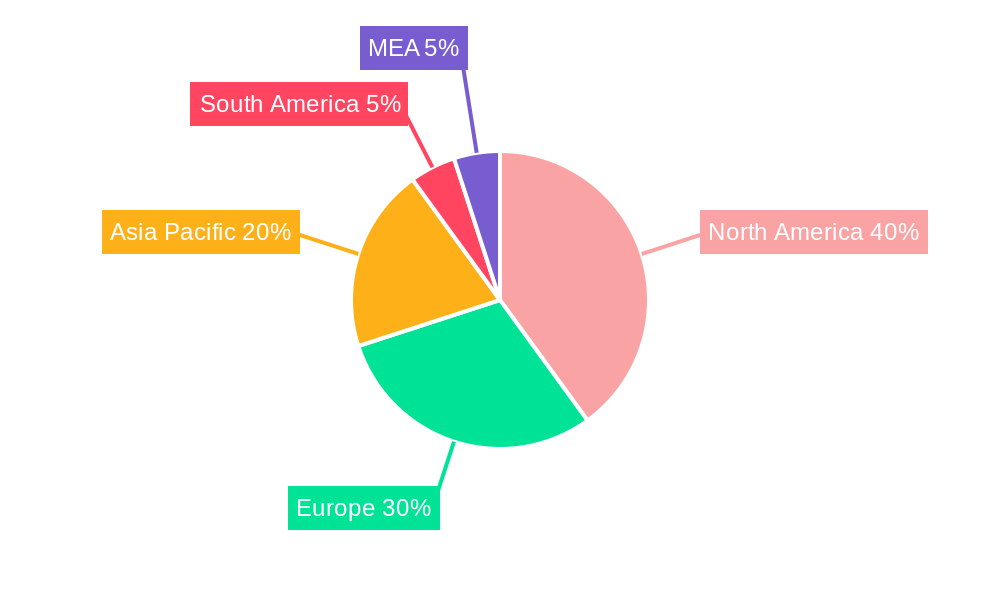
IoT in Manufacturing Industry Regional Market Share
Geographic Coverage of IoT in Manufacturing Industry
IoT in Manufacturing Industry REPORT HIGHLIGHTS
| Aspects | Details |
|---|---|
| Study Period | 2020-2034 |
| Base Year | 2025 |
| Estimated Year | 2026 |
| Forecast Period | 2026-2034 |
| Historical Period | 2020-2025 |
| Growth Rate | CAGR of 25.33% from 2020-2034 |
| Segmentation |
|
Table of Contents
- 1. Introduction
- 1.1. Research Scope
- 1.2. Market Segmentation
- 1.3. Research Objective
- 1.4. Definitions and Assumptions
- 2. Executive Summary
- 2.1. Market Snapshot
- 3. Market Dynamics
- 3.1. Market Drivers
- 3.2. Market Restrains
- 3.3. Market Trends
- 3.4. Market Opportunities
- 4. Market Factor Analysis
- 4.1. Porters Five Forces
- 4.1.1. Bargaining Power of Suppliers
- 4.1.2. Bargaining Power of Buyers
- 4.1.3. Threat of New Entrants
- 4.1.4. Threat of Substitutes
- 4.1.5. Competitive Rivalry
- 4.2. PESTEL analysis
- 4.3. BCG Analysis
- 4.3.1. Stars (High Growth, High Market Share)
- 4.3.2. Cash Cows (Low Growth, High Market Share)
- 4.3.3. Question Mark (High Growth, Low Market Share)
- 4.3.4. Dogs (Low Growth, Low Market Share)
- 4.4. Ansoff Matrix Analysis
- 4.5. Supply Chain Analysis
- 4.6. Regulatory Landscape
- 4.7. Current Market Potential and Opportunity Assessment (TAM–SAM–SOM Framework)
- 4.8. PRI Analyst Note
- 4.1. Porters Five Forces
- 5. Market Analysis, Insights and Forecast 2021-2033
- 5.1. Market Analysis, Insights and Forecast - by Software
- 5.1.1. Application Security
- 5.1.2. Data Management and Analytics
- 5.1.3. Monitoring
- 5.1.4. Network Management
- 5.1.5. Other Software
- 5.2. Market Analysis, Insights and Forecast - by Connectivity
- 5.2.1. Satellite Network
- 5.2.2. Cellular Network
- 5.2.3. RFID
- 5.2.4. NFC
- 5.2.5. Wi-Fi
- 5.2.6. Other Connectivities
- 5.3. Market Analysis, Insights and Forecast - by Services
- 5.3.1. Professional
- 5.3.2. System Integration and Deployment
- 5.3.3. Managed
- 5.3.4. Other Services
- 5.4. Market Analysis, Insights and Forecast - by Application
- 5.4.1. Process Optimization
- 5.4.2. Predictive Maintenance
- 5.4.3. Asset Management
- 5.4.4. Workforce Management
- 5.4.5. Emergency and Incident Management
- 5.4.6. Logistics and Supply Chain Management
- 5.4.7. Inventory Management
- 5.5. Market Analysis, Insights and Forecast - by End-user Vertical
- 5.5.1. Automotive
- 5.5.2. Food and Agriculture Equipment
- 5.5.3. Industrial Equipment
- 5.5.4. Electronics and Communication Equipment
- 5.5.5. Chemicals and Materials Equipment
- 5.5.6. Other End-user Verticals
- 5.6. Market Analysis, Insights and Forecast - by Region
- 5.6.1. North America
- 5.6.2. Europe
- 5.6.3. Asia
- 5.6.4. Latin America
- 5.6.5. Middle East and Africa
- 5.1. Market Analysis, Insights and Forecast - by Software
- 6. Global IoT in Manufacturing Industry Analysis, Insights and Forecast, 2021-2033
- 6.1. Market Analysis, Insights and Forecast - by Software
- 6.1.1. Application Security
- 6.1.2. Data Management and Analytics
- 6.1.3. Monitoring
- 6.1.4. Network Management
- 6.1.5. Other Software
- 6.2. Market Analysis, Insights and Forecast - by Connectivity
- 6.2.1. Satellite Network
- 6.2.2. Cellular Network
- 6.2.3. RFID
- 6.2.4. NFC
- 6.2.5. Wi-Fi
- 6.2.6. Other Connectivities
- 6.3. Market Analysis, Insights and Forecast - by Services
- 6.3.1. Professional
- 6.3.2. System Integration and Deployment
- 6.3.3. Managed
- 6.3.4. Other Services
- 6.4. Market Analysis, Insights and Forecast - by Application
- 6.4.1. Process Optimization
- 6.4.2. Predictive Maintenance
- 6.4.3. Asset Management
- 6.4.4. Workforce Management
- 6.4.5. Emergency and Incident Management
- 6.4.6. Logistics and Supply Chain Management
- 6.4.7. Inventory Management
- 6.5. Market Analysis, Insights and Forecast - by End-user Vertical
- 6.5.1. Automotive
- 6.5.2. Food and Agriculture Equipment
- 6.5.3. Industrial Equipment
- 6.5.4. Electronics and Communication Equipment
- 6.5.5. Chemicals and Materials Equipment
- 6.5.6. Other End-user Verticals
- 6.1. Market Analysis, Insights and Forecast - by Software
- 7. North America IoT in Manufacturing Industry Analysis, Insights and Forecast, 2020-2032
- 7.1. Market Analysis, Insights and Forecast - by Software
- 7.1.1. Application Security
- 7.1.2. Data Management and Analytics
- 7.1.3. Monitoring
- 7.1.4. Network Management
- 7.1.5. Other Software
- 7.2. Market Analysis, Insights and Forecast - by Connectivity
- 7.2.1. Satellite Network
- 7.2.2. Cellular Network
- 7.2.3. RFID
- 7.2.4. NFC
- 7.2.5. Wi-Fi
- 7.2.6. Other Connectivities
- 7.3. Market Analysis, Insights and Forecast - by Services
- 7.3.1. Professional
- 7.3.2. System Integration and Deployment
- 7.3.3. Managed
- 7.3.4. Other Services
- 7.4. Market Analysis, Insights and Forecast - by Application
- 7.4.1. Process Optimization
- 7.4.2. Predictive Maintenance
- 7.4.3. Asset Management
- 7.4.4. Workforce Management
- 7.4.5. Emergency and Incident Management
- 7.4.6. Logistics and Supply Chain Management
- 7.4.7. Inventory Management
- 7.5. Market Analysis, Insights and Forecast - by End-user Vertical
- 7.5.1. Automotive
- 7.5.2. Food and Agriculture Equipment
- 7.5.3. Industrial Equipment
- 7.5.4. Electronics and Communication Equipment
- 7.5.5. Chemicals and Materials Equipment
- 7.5.6. Other End-user Verticals
- 7.1. Market Analysis, Insights and Forecast - by Software
- 8. Europe IoT in Manufacturing Industry Analysis, Insights and Forecast, 2020-2032
- 8.1. Market Analysis, Insights and Forecast - by Software
- 8.1.1. Application Security
- 8.1.2. Data Management and Analytics
- 8.1.3. Monitoring
- 8.1.4. Network Management
- 8.1.5. Other Software
- 8.2. Market Analysis, Insights and Forecast - by Connectivity
- 8.2.1. Satellite Network
- 8.2.2. Cellular Network
- 8.2.3. RFID
- 8.2.4. NFC
- 8.2.5. Wi-Fi
- 8.2.6. Other Connectivities
- 8.3. Market Analysis, Insights and Forecast - by Services
- 8.3.1. Professional
- 8.3.2. System Integration and Deployment
- 8.3.3. Managed
- 8.3.4. Other Services
- 8.4. Market Analysis, Insights and Forecast - by Application
- 8.4.1. Process Optimization
- 8.4.2. Predictive Maintenance
- 8.4.3. Asset Management
- 8.4.4. Workforce Management
- 8.4.5. Emergency and Incident Management
- 8.4.6. Logistics and Supply Chain Management
- 8.4.7. Inventory Management
- 8.5. Market Analysis, Insights and Forecast - by End-user Vertical
- 8.5.1. Automotive
- 8.5.2. Food and Agriculture Equipment
- 8.5.3. Industrial Equipment
- 8.5.4. Electronics and Communication Equipment
- 8.5.5. Chemicals and Materials Equipment
- 8.5.6. Other End-user Verticals
- 8.1. Market Analysis, Insights and Forecast - by Software
- 9. Asia IoT in Manufacturing Industry Analysis, Insights and Forecast, 2020-2032
- 9.1. Market Analysis, Insights and Forecast - by Software
- 9.1.1. Application Security
- 9.1.2. Data Management and Analytics
- 9.1.3. Monitoring
- 9.1.4. Network Management
- 9.1.5. Other Software
- 9.2. Market Analysis, Insights and Forecast - by Connectivity
- 9.2.1. Satellite Network
- 9.2.2. Cellular Network
- 9.2.3. RFID
- 9.2.4. NFC
- 9.2.5. Wi-Fi
- 9.2.6. Other Connectivities
- 9.3. Market Analysis, Insights and Forecast - by Services
- 9.3.1. Professional
- 9.3.2. System Integration and Deployment
- 9.3.3. Managed
- 9.3.4. Other Services
- 9.4. Market Analysis, Insights and Forecast - by Application
- 9.4.1. Process Optimization
- 9.4.2. Predictive Maintenance
- 9.4.3. Asset Management
- 9.4.4. Workforce Management
- 9.4.5. Emergency and Incident Management
- 9.4.6. Logistics and Supply Chain Management
- 9.4.7. Inventory Management
- 9.5. Market Analysis, Insights and Forecast - by End-user Vertical
- 9.5.1. Automotive
- 9.5.2. Food and Agriculture Equipment
- 9.5.3. Industrial Equipment
- 9.5.4. Electronics and Communication Equipment
- 9.5.5. Chemicals and Materials Equipment
- 9.5.6. Other End-user Verticals
- 9.1. Market Analysis, Insights and Forecast - by Software
- 10. Latin America IoT in Manufacturing Industry Analysis, Insights and Forecast, 2020-2032
- 10.1. Market Analysis, Insights and Forecast - by Software
- 10.1.1. Application Security
- 10.1.2. Data Management and Analytics
- 10.1.3. Monitoring
- 10.1.4. Network Management
- 10.1.5. Other Software
- 10.2. Market Analysis, Insights and Forecast - by Connectivity
- 10.2.1. Satellite Network
- 10.2.2. Cellular Network
- 10.2.3. RFID
- 10.2.4. NFC
- 10.2.5. Wi-Fi
- 10.2.6. Other Connectivities
- 10.3. Market Analysis, Insights and Forecast - by Services
- 10.3.1. Professional
- 10.3.2. System Integration and Deployment
- 10.3.3. Managed
- 10.3.4. Other Services
- 10.4. Market Analysis, Insights and Forecast - by Application
- 10.4.1. Process Optimization
- 10.4.2. Predictive Maintenance
- 10.4.3. Asset Management
- 10.4.4. Workforce Management
- 10.4.5. Emergency and Incident Management
- 10.4.6. Logistics and Supply Chain Management
- 10.4.7. Inventory Management
- 10.5. Market Analysis, Insights and Forecast - by End-user Vertical
- 10.5.1. Automotive
- 10.5.2. Food and Agriculture Equipment
- 10.5.3. Industrial Equipment
- 10.5.4. Electronics and Communication Equipment
- 10.5.5. Chemicals and Materials Equipment
- 10.5.6. Other End-user Verticals
- 10.1. Market Analysis, Insights and Forecast - by Software
- 11. Middle East and Africa IoT in Manufacturing Industry Analysis, Insights and Forecast, 2020-2032
- 11.1. Market Analysis, Insights and Forecast - by Software
- 11.1.1. Application Security
- 11.1.2. Data Management and Analytics
- 11.1.3. Monitoring
- 11.1.4. Network Management
- 11.1.5. Other Software
- 11.2. Market Analysis, Insights and Forecast - by Connectivity
- 11.2.1. Satellite Network
- 11.2.2. Cellular Network
- 11.2.3. RFID
- 11.2.4. NFC
- 11.2.5. Wi-Fi
- 11.2.6. Other Connectivities
- 11.3. Market Analysis, Insights and Forecast - by Services
- 11.3.1. Professional
- 11.3.2. System Integration and Deployment
- 11.3.3. Managed
- 11.3.4. Other Services
- 11.4. Market Analysis, Insights and Forecast - by Application
- 11.4.1. Process Optimization
- 11.4.2. Predictive Maintenance
- 11.4.3. Asset Management
- 11.4.4. Workforce Management
- 11.4.5. Emergency and Incident Management
- 11.4.6. Logistics and Supply Chain Management
- 11.4.7. Inventory Management
- 11.5. Market Analysis, Insights and Forecast - by End-user Vertical
- 11.5.1. Automotive
- 11.5.2. Food and Agriculture Equipment
- 11.5.3. Industrial Equipment
- 11.5.4. Electronics and Communication Equipment
- 11.5.5. Chemicals and Materials Equipment
- 11.5.6. Other End-user Verticals
- 11.1. Market Analysis, Insights and Forecast - by Software
- 12. Competitive Analysis
- 12.1. Company Profiles
- 12.1.1 SAP S
- 12.1.1.1. Company Overview
- 12.1.1.2. Products
- 12.1.1.3. Company Financials
- 12.1.1.4. SWOT Analysis
- 12.1.2 General Electric
- 12.1.2.1. Company Overview
- 12.1.2.2. Products
- 12.1.2.3. Company Financials
- 12.1.2.4. SWOT Analysis
- 12.1.3 Verizon Communication Inc
- 12.1.3.1. Company Overview
- 12.1.3.2. Products
- 12.1.3.3. Company Financials
- 12.1.3.4. SWOT Analysis
- 12.1.4 IBM Corporation
- 12.1.4.1. Company Overview
- 12.1.4.2. Products
- 12.1.4.3. Company Financials
- 12.1.4.4. SWOT Analysis
- 12.1.5 Cisco Systems Inc
- 12.1.5.1. Company Overview
- 12.1.5.2. Products
- 12.1.5.3. Company Financials
- 12.1.5.4. SWOT Analysis
- 12.1.6 Siemens AG
- 12.1.6.1. Company Overview
- 12.1.6.2. Products
- 12.1.6.3. Company Financials
- 12.1.6.4. SWOT Analysis
- 12.1.7 Microsoft Corporation
- 12.1.7.1. Company Overview
- 12.1.7.2. Products
- 12.1.7.3. Company Financials
- 12.1.7.4. SWOT Analysis
- 12.1.8 Qualcomm
- 12.1.8.1. Company Overview
- 12.1.8.2. Products
- 12.1.8.3. Company Financials
- 12.1.8.4. SWOT Analysis
- 12.1.9 AT&T Inc
- 12.1.9.1. Company Overview
- 12.1.9.2. Products
- 12.1.9.3. Company Financials
- 12.1.9.4. SWOT Analysis
- 12.1.10 Intel Corporation
- 12.1.10.1. Company Overview
- 12.1.10.2. Products
- 12.1.10.3. Company Financials
- 12.1.10.4. SWOT Analysis
- 12.1.1 SAP S
- 12.2. Market Entropy
- 12.2.1 Company's Key Areas Served
- 12.2.2 Recent Developments
- 12.3. Company Market Share Analysis 2025
- 12.3.1 Top 5 Companies Market Share Analysis
- 12.3.2 Top 3 Companies Market Share Analysis
- 12.4. List of Potential Customers
- 13. Research Methodology
List of Figures
- Figure 1: Global IoT in Manufacturing Industry Revenue Breakdown (Million, %) by Region 2025 & 2033
- Figure 2: North America IoT in Manufacturing Industry Revenue (Million), by Software 2025 & 2033
- Figure 3: North America IoT in Manufacturing Industry Revenue Share (%), by Software 2025 & 2033
- Figure 4: North America IoT in Manufacturing Industry Revenue (Million), by Connectivity 2025 & 2033
- Figure 5: North America IoT in Manufacturing Industry Revenue Share (%), by Connectivity 2025 & 2033
- Figure 6: North America IoT in Manufacturing Industry Revenue (Million), by Services 2025 & 2033
- Figure 7: North America IoT in Manufacturing Industry Revenue Share (%), by Services 2025 & 2033
- Figure 8: North America IoT in Manufacturing Industry Revenue (Million), by Application 2025 & 2033
- Figure 9: North America IoT in Manufacturing Industry Revenue Share (%), by Application 2025 & 2033
- Figure 10: North America IoT in Manufacturing Industry Revenue (Million), by End-user Vertical 2025 & 2033
- Figure 11: North America IoT in Manufacturing Industry Revenue Share (%), by End-user Vertical 2025 & 2033
- Figure 12: North America IoT in Manufacturing Industry Revenue (Million), by Country 2025 & 2033
- Figure 13: North America IoT in Manufacturing Industry Revenue Share (%), by Country 2025 & 2033
- Figure 14: Europe IoT in Manufacturing Industry Revenue (Million), by Software 2025 & 2033
- Figure 15: Europe IoT in Manufacturing Industry Revenue Share (%), by Software 2025 & 2033
- Figure 16: Europe IoT in Manufacturing Industry Revenue (Million), by Connectivity 2025 & 2033
- Figure 17: Europe IoT in Manufacturing Industry Revenue Share (%), by Connectivity 2025 & 2033
- Figure 18: Europe IoT in Manufacturing Industry Revenue (Million), by Services 2025 & 2033
- Figure 19: Europe IoT in Manufacturing Industry Revenue Share (%), by Services 2025 & 2033
- Figure 20: Europe IoT in Manufacturing Industry Revenue (Million), by Application 2025 & 2033
- Figure 21: Europe IoT in Manufacturing Industry Revenue Share (%), by Application 2025 & 2033
- Figure 22: Europe IoT in Manufacturing Industry Revenue (Million), by End-user Vertical 2025 & 2033
- Figure 23: Europe IoT in Manufacturing Industry Revenue Share (%), by End-user Vertical 2025 & 2033
- Figure 24: Europe IoT in Manufacturing Industry Revenue (Million), by Country 2025 & 2033
- Figure 25: Europe IoT in Manufacturing Industry Revenue Share (%), by Country 2025 & 2033
- Figure 26: Asia IoT in Manufacturing Industry Revenue (Million), by Software 2025 & 2033
- Figure 27: Asia IoT in Manufacturing Industry Revenue Share (%), by Software 2025 & 2033
- Figure 28: Asia IoT in Manufacturing Industry Revenue (Million), by Connectivity 2025 & 2033
- Figure 29: Asia IoT in Manufacturing Industry Revenue Share (%), by Connectivity 2025 & 2033
- Figure 30: Asia IoT in Manufacturing Industry Revenue (Million), by Services 2025 & 2033
- Figure 31: Asia IoT in Manufacturing Industry Revenue Share (%), by Services 2025 & 2033
- Figure 32: Asia IoT in Manufacturing Industry Revenue (Million), by Application 2025 & 2033
- Figure 33: Asia IoT in Manufacturing Industry Revenue Share (%), by Application 2025 & 2033
- Figure 34: Asia IoT in Manufacturing Industry Revenue (Million), by End-user Vertical 2025 & 2033
- Figure 35: Asia IoT in Manufacturing Industry Revenue Share (%), by End-user Vertical 2025 & 2033
- Figure 36: Asia IoT in Manufacturing Industry Revenue (Million), by Country 2025 & 2033
- Figure 37: Asia IoT in Manufacturing Industry Revenue Share (%), by Country 2025 & 2033
- Figure 38: Latin America IoT in Manufacturing Industry Revenue (Million), by Software 2025 & 2033
- Figure 39: Latin America IoT in Manufacturing Industry Revenue Share (%), by Software 2025 & 2033
- Figure 40: Latin America IoT in Manufacturing Industry Revenue (Million), by Connectivity 2025 & 2033
- Figure 41: Latin America IoT in Manufacturing Industry Revenue Share (%), by Connectivity 2025 & 2033
- Figure 42: Latin America IoT in Manufacturing Industry Revenue (Million), by Services 2025 & 2033
- Figure 43: Latin America IoT in Manufacturing Industry Revenue Share (%), by Services 2025 & 2033
- Figure 44: Latin America IoT in Manufacturing Industry Revenue (Million), by Application 2025 & 2033
- Figure 45: Latin America IoT in Manufacturing Industry Revenue Share (%), by Application 2025 & 2033
- Figure 46: Latin America IoT in Manufacturing Industry Revenue (Million), by End-user Vertical 2025 & 2033
- Figure 47: Latin America IoT in Manufacturing Industry Revenue Share (%), by End-user Vertical 2025 & 2033
- Figure 48: Latin America IoT in Manufacturing Industry Revenue (Million), by Country 2025 & 2033
- Figure 49: Latin America IoT in Manufacturing Industry Revenue Share (%), by Country 2025 & 2033
- Figure 50: Middle East and Africa IoT in Manufacturing Industry Revenue (Million), by Software 2025 & 2033
- Figure 51: Middle East and Africa IoT in Manufacturing Industry Revenue Share (%), by Software 2025 & 2033
- Figure 52: Middle East and Africa IoT in Manufacturing Industry Revenue (Million), by Connectivity 2025 & 2033
- Figure 53: Middle East and Africa IoT in Manufacturing Industry Revenue Share (%), by Connectivity 2025 & 2033
- Figure 54: Middle East and Africa IoT in Manufacturing Industry Revenue (Million), by Services 2025 & 2033
- Figure 55: Middle East and Africa IoT in Manufacturing Industry Revenue Share (%), by Services 2025 & 2033
- Figure 56: Middle East and Africa IoT in Manufacturing Industry Revenue (Million), by Application 2025 & 2033
- Figure 57: Middle East and Africa IoT in Manufacturing Industry Revenue Share (%), by Application 2025 & 2033
- Figure 58: Middle East and Africa IoT in Manufacturing Industry Revenue (Million), by End-user Vertical 2025 & 2033
- Figure 59: Middle East and Africa IoT in Manufacturing Industry Revenue Share (%), by End-user Vertical 2025 & 2033
- Figure 60: Middle East and Africa IoT in Manufacturing Industry Revenue (Million), by Country 2025 & 2033
- Figure 61: Middle East and Africa IoT in Manufacturing Industry Revenue Share (%), by Country 2025 & 2033
List of Tables
- Table 1: Global IoT in Manufacturing Industry Revenue Million Forecast, by Software 2020 & 2033
- Table 2: Global IoT in Manufacturing Industry Revenue Million Forecast, by Connectivity 2020 & 2033
- Table 3: Global IoT in Manufacturing Industry Revenue Million Forecast, by Services 2020 & 2033
- Table 4: Global IoT in Manufacturing Industry Revenue Million Forecast, by Application 2020 & 2033
- Table 5: Global IoT in Manufacturing Industry Revenue Million Forecast, by End-user Vertical 2020 & 2033
- Table 6: Global IoT in Manufacturing Industry Revenue Million Forecast, by Region 2020 & 2033
- Table 7: Global IoT in Manufacturing Industry Revenue Million Forecast, by Software 2020 & 2033
- Table 8: Global IoT in Manufacturing Industry Revenue Million Forecast, by Connectivity 2020 & 2033
- Table 9: Global IoT in Manufacturing Industry Revenue Million Forecast, by Services 2020 & 2033
- Table 10: Global IoT in Manufacturing Industry Revenue Million Forecast, by Application 2020 & 2033
- Table 11: Global IoT in Manufacturing Industry Revenue Million Forecast, by End-user Vertical 2020 & 2033
- Table 12: Global IoT in Manufacturing Industry Revenue Million Forecast, by Country 2020 & 2033
- Table 13: United States IoT in Manufacturing Industry Revenue (Million) Forecast, by Application 2020 & 2033
- Table 14: Canada IoT in Manufacturing Industry Revenue (Million) Forecast, by Application 2020 & 2033
- Table 15: Global IoT in Manufacturing Industry Revenue Million Forecast, by Software 2020 & 2033
- Table 16: Global IoT in Manufacturing Industry Revenue Million Forecast, by Connectivity 2020 & 2033
- Table 17: Global IoT in Manufacturing Industry Revenue Million Forecast, by Services 2020 & 2033
- Table 18: Global IoT in Manufacturing Industry Revenue Million Forecast, by Application 2020 & 2033
- Table 19: Global IoT in Manufacturing Industry Revenue Million Forecast, by End-user Vertical 2020 & 2033
- Table 20: Global IoT in Manufacturing Industry Revenue Million Forecast, by Country 2020 & 2033
- Table 21: Germany IoT in Manufacturing Industry Revenue (Million) Forecast, by Application 2020 & 2033
- Table 22: United Kingdom IoT in Manufacturing Industry Revenue (Million) Forecast, by Application 2020 & 2033
- Table 23: France IoT in Manufacturing Industry Revenue (Million) Forecast, by Application 2020 & 2033
- Table 24: Spain IoT in Manufacturing Industry Revenue (Million) Forecast, by Application 2020 & 2033
- Table 25: Global IoT in Manufacturing Industry Revenue Million Forecast, by Software 2020 & 2033
- Table 26: Global IoT in Manufacturing Industry Revenue Million Forecast, by Connectivity 2020 & 2033
- Table 27: Global IoT in Manufacturing Industry Revenue Million Forecast, by Services 2020 & 2033
- Table 28: Global IoT in Manufacturing Industry Revenue Million Forecast, by Application 2020 & 2033
- Table 29: Global IoT in Manufacturing Industry Revenue Million Forecast, by End-user Vertical 2020 & 2033
- Table 30: Global IoT in Manufacturing Industry Revenue Million Forecast, by Country 2020 & 2033
- Table 31: China IoT in Manufacturing Industry Revenue (Million) Forecast, by Application 2020 & 2033
- Table 32: Japan IoT in Manufacturing Industry Revenue (Million) Forecast, by Application 2020 & 2033
- Table 33: India IoT in Manufacturing Industry Revenue (Million) Forecast, by Application 2020 & 2033
- Table 34: Australia and New Zealand IoT in Manufacturing Industry Revenue (Million) Forecast, by Application 2020 & 2033
- Table 35: Global IoT in Manufacturing Industry Revenue Million Forecast, by Software 2020 & 2033
- Table 36: Global IoT in Manufacturing Industry Revenue Million Forecast, by Connectivity 2020 & 2033
- Table 37: Global IoT in Manufacturing Industry Revenue Million Forecast, by Services 2020 & 2033
- Table 38: Global IoT in Manufacturing Industry Revenue Million Forecast, by Application 2020 & 2033
- Table 39: Global IoT in Manufacturing Industry Revenue Million Forecast, by End-user Vertical 2020 & 2033
- Table 40: Global IoT in Manufacturing Industry Revenue Million Forecast, by Country 2020 & 2033
- Table 41: Brazil IoT in Manufacturing Industry Revenue (Million) Forecast, by Application 2020 & 2033
- Table 42: Mexico IoT in Manufacturing Industry Revenue (Million) Forecast, by Application 2020 & 2033
- Table 43: Argentina IoT in Manufacturing Industry Revenue (Million) Forecast, by Application 2020 & 2033
- Table 44: Global IoT in Manufacturing Industry Revenue Million Forecast, by Software 2020 & 2033
- Table 45: Global IoT in Manufacturing Industry Revenue Million Forecast, by Connectivity 2020 & 2033
- Table 46: Global IoT in Manufacturing Industry Revenue Million Forecast, by Services 2020 & 2033
- Table 47: Global IoT in Manufacturing Industry Revenue Million Forecast, by Application 2020 & 2033
- Table 48: Global IoT in Manufacturing Industry Revenue Million Forecast, by End-user Vertical 2020 & 2033
- Table 49: Global IoT in Manufacturing Industry Revenue Million Forecast, by Country 2020 & 2033
- Table 50: United Arab Emirates IoT in Manufacturing Industry Revenue (Million) Forecast, by Application 2020 & 2033
- Table 51: Saudi Arabia IoT in Manufacturing Industry Revenue (Million) Forecast, by Application 2020 & 2033
- Table 52: South Africa IoT in Manufacturing Industry Revenue (Million) Forecast, by Application 2020 & 2033
Frequently Asked Questions
1. What is the projected Compound Annual Growth Rate (CAGR) of the IoT in Manufacturing Industry?
The projected CAGR is approximately 25.33%.
2. Which companies are prominent players in the IoT in Manufacturing Industry?
Key companies in the market include SAP S, General Electric, Verizon Communication Inc, IBM Corporation, Cisco Systems Inc, Siemens AG, Microsoft Corporation, Qualcomm, AT&T Inc, Intel Corporation.
3. What are the main segments of the IoT in Manufacturing Industry?
The market segments include Software, Connectivity, Services, Application , End-user Vertical.
4. Can you provide details about the market size?
The market size is estimated to be USD 0.39 Million as of 2022.
5. What are some drivers contributing to market growth?
Rapid Growth and Technological Advancements in Data Analytics; Improved Supply Chain Management and Logistics at Lower Operational Costs.
6. What are the notable trends driving market growth?
Supply Chain and Logistics Management Application to Spur Growth in the Market Studied.
7. Are there any restraints impacting market growth?
Lack of Standardized Interfaces and Limited Integration and Scalability; Security and Privacy Issues.
8. Can you provide examples of recent developments in the market?
August 2022: Intel Corporation and Check Point Software Technologies have started a new partnership. As a result of the cooperation, Intel's new platform for the Internet of Things (IoT) device developers, Intel Pathfinder for RISC-V, would now include Check Point's Quantum IoT Protect. IoT device manufacturers could implement cutting-edge security at the beginning of the product life cycle by enabling the Check Point software within the platform.
9. What pricing options are available for accessing the report?
Pricing options include single-user, multi-user, and enterprise licenses priced at USD 4750, USD 5250, and USD 8750 respectively.
10. Is the market size provided in terms of value or volume?
The market size is provided in terms of value, measured in Million.
11. Are there any specific market keywords associated with the report?
Yes, the market keyword associated with the report is "IoT in Manufacturing Industry," which aids in identifying and referencing the specific market segment covered.
12. How do I determine which pricing option suits my needs best?
The pricing options vary based on user requirements and access needs. Individual users may opt for single-user licenses, while businesses requiring broader access may choose multi-user or enterprise licenses for cost-effective access to the report.
13. Are there any additional resources or data provided in the IoT in Manufacturing Industry report?
While the report offers comprehensive insights, it's advisable to review the specific contents or supplementary materials provided to ascertain if additional resources or data are available.
14. How can I stay updated on further developments or reports in the IoT in Manufacturing Industry?
To stay informed about further developments, trends, and reports in the IoT in Manufacturing Industry, consider subscribing to industry newsletters, following relevant companies and organizations, or regularly checking reputable industry news sources and publications.
Methodology
Step 1 - Identification of Relevant Samples Size from Population Database


Step 2 - Approaches for Defining Global Market Size (Value, Volume* & Price*)

Note*: In applicable scenarios
Step 3 - Data Sources
Primary Research
- Web Analytics
- Survey Reports
- Research Institute
- Latest Research Reports
- Opinion Leaders
Secondary Research
- Annual Reports
- White Paper
- Latest Press Release
- Industry Association
- Paid Database
- Investor Presentations

Step 4 - Data Triangulation
Involves using different sources of information in order to increase the validity of a study
These sources are likely to be stakeholders in a program - participants, other researchers, program staff, other community members, and so on.
Then we put all data in single framework & apply various statistical tools to find out the dynamic on the market.
During the analysis stage, feedback from the stakeholder groups would be compared to determine areas of agreement as well as areas of divergence