

Key Insights
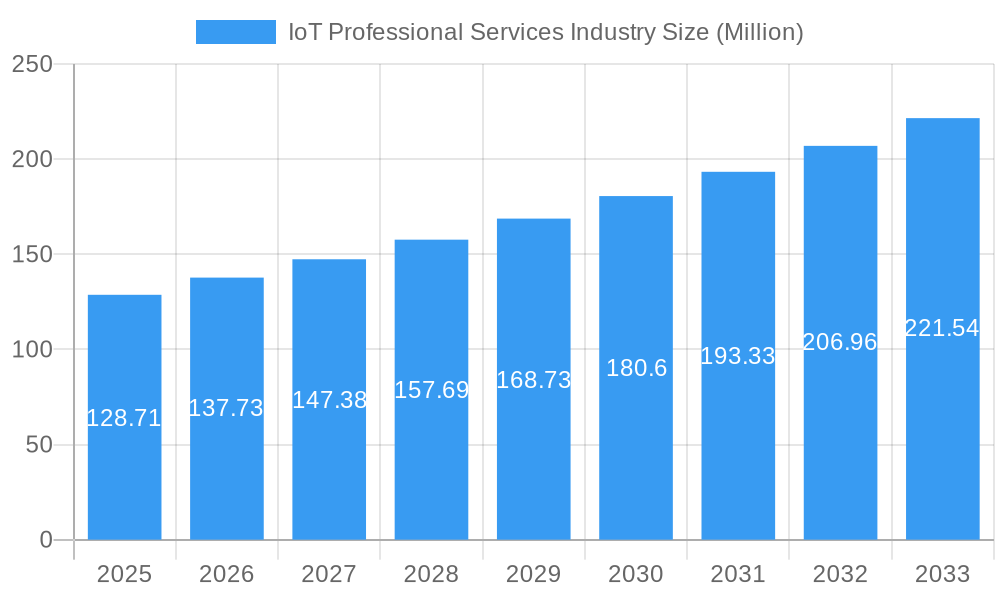
The IoT Professional Services market, valued at $128.71 million in 2025, is poised for robust growth, exhibiting a Compound Annual Growth Rate (CAGR) of 7.01% from 2025 to 2033. This expansion is fueled by several key drivers. The increasing adoption of IoT technologies across diverse sectors like manufacturing, healthcare, and transportation necessitates specialized services for implementation, integration, and maintenance. The complexity of IoT deployments, requiring expertise in network security, data analytics, and cloud integration, further drives demand for professional services. Furthermore, the growing need for skilled professionals to manage and optimize IoT systems contributes significantly to market growth. While the initial investment in IoT infrastructure can be a restraint for some smaller businesses, the long-term benefits in terms of efficiency and cost savings are outweighing this initial barrier. The market is segmented by service type (consulting, infrastructure, design, support, training), organization size (SMEs, large enterprises), deployment type (cloud, on-premises), and end-user industry. North America currently holds a significant market share, driven by early adoption and technological advancements, but the Asia-Pacific region is expected to witness rapid growth in the coming years due to increasing digitalization and government initiatives promoting IoT adoption. The competitive landscape is marked by a mix of established IT giants like IBM and Accenture, and specialized IoT solution providers, indicating a dynamic and evolving market structure.
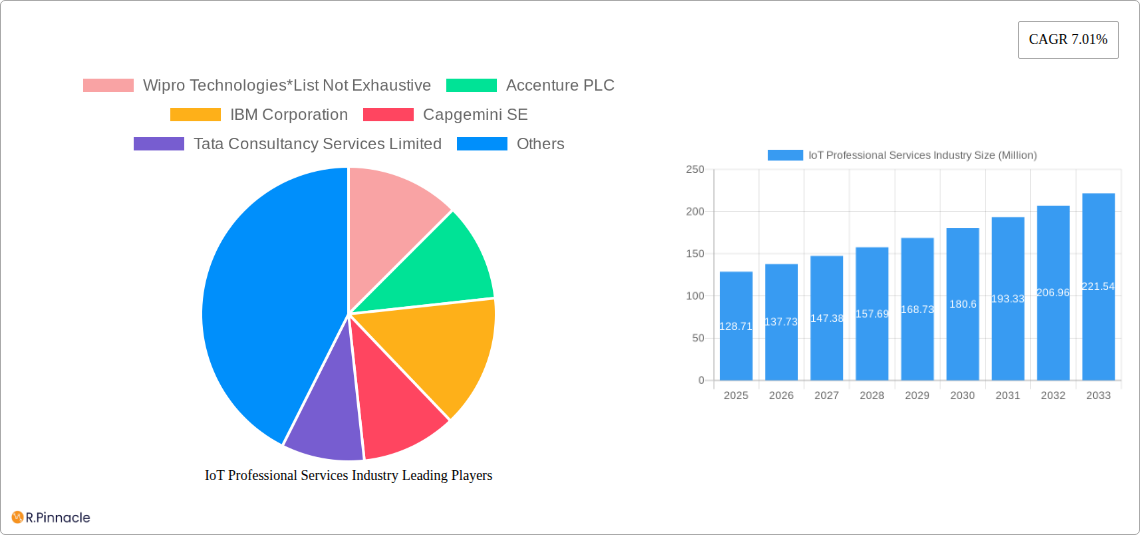
IoT Professional Services Industry Market Size (In Million)
The projected growth trajectory suggests a considerable market expansion throughout the forecast period. The consistent CAGR reflects the sustained demand for IoT expertise across various industries and geographical regions. While cloud-based deployments are expected to dominate, on-premises solutions will continue to hold a significant share, particularly in sectors prioritizing data security and regulatory compliance. The continuous evolution of IoT technologies and the emergence of new applications will further stimulate demand for specialized services, creating opportunities for both established players and emerging companies in the market. The focus on skills development and training programs will also play a crucial role in supporting the market's sustained expansion by ensuring a skilled workforce to support the increasingly complex IoT ecosystem.
IoT Professional Services Industry Company Market Share
IoT Professional Services Industry Report: A Comprehensive Analysis (2019-2033)
This in-depth report provides a comprehensive analysis of the IoT Professional Services industry, offering invaluable insights for industry professionals, investors, and strategists. With a forecast period spanning 2025-2033 and a base year of 2025, this report leverages extensive market data from 2019-2024 to provide actionable intelligence on market size (projected to reach xx Million by 2033), growth drivers, and emerging opportunities within this dynamic sector.
IoT Professional Services Industry Market Structure & Innovation Trends
The IoT Professional Services market is characterized by a moderately concentrated landscape with key players like Wipro Technologies, Accenture PLC, IBM Corporation, Capgemini SE, and Tata Consultancy Services Limited holding significant market share. Precise market share data for each player is unavailable but estimations based on publicly available information suggest Wipro Technologies and Accenture PLC hold the largest shares, exceeding 10% individually in 2025. The industry exhibits strong innovation drivers, fueled by advancements in AI, machine learning, and 5G technologies. Regulatory frameworks, particularly those concerning data privacy and security (like GDPR and CCPA), significantly influence market dynamics. Product substitutes, such as legacy IT services, face increasing competition due to the efficiency and scalability advantages offered by IoT solutions. The end-user demographics are diverse, spanning across SMEs and large enterprises in various industries. M&A activity has been significant, with deals such as KORE Group's acquisition of Twilio's IoT business (March 2023) indicating consolidation trends and a valuation exceeding xx Million. Other notable M&A activities have contributed to market restructuring, though precise deal values are not publicly accessible for all transactions.
- Key Market Players: Wipro Technologies, Accenture PLC, IBM Corporation, Capgemini SE, Tata Consultancy Services Limited, DXC Technology Company, Virtusa Corporation, Atos SE, Oracle Corporation, General Electric Company, AT&T Inc, Cognizant Technology Solutions Corporation (list not exhaustive).
- Market Concentration: Moderately concentrated, with top players commanding significant, though currently unquantifiable, market share.
- M&A Activity: Significant activity observed, with deal values exceeding xx Million in some cases.
IoT Professional Services Industry Market Dynamics & Trends
The IoT Professional Services market is experiencing robust growth, driven by increasing adoption of IoT technologies across diverse sectors. The compound annual growth rate (CAGR) is projected to be xx% during the forecast period (2025-2033), fueled by factors like the increasing digitalization of businesses and the growing demand for smart solutions. Technological disruptions, such as the emergence of edge computing and advancements in low-power wide-area networks (LPWAN), are reshaping the competitive landscape. Consumer preferences are shifting towards integrated, secure, and scalable IoT solutions, leading to a demand for specialized professional services. Competitive dynamics are intense, with companies focusing on differentiation through specialized expertise, strategic partnerships, and innovative service offerings. Market penetration remains high among large enterprises, but growth potential is significant within the SME sector.
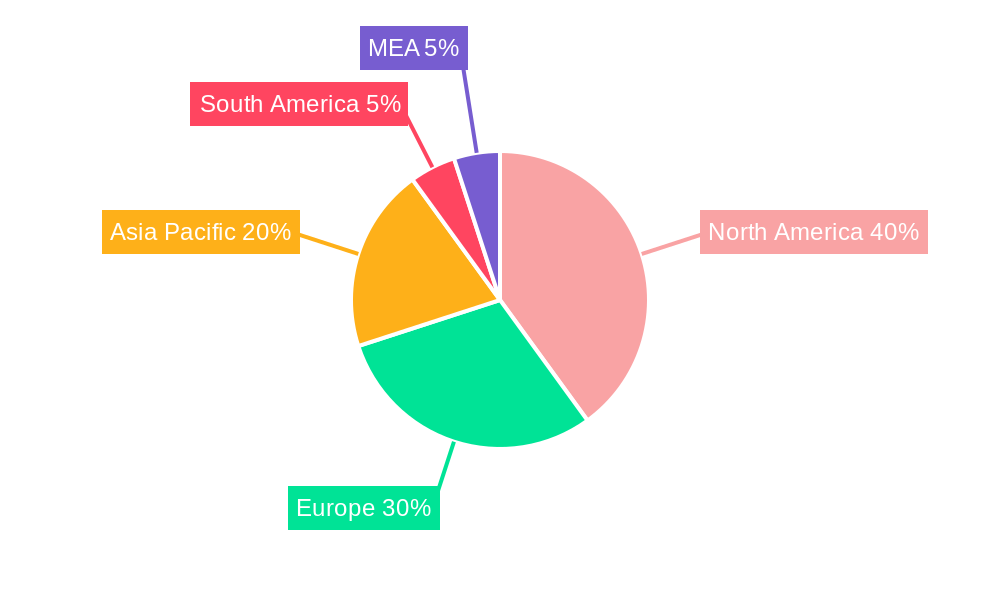
Dominant Regions & Segments in IoT Professional Services Industry
North America is currently the dominant region for IoT professional services, fueled by high technological adoption and a robust IT infrastructure. However, Asia-Pacific is expected to witness significant growth in the coming years due to rapid industrialization and expanding digital economy.
- By Service Type: IoT Consulting currently dominates, followed closely by System Designing and Integration. Support and Maintenance is experiencing substantial growth.
- By Organization Size: Large enterprises constitute the largest segment but SMEs are displaying a rapidly accelerating adoption rate.
- By Deployment Type: Cloud-based deployments are gaining popularity due to their scalability and cost-effectiveness.
- By End-user Industry: Manufacturing, Healthcare, and Transportation and Logistics represent significant market segments, driven by unique IoT application requirements within each sector.
Key drivers for regional dominance include favorable economic policies, supportive government regulations, and robust IT infrastructure.
IoT Professional Services Industry Product Innovations
Recent product innovations focus on developing integrated platforms that combine consulting, system design, implementation, and ongoing support. The emphasis is on offering comprehensive, end-to-end solutions tailored to specific industry requirements. This includes the rise of AI-powered IoT platforms for predictive maintenance, advanced analytics for improved operational efficiency, and secure, scalable cloud-based solutions. The competitive advantages lie in offering a strong combination of technical expertise, domain knowledge, and scalable, secure solutions that meet the demands of diverse industries.
Report Scope & Segmentation Analysis
This report comprehensively covers the IoT professional services market, segmented by service type (IoT Consulting, IoT Infrastructure, System Designing and Integration, Support and Maintenance, Education and Training), organization size (SMEs, Large Enterprises), deployment type (Cloud-based, On-premises), and end-user industry (Manufacturing, Retail, Healthcare, Energy and Utilities, Transportation and Logistics, Other End-user Industries). Each segment is analyzed in terms of market size, growth projections, and competitive dynamics. The overall market is expected to grow significantly in the forecast period, with cloud-based deployments and large enterprises driving a major portion of this growth.
Key Drivers of IoT Professional Services Industry Growth
Several factors contribute to the growth of the IoT professional services market. Advancements in IoT technologies (e.g., low-power wide-area networks, edge computing) are enabling new applications and business models. Favorable government policies and regulatory frameworks promoting digital transformation and IoT adoption are further accelerating market expansion. Finally, the increasing demand for data-driven insights and operational efficiencies across various industries is fueling this growth.
Challenges in the IoT Professional Services Industry Sector
Key challenges include the complexities of integrating diverse IoT devices and systems, ensuring data security and privacy, managing the supply chain, and the high cost of implementation. Competition is intense, requiring companies to offer differentiated value propositions and stay ahead of rapid technological advancements. Regulatory hurdles related to data compliance and cybersecurity standards pose ongoing challenges for providers.
Emerging Opportunities in IoT Professional Services Industry
The industry is witnessing a surge of opportunities in areas such as AI-powered IoT solutions, edge computing, and industrial IoT applications. New markets are opening in sectors like smart cities, smart agriculture, and connected healthcare. The increasing demand for cybersecurity services and data analytics further present substantial growth opportunities.
Leading Players in the IoT Professional Services Industry Market
Key Developments in IoT Professional Services Industry
- March 2023: KORE Group Holdings acquired Twilio's IoT business, signifying consolidation and a move towards unified IoT solutions.
- November 2022: Disrupt-X and LORIOT partnered to deploy next-generation IoT solutions in Europe, leveraging LoRaWAN infrastructure.
- February 2022: Astrocast and UnaBiz partnered to develop an end-to-end IoT solution for asset tracking and monitoring using nanosatellite networks.
- February 2022: Boingo Wireless partnered with Qualcomm to streamline IoT device deployment for venue and enterprise customers.
Future Outlook for IoT Professional Services Industry Market
The future of the IoT professional services market is bright, driven by the continued growth of IoT adoption across various sectors and the emergence of new technologies. Strategic partnerships, investments in R&D, and the expansion into new markets will play a pivotal role in shaping the future landscape of this rapidly evolving industry. The market is poised for strong growth, with continued innovation and diversification driving further expansion.
IoT Professional Services Industry Segmentation
-
1. Service Type
- 1.1. IoT Consulting
- 1.2. IoT Infrastructure
- 1.3. System Designing and Integration
- 1.4. Support and Maintenance
- 1.5. Education and Training
-
2. Organization Size
- 2.1. Small and Medium Enterprises (SMEs)
- 2.2. Large Enterprises
-
3. Deployment Type
- 3.1. Cloud-based
- 3.2. On-premises
-
4. End-user Industry
- 4.1. Manufacturing
- 4.2. Retail
- 4.3. Healthcare
- 4.4. Energy and Utilities
- 4.5. Transportation and Logistics
- 4.6. Other End-user Industries
IoT Professional Services Industry Segmentation By Geography
- 1. North America
- 2. Europe
- 3. Asia
- 4. Australia and New Zealand
- 5. Latin America
- 6. Middle East and Africa
IoT Professional Services Industry Regional Market Share
Geographic Coverage of IoT Professional Services Industry
IoT Professional Services Industry REPORT HIGHLIGHTS
| Aspects | Details |
|---|---|
| Study Period | 2020-2034 |
| Base Year | 2025 |
| Estimated Year | 2026 |
| Forecast Period | 2026-2034 |
| Historical Period | 2020-2025 |
| Growth Rate | CAGR of 7.01% from 2020-2034 |
| Segmentation |
|
Table of Contents
- 1. Introduction
- 1.1. Research Scope
- 1.2. Market Segmentation
- 1.3. Research Methodology
- 1.4. Definitions and Assumptions
- 2. Executive Summary
- 2.1. Introduction
- 3. Market Dynamics
- 3.1. Introduction
- 3.2. Market Drivers
- 3.2.1. Proliferation of Connected Devices Across the Globe; Increasing Demand for IoT-enabled Digital Transformation of Enterprises
- 3.3. Market Restrains
- 3.3.1. Concerns Associated With Data Privacy And Security; Lack of Standardized Protocols and Frameworks for IoT Deployments
- 3.4. Market Trends
- 3.4.1. The Proliferation of Connected Devices across the World to Drive the Market Growth
- 4. Market Factor Analysis
- 4.1. Porters Five Forces
- 4.2. Supply/Value Chain
- 4.3. PESTEL analysis
- 4.4. Market Entropy
- 4.5. Patent/Trademark Analysis
- 5. Global IoT Professional Services Industry Analysis, Insights and Forecast, 2020-2032
- 5.1. Market Analysis, Insights and Forecast - by Service Type
- 5.1.1. IoT Consulting
- 5.1.2. IoT Infrastructure
- 5.1.3. System Designing and Integration
- 5.1.4. Support and Maintenance
- 5.1.5. Education and Training
- 5.2. Market Analysis, Insights and Forecast - by Organization Size
- 5.2.1. Small and Medium Enterprises (SMEs)
- 5.2.2. Large Enterprises
- 5.3. Market Analysis, Insights and Forecast - by Deployment Type
- 5.3.1. Cloud-based
- 5.3.2. On-premises
- 5.4. Market Analysis, Insights and Forecast - by End-user Industry
- 5.4.1. Manufacturing
- 5.4.2. Retail
- 5.4.3. Healthcare
- 5.4.4. Energy and Utilities
- 5.4.5. Transportation and Logistics
- 5.4.6. Other End-user Industries
- 5.5. Market Analysis, Insights and Forecast - by Region
- 5.5.1. North America
- 5.5.2. Europe
- 5.5.3. Asia
- 5.5.4. Australia and New Zealand
- 5.5.5. Latin America
- 5.5.6. Middle East and Africa
- 5.1. Market Analysis, Insights and Forecast - by Service Type
- 6. North America IoT Professional Services Industry Analysis, Insights and Forecast, 2020-2032
- 6.1. Market Analysis, Insights and Forecast - by Service Type
- 6.1.1. IoT Consulting
- 6.1.2. IoT Infrastructure
- 6.1.3. System Designing and Integration
- 6.1.4. Support and Maintenance
- 6.1.5. Education and Training
- 6.2. Market Analysis, Insights and Forecast - by Organization Size
- 6.2.1. Small and Medium Enterprises (SMEs)
- 6.2.2. Large Enterprises
- 6.3. Market Analysis, Insights and Forecast - by Deployment Type
- 6.3.1. Cloud-based
- 6.3.2. On-premises
- 6.4. Market Analysis, Insights and Forecast - by End-user Industry
- 6.4.1. Manufacturing
- 6.4.2. Retail
- 6.4.3. Healthcare
- 6.4.4. Energy and Utilities
- 6.4.5. Transportation and Logistics
- 6.4.6. Other End-user Industries
- 6.1. Market Analysis, Insights and Forecast - by Service Type
- 7. Europe IoT Professional Services Industry Analysis, Insights and Forecast, 2020-2032
- 7.1. Market Analysis, Insights and Forecast - by Service Type
- 7.1.1. IoT Consulting
- 7.1.2. IoT Infrastructure
- 7.1.3. System Designing and Integration
- 7.1.4. Support and Maintenance
- 7.1.5. Education and Training
- 7.2. Market Analysis, Insights and Forecast - by Organization Size
- 7.2.1. Small and Medium Enterprises (SMEs)
- 7.2.2. Large Enterprises
- 7.3. Market Analysis, Insights and Forecast - by Deployment Type
- 7.3.1. Cloud-based
- 7.3.2. On-premises
- 7.4. Market Analysis, Insights and Forecast - by End-user Industry
- 7.4.1. Manufacturing
- 7.4.2. Retail
- 7.4.3. Healthcare
- 7.4.4. Energy and Utilities
- 7.4.5. Transportation and Logistics
- 7.4.6. Other End-user Industries
- 7.1. Market Analysis, Insights and Forecast - by Service Type
- 8. Asia IoT Professional Services Industry Analysis, Insights and Forecast, 2020-2032
- 8.1. Market Analysis, Insights and Forecast - by Service Type
- 8.1.1. IoT Consulting
- 8.1.2. IoT Infrastructure
- 8.1.3. System Designing and Integration
- 8.1.4. Support and Maintenance
- 8.1.5. Education and Training
- 8.2. Market Analysis, Insights and Forecast - by Organization Size
- 8.2.1. Small and Medium Enterprises (SMEs)
- 8.2.2. Large Enterprises
- 8.3. Market Analysis, Insights and Forecast - by Deployment Type
- 8.3.1. Cloud-based
- 8.3.2. On-premises
- 8.4. Market Analysis, Insights and Forecast - by End-user Industry
- 8.4.1. Manufacturing
- 8.4.2. Retail
- 8.4.3. Healthcare
- 8.4.4. Energy and Utilities
- 8.4.5. Transportation and Logistics
- 8.4.6. Other End-user Industries
- 8.1. Market Analysis, Insights and Forecast - by Service Type
- 9. Australia and New Zealand IoT Professional Services Industry Analysis, Insights and Forecast, 2020-2032
- 9.1. Market Analysis, Insights and Forecast - by Service Type
- 9.1.1. IoT Consulting
- 9.1.2. IoT Infrastructure
- 9.1.3. System Designing and Integration
- 9.1.4. Support and Maintenance
- 9.1.5. Education and Training
- 9.2. Market Analysis, Insights and Forecast - by Organization Size
- 9.2.1. Small and Medium Enterprises (SMEs)
- 9.2.2. Large Enterprises
- 9.3. Market Analysis, Insights and Forecast - by Deployment Type
- 9.3.1. Cloud-based
- 9.3.2. On-premises
- 9.4. Market Analysis, Insights and Forecast - by End-user Industry
- 9.4.1. Manufacturing
- 9.4.2. Retail
- 9.4.3. Healthcare
- 9.4.4. Energy and Utilities
- 9.4.5. Transportation and Logistics
- 9.4.6. Other End-user Industries
- 9.1. Market Analysis, Insights and Forecast - by Service Type
- 10. Latin America IoT Professional Services Industry Analysis, Insights and Forecast, 2020-2032
- 10.1. Market Analysis, Insights and Forecast - by Service Type
- 10.1.1. IoT Consulting
- 10.1.2. IoT Infrastructure
- 10.1.3. System Designing and Integration
- 10.1.4. Support and Maintenance
- 10.1.5. Education and Training
- 10.2. Market Analysis, Insights and Forecast - by Organization Size
- 10.2.1. Small and Medium Enterprises (SMEs)
- 10.2.2. Large Enterprises
- 10.3. Market Analysis, Insights and Forecast - by Deployment Type
- 10.3.1. Cloud-based
- 10.3.2. On-premises
- 10.4. Market Analysis, Insights and Forecast - by End-user Industry
- 10.4.1. Manufacturing
- 10.4.2. Retail
- 10.4.3. Healthcare
- 10.4.4. Energy and Utilities
- 10.4.5. Transportation and Logistics
- 10.4.6. Other End-user Industries
- 10.1. Market Analysis, Insights and Forecast - by Service Type
- 11. Middle East and Africa IoT Professional Services Industry Analysis, Insights and Forecast, 2020-2032
- 11.1. Market Analysis, Insights and Forecast - by Service Type
- 11.1.1. IoT Consulting
- 11.1.2. IoT Infrastructure
- 11.1.3. System Designing and Integration
- 11.1.4. Support and Maintenance
- 11.1.5. Education and Training
- 11.2. Market Analysis, Insights and Forecast - by Organization Size
- 11.2.1. Small and Medium Enterprises (SMEs)
- 11.2.2. Large Enterprises
- 11.3. Market Analysis, Insights and Forecast - by Deployment Type
- 11.3.1. Cloud-based
- 11.3.2. On-premises
- 11.4. Market Analysis, Insights and Forecast - by End-user Industry
- 11.4.1. Manufacturing
- 11.4.2. Retail
- 11.4.3. Healthcare
- 11.4.4. Energy and Utilities
- 11.4.5. Transportation and Logistics
- 11.4.6. Other End-user Industries
- 11.1. Market Analysis, Insights and Forecast - by Service Type
- 12. Competitive Analysis
- 12.1. Global Market Share Analysis 2025
- 12.2. Company Profiles
- 12.2.1 Wipro Technologies*List Not Exhaustive
- 12.2.1.1. Overview
- 12.2.1.2. Products
- 12.2.1.3. SWOT Analysis
- 12.2.1.4. Recent Developments
- 12.2.1.5. Financials (Based on Availability)
- 12.2.2 Accenture PLC
- 12.2.2.1. Overview
- 12.2.2.2. Products
- 12.2.2.3. SWOT Analysis
- 12.2.2.4. Recent Developments
- 12.2.2.5. Financials (Based on Availability)
- 12.2.3 IBM Corporation
- 12.2.3.1. Overview
- 12.2.3.2. Products
- 12.2.3.3. SWOT Analysis
- 12.2.3.4. Recent Developments
- 12.2.3.5. Financials (Based on Availability)
- 12.2.4 Capgemini SE
- 12.2.4.1. Overview
- 12.2.4.2. Products
- 12.2.4.3. SWOT Analysis
- 12.2.4.4. Recent Developments
- 12.2.4.5. Financials (Based on Availability)
- 12.2.5 Tata Consultancy Services Limited
- 12.2.5.1. Overview
- 12.2.5.2. Products
- 12.2.5.3. SWOT Analysis
- 12.2.5.4. Recent Developments
- 12.2.5.5. Financials (Based on Availability)
- 12.2.6 DXC Technology Company
- 12.2.6.1. Overview
- 12.2.6.2. Products
- 12.2.6.3. SWOT Analysis
- 12.2.6.4. Recent Developments
- 12.2.6.5. Financials (Based on Availability)
- 12.2.7 Virtusa Corporation
- 12.2.7.1. Overview
- 12.2.7.2. Products
- 12.2.7.3. SWOT Analysis
- 12.2.7.4. Recent Developments
- 12.2.7.5. Financials (Based on Availability)
- 12.2.8 Atos SE
- 12.2.8.1. Overview
- 12.2.8.2. Products
- 12.2.8.3. SWOT Analysis
- 12.2.8.4. Recent Developments
- 12.2.8.5. Financials (Based on Availability)
- 12.2.9 Oracle Corporation
- 12.2.9.1. Overview
- 12.2.9.2. Products
- 12.2.9.3. SWOT Analysis
- 12.2.9.4. Recent Developments
- 12.2.9.5. Financials (Based on Availability)
- 12.2.10 General Electric Company
- 12.2.10.1. Overview
- 12.2.10.2. Products
- 12.2.10.3. SWOT Analysis
- 12.2.10.4. Recent Developments
- 12.2.10.5. Financials (Based on Availability)
- 12.2.11 AT&T Inc
- 12.2.11.1. Overview
- 12.2.11.2. Products
- 12.2.11.3. SWOT Analysis
- 12.2.11.4. Recent Developments
- 12.2.11.5. Financials (Based on Availability)
- 12.2.12 Cognizant Technology Solutions Corporation
- 12.2.12.1. Overview
- 12.2.12.2. Products
- 12.2.12.3. SWOT Analysis
- 12.2.12.4. Recent Developments
- 12.2.12.5. Financials (Based on Availability)
- 12.2.1 Wipro Technologies*List Not Exhaustive
List of Figures
- Figure 1: Global IoT Professional Services Industry Revenue Breakdown (Million, %) by Region 2025 & 2033
- Figure 2: North America IoT Professional Services Industry Revenue (Million), by Service Type 2025 & 2033
- Figure 3: North America IoT Professional Services Industry Revenue Share (%), by Service Type 2025 & 2033
- Figure 4: North America IoT Professional Services Industry Revenue (Million), by Organization Size 2025 & 2033
- Figure 5: North America IoT Professional Services Industry Revenue Share (%), by Organization Size 2025 & 2033
- Figure 6: North America IoT Professional Services Industry Revenue (Million), by Deployment Type 2025 & 2033
- Figure 7: North America IoT Professional Services Industry Revenue Share (%), by Deployment Type 2025 & 2033
- Figure 8: North America IoT Professional Services Industry Revenue (Million), by End-user Industry 2025 & 2033
- Figure 9: North America IoT Professional Services Industry Revenue Share (%), by End-user Industry 2025 & 2033
- Figure 10: North America IoT Professional Services Industry Revenue (Million), by Country 2025 & 2033
- Figure 11: North America IoT Professional Services Industry Revenue Share (%), by Country 2025 & 2033
- Figure 12: Europe IoT Professional Services Industry Revenue (Million), by Service Type 2025 & 2033
- Figure 13: Europe IoT Professional Services Industry Revenue Share (%), by Service Type 2025 & 2033
- Figure 14: Europe IoT Professional Services Industry Revenue (Million), by Organization Size 2025 & 2033
- Figure 15: Europe IoT Professional Services Industry Revenue Share (%), by Organization Size 2025 & 2033
- Figure 16: Europe IoT Professional Services Industry Revenue (Million), by Deployment Type 2025 & 2033
- Figure 17: Europe IoT Professional Services Industry Revenue Share (%), by Deployment Type 2025 & 2033
- Figure 18: Europe IoT Professional Services Industry Revenue (Million), by End-user Industry 2025 & 2033
- Figure 19: Europe IoT Professional Services Industry Revenue Share (%), by End-user Industry 2025 & 2033
- Figure 20: Europe IoT Professional Services Industry Revenue (Million), by Country 2025 & 2033
- Figure 21: Europe IoT Professional Services Industry Revenue Share (%), by Country 2025 & 2033
- Figure 22: Asia IoT Professional Services Industry Revenue (Million), by Service Type 2025 & 2033
- Figure 23: Asia IoT Professional Services Industry Revenue Share (%), by Service Type 2025 & 2033
- Figure 24: Asia IoT Professional Services Industry Revenue (Million), by Organization Size 2025 & 2033
- Figure 25: Asia IoT Professional Services Industry Revenue Share (%), by Organization Size 2025 & 2033
- Figure 26: Asia IoT Professional Services Industry Revenue (Million), by Deployment Type 2025 & 2033
- Figure 27: Asia IoT Professional Services Industry Revenue Share (%), by Deployment Type 2025 & 2033
- Figure 28: Asia IoT Professional Services Industry Revenue (Million), by End-user Industry 2025 & 2033
- Figure 29: Asia IoT Professional Services Industry Revenue Share (%), by End-user Industry 2025 & 2033
- Figure 30: Asia IoT Professional Services Industry Revenue (Million), by Country 2025 & 2033
- Figure 31: Asia IoT Professional Services Industry Revenue Share (%), by Country 2025 & 2033
- Figure 32: Australia and New Zealand IoT Professional Services Industry Revenue (Million), by Service Type 2025 & 2033
- Figure 33: Australia and New Zealand IoT Professional Services Industry Revenue Share (%), by Service Type 2025 & 2033
- Figure 34: Australia and New Zealand IoT Professional Services Industry Revenue (Million), by Organization Size 2025 & 2033
- Figure 35: Australia and New Zealand IoT Professional Services Industry Revenue Share (%), by Organization Size 2025 & 2033
- Figure 36: Australia and New Zealand IoT Professional Services Industry Revenue (Million), by Deployment Type 2025 & 2033
- Figure 37: Australia and New Zealand IoT Professional Services Industry Revenue Share (%), by Deployment Type 2025 & 2033
- Figure 38: Australia and New Zealand IoT Professional Services Industry Revenue (Million), by End-user Industry 2025 & 2033
- Figure 39: Australia and New Zealand IoT Professional Services Industry Revenue Share (%), by End-user Industry 2025 & 2033
- Figure 40: Australia and New Zealand IoT Professional Services Industry Revenue (Million), by Country 2025 & 2033
- Figure 41: Australia and New Zealand IoT Professional Services Industry Revenue Share (%), by Country 2025 & 2033
- Figure 42: Latin America IoT Professional Services Industry Revenue (Million), by Service Type 2025 & 2033
- Figure 43: Latin America IoT Professional Services Industry Revenue Share (%), by Service Type 2025 & 2033
- Figure 44: Latin America IoT Professional Services Industry Revenue (Million), by Organization Size 2025 & 2033
- Figure 45: Latin America IoT Professional Services Industry Revenue Share (%), by Organization Size 2025 & 2033
- Figure 46: Latin America IoT Professional Services Industry Revenue (Million), by Deployment Type 2025 & 2033
- Figure 47: Latin America IoT Professional Services Industry Revenue Share (%), by Deployment Type 2025 & 2033
- Figure 48: Latin America IoT Professional Services Industry Revenue (Million), by End-user Industry 2025 & 2033
- Figure 49: Latin America IoT Professional Services Industry Revenue Share (%), by End-user Industry 2025 & 2033
- Figure 50: Latin America IoT Professional Services Industry Revenue (Million), by Country 2025 & 2033
- Figure 51: Latin America IoT Professional Services Industry Revenue Share (%), by Country 2025 & 2033
- Figure 52: Middle East and Africa IoT Professional Services Industry Revenue (Million), by Service Type 2025 & 2033
- Figure 53: Middle East and Africa IoT Professional Services Industry Revenue Share (%), by Service Type 2025 & 2033
- Figure 54: Middle East and Africa IoT Professional Services Industry Revenue (Million), by Organization Size 2025 & 2033
- Figure 55: Middle East and Africa IoT Professional Services Industry Revenue Share (%), by Organization Size 2025 & 2033
- Figure 56: Middle East and Africa IoT Professional Services Industry Revenue (Million), by Deployment Type 2025 & 2033
- Figure 57: Middle East and Africa IoT Professional Services Industry Revenue Share (%), by Deployment Type 2025 & 2033
- Figure 58: Middle East and Africa IoT Professional Services Industry Revenue (Million), by End-user Industry 2025 & 2033
- Figure 59: Middle East and Africa IoT Professional Services Industry Revenue Share (%), by End-user Industry 2025 & 2033
- Figure 60: Middle East and Africa IoT Professional Services Industry Revenue (Million), by Country 2025 & 2033
- Figure 61: Middle East and Africa IoT Professional Services Industry Revenue Share (%), by Country 2025 & 2033
List of Tables
- Table 1: Global IoT Professional Services Industry Revenue Million Forecast, by Service Type 2020 & 2033
- Table 2: Global IoT Professional Services Industry Revenue Million Forecast, by Organization Size 2020 & 2033
- Table 3: Global IoT Professional Services Industry Revenue Million Forecast, by Deployment Type 2020 & 2033
- Table 4: Global IoT Professional Services Industry Revenue Million Forecast, by End-user Industry 2020 & 2033
- Table 5: Global IoT Professional Services Industry Revenue Million Forecast, by Region 2020 & 2033
- Table 6: Global IoT Professional Services Industry Revenue Million Forecast, by Service Type 2020 & 2033
- Table 7: Global IoT Professional Services Industry Revenue Million Forecast, by Organization Size 2020 & 2033
- Table 8: Global IoT Professional Services Industry Revenue Million Forecast, by Deployment Type 2020 & 2033
- Table 9: Global IoT Professional Services Industry Revenue Million Forecast, by End-user Industry 2020 & 2033
- Table 10: Global IoT Professional Services Industry Revenue Million Forecast, by Country 2020 & 2033
- Table 11: Global IoT Professional Services Industry Revenue Million Forecast, by Service Type 2020 & 2033
- Table 12: Global IoT Professional Services Industry Revenue Million Forecast, by Organization Size 2020 & 2033
- Table 13: Global IoT Professional Services Industry Revenue Million Forecast, by Deployment Type 2020 & 2033
- Table 14: Global IoT Professional Services Industry Revenue Million Forecast, by End-user Industry 2020 & 2033
- Table 15: Global IoT Professional Services Industry Revenue Million Forecast, by Country 2020 & 2033
- Table 16: Global IoT Professional Services Industry Revenue Million Forecast, by Service Type 2020 & 2033
- Table 17: Global IoT Professional Services Industry Revenue Million Forecast, by Organization Size 2020 & 2033
- Table 18: Global IoT Professional Services Industry Revenue Million Forecast, by Deployment Type 2020 & 2033
- Table 19: Global IoT Professional Services Industry Revenue Million Forecast, by End-user Industry 2020 & 2033
- Table 20: Global IoT Professional Services Industry Revenue Million Forecast, by Country 2020 & 2033
- Table 21: Global IoT Professional Services Industry Revenue Million Forecast, by Service Type 2020 & 2033
- Table 22: Global IoT Professional Services Industry Revenue Million Forecast, by Organization Size 2020 & 2033
- Table 23: Global IoT Professional Services Industry Revenue Million Forecast, by Deployment Type 2020 & 2033
- Table 24: Global IoT Professional Services Industry Revenue Million Forecast, by End-user Industry 2020 & 2033
- Table 25: Global IoT Professional Services Industry Revenue Million Forecast, by Country 2020 & 2033
- Table 26: Global IoT Professional Services Industry Revenue Million Forecast, by Service Type 2020 & 2033
- Table 27: Global IoT Professional Services Industry Revenue Million Forecast, by Organization Size 2020 & 2033
- Table 28: Global IoT Professional Services Industry Revenue Million Forecast, by Deployment Type 2020 & 2033
- Table 29: Global IoT Professional Services Industry Revenue Million Forecast, by End-user Industry 2020 & 2033
- Table 30: Global IoT Professional Services Industry Revenue Million Forecast, by Country 2020 & 2033
- Table 31: Global IoT Professional Services Industry Revenue Million Forecast, by Service Type 2020 & 2033
- Table 32: Global IoT Professional Services Industry Revenue Million Forecast, by Organization Size 2020 & 2033
- Table 33: Global IoT Professional Services Industry Revenue Million Forecast, by Deployment Type 2020 & 2033
- Table 34: Global IoT Professional Services Industry Revenue Million Forecast, by End-user Industry 2020 & 2033
- Table 35: Global IoT Professional Services Industry Revenue Million Forecast, by Country 2020 & 2033
Frequently Asked Questions
1. What is the projected Compound Annual Growth Rate (CAGR) of the IoT Professional Services Industry?
The projected CAGR is approximately 7.01%.
2. Which companies are prominent players in the IoT Professional Services Industry?
Key companies in the market include Wipro Technologies*List Not Exhaustive, Accenture PLC, IBM Corporation, Capgemini SE, Tata Consultancy Services Limited, DXC Technology Company, Virtusa Corporation, Atos SE, Oracle Corporation, General Electric Company, AT&T Inc, Cognizant Technology Solutions Corporation.
3. What are the main segments of the IoT Professional Services Industry?
The market segments include Service Type, Organization Size, Deployment Type, End-user Industry.
4. Can you provide details about the market size?
The market size is estimated to be USD 128.71 Million as of 2022.
5. What are some drivers contributing to market growth?
Proliferation of Connected Devices Across the Globe; Increasing Demand for IoT-enabled Digital Transformation of Enterprises.
6. What are the notable trends driving market growth?
The Proliferation of Connected Devices across the World to Drive the Market Growth.
7. Are there any restraints impacting market growth?
Concerns Associated With Data Privacy And Security; Lack of Standardized Protocols and Frameworks for IoT Deployments.
8. Can you provide examples of recent developments in the market?
March 2023: KORE Group Holdings, a global player in pure-play IoT solutions and connectivity-as-a-service ("IoT CaaS"), has agreed to purchase Twilio's IoT business division as part of a growth strategy to offer customers a unified, smooth approach to launching IoT solutions.
9. What pricing options are available for accessing the report?
Pricing options include single-user, multi-user, and enterprise licenses priced at USD 4750, USD 5250, and USD 8750 respectively.
10. Is the market size provided in terms of value or volume?
The market size is provided in terms of value, measured in Million.
11. Are there any specific market keywords associated with the report?
Yes, the market keyword associated with the report is "IoT Professional Services Industry," which aids in identifying and referencing the specific market segment covered.
12. How do I determine which pricing option suits my needs best?
The pricing options vary based on user requirements and access needs. Individual users may opt for single-user licenses, while businesses requiring broader access may choose multi-user or enterprise licenses for cost-effective access to the report.
13. Are there any additional resources or data provided in the IoT Professional Services Industry report?
While the report offers comprehensive insights, it's advisable to review the specific contents or supplementary materials provided to ascertain if additional resources or data are available.
14. How can I stay updated on further developments or reports in the IoT Professional Services Industry?
To stay informed about further developments, trends, and reports in the IoT Professional Services Industry, consider subscribing to industry newsletters, following relevant companies and organizations, or regularly checking reputable industry news sources and publications.
Methodology
Step 1 - Identification of Relevant Samples Size from Population Database


Step 2 - Approaches for Defining Global Market Size (Value, Volume* & Price*)

Note*: In applicable scenarios
Step 3 - Data Sources
Primary Research
- Web Analytics
- Survey Reports
- Research Institute
- Latest Research Reports
- Opinion Leaders
Secondary Research
- Annual Reports
- White Paper
- Latest Press Release
- Industry Association
- Paid Database
- Investor Presentations

Step 4 - Data Triangulation
Involves using different sources of information in order to increase the validity of a study
These sources are likely to be stakeholders in a program - participants, other researchers, program staff, other community members, and so on.
Then we put all data in single framework & apply various statistical tools to find out the dynamic on the market.
During the analysis stage, feedback from the stakeholder groups would be compared to determine areas of agreement as well as areas of divergence