

Key Insights
The Isophthalic Acid market, valued at approximately 496.15 million in 2025, is projected for significant expansion at a Compound Annual Growth Rate (CAGR) of 7.3% from 2025 to 2033. Key drivers include escalating demand for polyethylene terephthalate (PET) in food and beverage packaging and the growing construction sector's need for unsaturated polyester resins. Technological advancements enhancing production efficiency and product quality further catalyze market growth. The Asia-Pacific region, particularly China and India, is poised for substantial growth due to rapid industrialization and expanding consumer markets. However, raw material price volatility and environmental regulations present challenges. Intense competition among leading players, including Shell Chemicals LTD, Chevron Phillips Chemical Company, and Honeywell International Inc., fosters innovation and price competitiveness. Market segmentation highlights unsaturated polyester resins as a primary application, with anticipated growth in coatings and specialty polymers. Opportunities lie in sustainable materials and circular economy initiatives, promoting eco-friendly production and product recyclability.
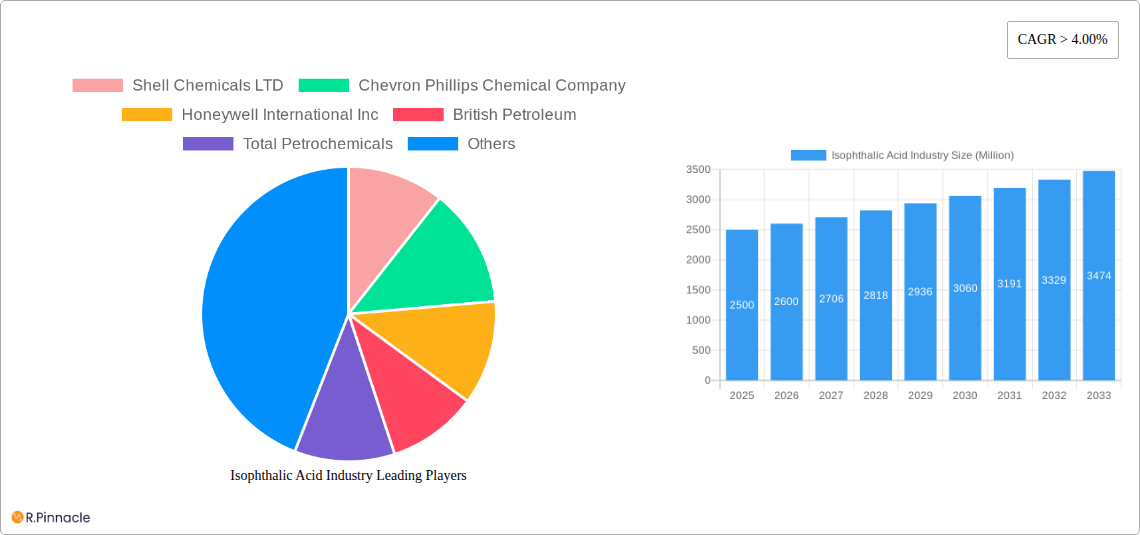
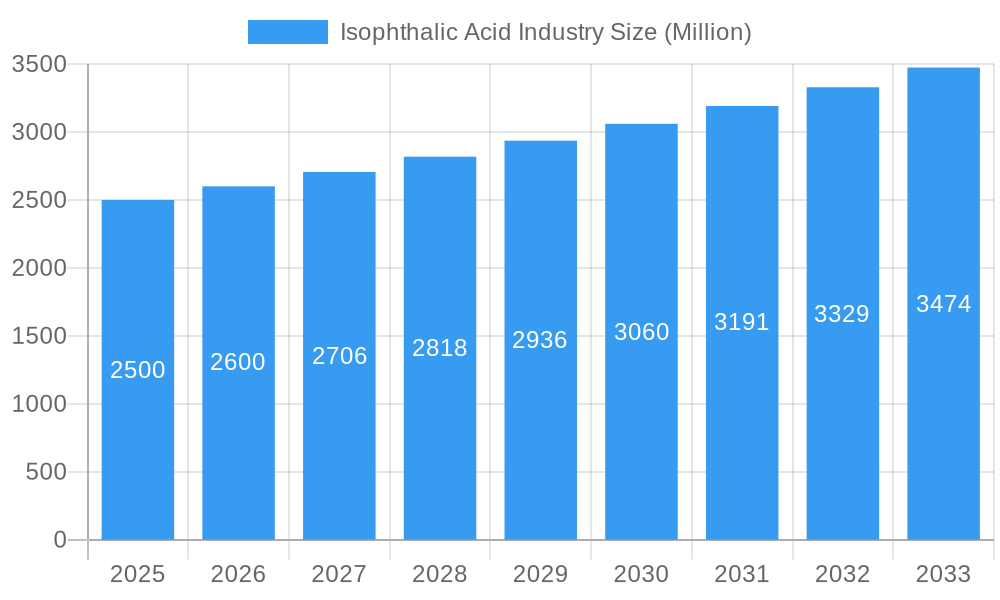
Isophthalic Acid Industry Market Size (In Million)
The forecast period (2025-2033) indicates sustained market expansion, with potential fluctuations influenced by global economic conditions and industry-specific trends. Navigating environmental regulations and investing in research and development are critical for maintaining market leadership. Asia-Pacific is expected to lead regional growth, followed by North America and Europe. Emerging applications in high-performance specialized materials offer significant future market potential. Market participants will likely prioritize diversification, strategic alliances, and vertical integration to strengthen market positions and mitigate risks.
Isophthalic Acid Industry Company Market Share
Isophthalic Acid Industry: A Comprehensive Market Report (2019-2033)
This in-depth report provides a comprehensive analysis of the Isophthalic Acid industry, offering valuable insights for industry professionals, investors, and strategic decision-makers. The study period covers 2019-2033, with 2025 as the base and estimated year. The forecast period spans 2025-2033, and the historical period encompasses 2019-2024. This report leverages extensive primary and secondary research to deliver actionable intelligence on market dynamics, competitive landscape, and future growth opportunities. The global Isophthalic Acid market is projected to reach xx Million by 2033.
Isophthalic Acid Industry Market Structure & Innovation Trends
The Isophthalic Acid market exhibits a moderately concentrated structure, with key players such as Shell Chemicals LTD, Chevron Phillips Chemical Company, and Honeywell International Inc holding significant market share. The combined market share of the top five players is estimated at 45% in 2025. Innovation within the industry is driven by the need for more sustainable production methods and the development of specialized isophthalic acid derivatives for niche applications. Regulatory frameworks, particularly concerning environmental compliance, significantly impact production costs and operational strategies. Product substitutes, primarily other aromatic diacids, pose a competitive challenge, though Isophthalic Acid’s superior properties in certain applications maintain its dominance. End-user demographics are heavily skewed towards the polyester and coatings industries. M&A activity within the sector has been relatively moderate in recent years, with deal values averaging xx Million per transaction during the historical period. Future M&A activity may focus on strengthening supply chains and expanding into new geographical markets.
Isophthalic Acid Industry Market Dynamics & Trends
The Isophthalic Acid market is projected to witness a CAGR of xx% during the forecast period (2025-2033), driven primarily by robust growth in the construction and automotive industries, which are major consumers of polyester resins. Technological disruptions, such as advancements in polymerization techniques and process optimization, are enhancing efficiency and reducing production costs. Growing consumer preference for durable and high-performance materials, particularly in the packaging and textiles sectors, fuels demand. Competitive dynamics are shaped by factors such as pricing strategies, product differentiation, and geographical reach. Market penetration of Isophthalic Acid in emerging economies is expected to increase significantly due to rising infrastructure development and industrialization. The market penetration rate in Asia Pacific is expected to increase from xx% in 2025 to xx% in 2033.
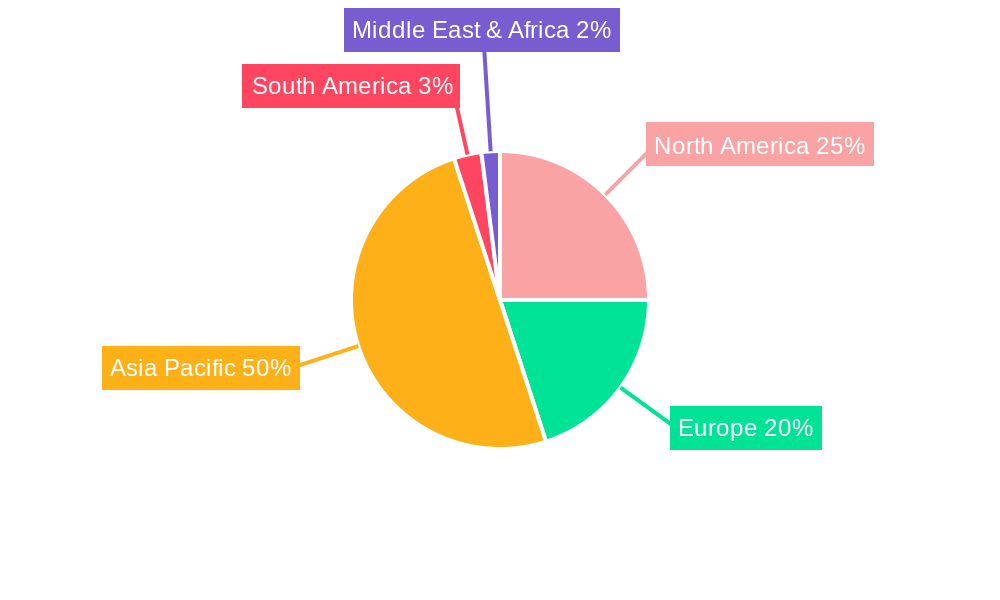
Dominant Regions & Segments in Isophthalic Acid Industry
The Asia-Pacific region is currently the dominant market for Isophthalic Acid, driven by rapid industrialization, increasing construction activities, and expanding automotive production. China and India are key growth drivers within this region.
- Key Drivers in Asia-Pacific:
- Robust infrastructure development
- Expanding automotive industry
- Growing demand for polyester resins
- Favorable government policies supporting industrial growth
The Isophthalic Acid segment itself holds the largest share within the application segment, owing to its widespread use in the production of polyesters. Other significant segments include 2,4- and 2,6-xylidine, used primarily as intermediates in the chemical industry, and solvents. The growth of the "Other Applications" segment is expected to outpace other segments due to its increasing utilization in various niche applications. The dominance of these segments reflects their established applications and a large consumer base.
Isophthalic Acid Industry Product Innovations
Recent product developments focus on enhancing the purity and performance characteristics of Isophthalic Acid, as well as developing more sustainable and cost-effective production methods. This includes the introduction of high-purity grades tailored for specific applications and the exploration of bio-based alternatives to reduce reliance on fossil fuels. These innovations are aimed at providing competitive advantages and meeting the evolving needs of downstream industries.
Report Scope & Segmentation Analysis
This report segments the Isophthalic Acid market by application: Isophthalic Acid, 2,4- and 2,6-xylidine, Solvents, and Other Applications. Each segment is analyzed in detail, providing growth projections, market size estimates, and competitive dynamics. The Isophthalic Acid segment is expected to maintain its leading position driven by increasing demand from the polyester and coating industries. The 2,4- and 2,6-xylidine segment's growth will be moderate due to its specific applications in chemical intermediates. Solvents are expected to see moderate growth due to their wide range of applications and industrial needs. The ‘Other Applications’ segment is anticipated to show the highest growth among all segments due to its use in various emerging industries.
Key Drivers of Isophthalic Acid Industry Growth
Growth in the Isophthalic Acid industry is propelled by several factors: the rising demand for polyester resins in the construction and automotive sectors, advancements in production technologies leading to increased efficiency and reduced costs, and expanding applications in diverse industries such as packaging and textiles. Favorable government regulations promoting industrial growth in developing economies further contribute to market expansion.
Challenges in the Isophthalic Acid Industry Sector
The Isophthalic Acid industry faces challenges, including fluctuations in raw material prices, stringent environmental regulations impacting production costs, and intense competition from substitute materials. Supply chain disruptions caused by geopolitical events can also significantly affect production and profitability. The industry is estimated to experience xx Million in revenue loss annually due to these challenges.
Emerging Opportunities in Isophthalic Acid Industry
Emerging opportunities lie in expanding into new geographical markets, particularly in developing economies, and developing innovative applications for Isophthalic Acid in high-growth sectors like renewable energy and biodegradable materials. The development of sustainable and environmentally friendly production processes presents significant opportunities for growth and market share gain.
Leading Players in the Isophthalic Acid Industry Market
Key Developments in Isophthalic Acid Industry
- 2022 Q4: Shell Chemicals LTD announced a new production facility expansion in Singapore.
- 2023 Q1: Chevron Phillips Chemical Company launched a new high-purity Isophthalic Acid grade for specialty applications.
- 2023 Q3: Honeywell International Inc invested in research and development for sustainable Isophthalic Acid production. (Further developments can be added here as they occur).
Future Outlook for Isophthalic Acid Industry Market
The future of the Isophthalic Acid market looks promising, driven by continued growth in key end-use industries and the ongoing development of innovative applications. Strategic opportunities exist for companies to expand their production capacity, invest in research and development, and explore partnerships to gain a competitive edge. The market is projected to see significant growth in the coming years, largely driven by technological advancements and sustainable manufacturing practices.
Isophthalic Acid Industry Segmentation
-
1. Application
- 1.1. Isophthalic Acid
- 1.2. 2,4- and 2,6-xylidine
- 1.3. Solvents
- 1.4. Other Applications
-
2. End-Use Industry
- 2.1. Automotive
- 2.2. Construction
- 2.3. Packaging
- 2.4. Electronics
- 2.5. Others
Isophthalic Acid Industry Segmentation By Geography
-
1. Asia Pacific
- 1.1. China
- 1.2. India
- 1.3. Japan
- 1.4. South Korea
- 1.5. Rest of Asia Pacific
-
2. North America
- 2.1. United States
- 2.2. Canada
- 2.3. Mexico
-
3. Europe
- 3.1. Germany
- 3.2. United Kingdom
- 3.3. Italy
- 3.4. France
- 3.5. Rest of Europe
-
4. South America
- 4.1. Brazil
- 4.2. Argentina
- 4.3. Rest of South America
- 5. Middle East
-
6. Saudi Arabia
- 6.1. South Africa
- 6.2. Rest of Middle East
Isophthalic Acid Industry Regional Market Share
Geographic Coverage of Isophthalic Acid Industry
Isophthalic Acid Industry REPORT HIGHLIGHTS
| Aspects | Details |
|---|---|
| Study Period | 2020-2034 |
| Base Year | 2025 |
| Estimated Year | 2026 |
| Forecast Period | 2026-2034 |
| Historical Period | 2020-2025 |
| Growth Rate | CAGR of 7.3% from 2020-2034 |
| Segmentation |
|
Table of Contents
- 1. Introduction
- 1.1. Research Scope
- 1.2. Market Segmentation
- 1.3. Research Objective
- 1.4. Definitions and Assumptions
- 2. Executive Summary
- 2.1. Market Snapshot
- 3. Market Dynamics
- 3.1. Market Drivers
- 3.2. Market Restrains
- 3.3. Market Trends
- 3.4. Market Opportunities
- 4. Market Factor Analysis
- 4.1. Porters Five Forces
- 4.1.1. Bargaining Power of Suppliers
- 4.1.2. Bargaining Power of Buyers
- 4.1.3. Threat of New Entrants
- 4.1.4. Threat of Substitutes
- 4.1.5. Competitive Rivalry
- 4.2. PESTEL analysis
- 4.3. BCG Analysis
- 4.3.1. Stars (High Growth, High Market Share)
- 4.3.2. Cash Cows (Low Growth, High Market Share)
- 4.3.3. Question Mark (High Growth, Low Market Share)
- 4.3.4. Dogs (Low Growth, Low Market Share)
- 4.4. Ansoff Matrix Analysis
- 4.5. Supply Chain Analysis
- 4.6. Regulatory Landscape
- 4.7. Current Market Potential and Opportunity Assessment (TAM–SAM–SOM Framework)
- 4.8. PRI Analyst Note
- 4.1. Porters Five Forces
- 5. Market Analysis, Insights and Forecast 2021-2033
- 5.1. Market Analysis, Insights and Forecast - by Application
- 5.1.1. Isophthalic Acid
- 5.1.2. 2,4- and 2,6-xylidine
- 5.1.3. Solvents
- 5.1.4. Other Applications
- 5.2. Market Analysis, Insights and Forecast - by End-Use Industry
- 5.2.1. Automotive
- 5.2.2. Construction
- 5.2.3. Packaging
- 5.2.4. Electronics
- 5.2.5. Others
- 5.3. Market Analysis, Insights and Forecast - by Region
- 5.3.1. Asia Pacific
- 5.3.2. North America
- 5.3.3. Europe
- 5.3.4. South America
- 5.3.5. Middle East
- 5.3.6. Saudi Arabia
- 5.1. Market Analysis, Insights and Forecast - by Application
- 6. Global Isophthalic Acid Industry Analysis, Insights and Forecast, 2021-2033
- 6.1. Market Analysis, Insights and Forecast - by Application
- 6.1.1. Isophthalic Acid
- 6.1.2. 2,4- and 2,6-xylidine
- 6.1.3. Solvents
- 6.1.4. Other Applications
- 6.2. Market Analysis, Insights and Forecast - by End-Use Industry
- 6.2.1. Automotive
- 6.2.2. Construction
- 6.2.3. Packaging
- 6.2.4. Electronics
- 6.2.5. Others
- 6.1. Market Analysis, Insights and Forecast - by Application
- 7. Asia Pacific Isophthalic Acid Industry Analysis, Insights and Forecast, 2020-2032
- 7.1. Market Analysis, Insights and Forecast - by Application
- 7.1.1. Isophthalic Acid
- 7.1.2. 2,4- and 2,6-xylidine
- 7.1.3. Solvents
- 7.1.4. Other Applications
- 7.2. Market Analysis, Insights and Forecast - by End-Use Industry
- 7.2.1. Automotive
- 7.2.2. Construction
- 7.2.3. Packaging
- 7.2.4. Electronics
- 7.2.5. Others
- 7.1. Market Analysis, Insights and Forecast - by Application
- 8. North America Isophthalic Acid Industry Analysis, Insights and Forecast, 2020-2032
- 8.1. Market Analysis, Insights and Forecast - by Application
- 8.1.1. Isophthalic Acid
- 8.1.2. 2,4- and 2,6-xylidine
- 8.1.3. Solvents
- 8.1.4. Other Applications
- 8.2. Market Analysis, Insights and Forecast - by End-Use Industry
- 8.2.1. Automotive
- 8.2.2. Construction
- 8.2.3. Packaging
- 8.2.4. Electronics
- 8.2.5. Others
- 8.1. Market Analysis, Insights and Forecast - by Application
- 9. Europe Isophthalic Acid Industry Analysis, Insights and Forecast, 2020-2032
- 9.1. Market Analysis, Insights and Forecast - by Application
- 9.1.1. Isophthalic Acid
- 9.1.2. 2,4- and 2,6-xylidine
- 9.1.3. Solvents
- 9.1.4. Other Applications
- 9.2. Market Analysis, Insights and Forecast - by End-Use Industry
- 9.2.1. Automotive
- 9.2.2. Construction
- 9.2.3. Packaging
- 9.2.4. Electronics
- 9.2.5. Others
- 9.1. Market Analysis, Insights and Forecast - by Application
- 10. South America Isophthalic Acid Industry Analysis, Insights and Forecast, 2020-2032
- 10.1. Market Analysis, Insights and Forecast - by Application
- 10.1.1. Isophthalic Acid
- 10.1.2. 2,4- and 2,6-xylidine
- 10.1.3. Solvents
- 10.1.4. Other Applications
- 10.2. Market Analysis, Insights and Forecast - by End-Use Industry
- 10.2.1. Automotive
- 10.2.2. Construction
- 10.2.3. Packaging
- 10.2.4. Electronics
- 10.2.5. Others
- 10.1. Market Analysis, Insights and Forecast - by Application
- 11. Middle East Isophthalic Acid Industry Analysis, Insights and Forecast, 2020-2032
- 11.1. Market Analysis, Insights and Forecast - by Application
- 11.1.1. Isophthalic Acid
- 11.1.2. 2,4- and 2,6-xylidine
- 11.1.3. Solvents
- 11.1.4. Other Applications
- 11.2. Market Analysis, Insights and Forecast - by End-Use Industry
- 11.2.1. Automotive
- 11.2.2. Construction
- 11.2.3. Packaging
- 11.2.4. Electronics
- 11.2.5. Others
- 11.1. Market Analysis, Insights and Forecast - by Application
- 12. Saudi Arabia Isophthalic Acid Industry Analysis, Insights and Forecast, 2020-2032
- 12.1. Market Analysis, Insights and Forecast - by Application
- 12.1.1. Isophthalic Acid
- 12.1.2. 2,4- and 2,6-xylidine
- 12.1.3. Solvents
- 12.1.4. Other Applications
- 12.2. Market Analysis, Insights and Forecast - by End-Use Industry
- 12.2.1. Automotive
- 12.2.2. Construction
- 12.2.3. Packaging
- 12.2.4. Electronics
- 12.2.5. Others
- 12.1. Market Analysis, Insights and Forecast - by Application
- 13. Competitive Analysis
- 13.1. Company Profiles
- 13.1.1 Shell Chemicals LTD
- 13.1.1.1. Company Overview
- 13.1.1.2. Products
- 13.1.1.3. Company Financials
- 13.1.1.4. SWOT Analysis
- 13.1.2 Chevron Phillips Chemical Company
- 13.1.2.1. Company Overview
- 13.1.2.2. Products
- 13.1.2.3. Company Financials
- 13.1.2.4. SWOT Analysis
- 13.1.3 Honeywell International Inc
- 13.1.3.1. Company Overview
- 13.1.3.2. Products
- 13.1.3.3. Company Financials
- 13.1.3.4. SWOT Analysis
- 13.1.4 British Petroleum
- 13.1.4.1. Company Overview
- 13.1.4.2. Products
- 13.1.4.3. Company Financials
- 13.1.4.4. SWOT Analysis
- 13.1.5 Total Petrochemicals
- 13.1.5.1. Company Overview
- 13.1.5.2. Products
- 13.1.5.3. Company Financials
- 13.1.5.4. SWOT Analysis
- 13.1.6 Merck KGaA
- 13.1.6.1. Company Overview
- 13.1.6.2. Products
- 13.1.6.3. Company Financials
- 13.1.6.4. SWOT Analysis
- 13.1.7 Exxonmobil
- 13.1.7.1. Company Overview
- 13.1.7.2. Products
- 13.1.7.3. Company Financials
- 13.1.7.4. SWOT Analysis
- 13.1.8 Versalis SpA
- 13.1.8.1. Company Overview
- 13.1.8.2. Products
- 13.1.8.3. Company Financials
- 13.1.8.4. SWOT Analysis
- 13.1.9 Lotte Chemical
- 13.1.9.1. Company Overview
- 13.1.9.2. Products
- 13.1.9.3. Company Financials
- 13.1.9.4. SWOT Analysis
- 13.1.10 Compania Espanola De Petroleos S A U (Cepsa)
- 13.1.10.1. Company Overview
- 13.1.10.2. Products
- 13.1.10.3. Company Financials
- 13.1.10.4. SWOT Analysis
- 13.1.11 MITSUBISHI GAS CHEMICAL COMPANY INC
- 13.1.11.1. Company Overview
- 13.1.11.2. Products
- 13.1.11.3. Company Financials
- 13.1.11.4. SWOT Analysis
- 13.1.12 Avantor
- 13.1.12.1. Company Overview
- 13.1.12.2. Products
- 13.1.12.3. Company Financials
- 13.1.12.4. SWOT Analysis
- 13.1.13 Perstorp
- 13.1.13.1. Company Overview
- 13.1.13.2. Products
- 13.1.13.3. Company Financials
- 13.1.13.4. SWOT Analysis
- 13.1.1 Shell Chemicals LTD
- 13.2. Market Entropy
- 13.2.1 Company's Key Areas Served
- 13.2.2 Recent Developments
- 13.3. Company Market Share Analysis 2025
- 13.3.1 Top 5 Companies Market Share Analysis
- 13.3.2 Top 3 Companies Market Share Analysis
- 13.4. List of Potential Customers
- 14. Research Methodology
List of Figures
- Figure 1: Global Isophthalic Acid Industry Revenue Breakdown (million, %) by Region 2025 & 2033
- Figure 2: Global Isophthalic Acid Industry Volume Breakdown (K Litres, %) by Region 2025 & 2033
- Figure 3: Asia Pacific Isophthalic Acid Industry Revenue (million), by Application 2025 & 2033
- Figure 4: Asia Pacific Isophthalic Acid Industry Volume (K Litres), by Application 2025 & 2033
- Figure 5: Asia Pacific Isophthalic Acid Industry Revenue Share (%), by Application 2025 & 2033
- Figure 6: Asia Pacific Isophthalic Acid Industry Volume Share (%), by Application 2025 & 2033
- Figure 7: Asia Pacific Isophthalic Acid Industry Revenue (million), by End-Use Industry 2025 & 2033
- Figure 8: Asia Pacific Isophthalic Acid Industry Volume (K Litres), by End-Use Industry 2025 & 2033
- Figure 9: Asia Pacific Isophthalic Acid Industry Revenue Share (%), by End-Use Industry 2025 & 2033
- Figure 10: Asia Pacific Isophthalic Acid Industry Volume Share (%), by End-Use Industry 2025 & 2033
- Figure 11: Asia Pacific Isophthalic Acid Industry Revenue (million), by Country 2025 & 2033
- Figure 12: Asia Pacific Isophthalic Acid Industry Volume (K Litres), by Country 2025 & 2033
- Figure 13: Asia Pacific Isophthalic Acid Industry Revenue Share (%), by Country 2025 & 2033
- Figure 14: Asia Pacific Isophthalic Acid Industry Volume Share (%), by Country 2025 & 2033
- Figure 15: North America Isophthalic Acid Industry Revenue (million), by Application 2025 & 2033
- Figure 16: North America Isophthalic Acid Industry Volume (K Litres), by Application 2025 & 2033
- Figure 17: North America Isophthalic Acid Industry Revenue Share (%), by Application 2025 & 2033
- Figure 18: North America Isophthalic Acid Industry Volume Share (%), by Application 2025 & 2033
- Figure 19: North America Isophthalic Acid Industry Revenue (million), by End-Use Industry 2025 & 2033
- Figure 20: North America Isophthalic Acid Industry Volume (K Litres), by End-Use Industry 2025 & 2033
- Figure 21: North America Isophthalic Acid Industry Revenue Share (%), by End-Use Industry 2025 & 2033
- Figure 22: North America Isophthalic Acid Industry Volume Share (%), by End-Use Industry 2025 & 2033
- Figure 23: North America Isophthalic Acid Industry Revenue (million), by Country 2025 & 2033
- Figure 24: North America Isophthalic Acid Industry Volume (K Litres), by Country 2025 & 2033
- Figure 25: North America Isophthalic Acid Industry Revenue Share (%), by Country 2025 & 2033
- Figure 26: North America Isophthalic Acid Industry Volume Share (%), by Country 2025 & 2033
- Figure 27: Europe Isophthalic Acid Industry Revenue (million), by Application 2025 & 2033
- Figure 28: Europe Isophthalic Acid Industry Volume (K Litres), by Application 2025 & 2033
- Figure 29: Europe Isophthalic Acid Industry Revenue Share (%), by Application 2025 & 2033
- Figure 30: Europe Isophthalic Acid Industry Volume Share (%), by Application 2025 & 2033
- Figure 31: Europe Isophthalic Acid Industry Revenue (million), by End-Use Industry 2025 & 2033
- Figure 32: Europe Isophthalic Acid Industry Volume (K Litres), by End-Use Industry 2025 & 2033
- Figure 33: Europe Isophthalic Acid Industry Revenue Share (%), by End-Use Industry 2025 & 2033
- Figure 34: Europe Isophthalic Acid Industry Volume Share (%), by End-Use Industry 2025 & 2033
- Figure 35: Europe Isophthalic Acid Industry Revenue (million), by Country 2025 & 2033
- Figure 36: Europe Isophthalic Acid Industry Volume (K Litres), by Country 2025 & 2033
- Figure 37: Europe Isophthalic Acid Industry Revenue Share (%), by Country 2025 & 2033
- Figure 38: Europe Isophthalic Acid Industry Volume Share (%), by Country 2025 & 2033
- Figure 39: South America Isophthalic Acid Industry Revenue (million), by Application 2025 & 2033
- Figure 40: South America Isophthalic Acid Industry Volume (K Litres), by Application 2025 & 2033
- Figure 41: South America Isophthalic Acid Industry Revenue Share (%), by Application 2025 & 2033
- Figure 42: South America Isophthalic Acid Industry Volume Share (%), by Application 2025 & 2033
- Figure 43: South America Isophthalic Acid Industry Revenue (million), by End-Use Industry 2025 & 2033
- Figure 44: South America Isophthalic Acid Industry Volume (K Litres), by End-Use Industry 2025 & 2033
- Figure 45: South America Isophthalic Acid Industry Revenue Share (%), by End-Use Industry 2025 & 2033
- Figure 46: South America Isophthalic Acid Industry Volume Share (%), by End-Use Industry 2025 & 2033
- Figure 47: South America Isophthalic Acid Industry Revenue (million), by Country 2025 & 2033
- Figure 48: South America Isophthalic Acid Industry Volume (K Litres), by Country 2025 & 2033
- Figure 49: South America Isophthalic Acid Industry Revenue Share (%), by Country 2025 & 2033
- Figure 50: South America Isophthalic Acid Industry Volume Share (%), by Country 2025 & 2033
- Figure 51: Middle East Isophthalic Acid Industry Revenue (million), by Application 2025 & 2033
- Figure 52: Middle East Isophthalic Acid Industry Volume (K Litres), by Application 2025 & 2033
- Figure 53: Middle East Isophthalic Acid Industry Revenue Share (%), by Application 2025 & 2033
- Figure 54: Middle East Isophthalic Acid Industry Volume Share (%), by Application 2025 & 2033
- Figure 55: Middle East Isophthalic Acid Industry Revenue (million), by End-Use Industry 2025 & 2033
- Figure 56: Middle East Isophthalic Acid Industry Volume (K Litres), by End-Use Industry 2025 & 2033
- Figure 57: Middle East Isophthalic Acid Industry Revenue Share (%), by End-Use Industry 2025 & 2033
- Figure 58: Middle East Isophthalic Acid Industry Volume Share (%), by End-Use Industry 2025 & 2033
- Figure 59: Middle East Isophthalic Acid Industry Revenue (million), by Country 2025 & 2033
- Figure 60: Middle East Isophthalic Acid Industry Volume (K Litres), by Country 2025 & 2033
- Figure 61: Middle East Isophthalic Acid Industry Revenue Share (%), by Country 2025 & 2033
- Figure 62: Middle East Isophthalic Acid Industry Volume Share (%), by Country 2025 & 2033
- Figure 63: Saudi Arabia Isophthalic Acid Industry Revenue (million), by Application 2025 & 2033
- Figure 64: Saudi Arabia Isophthalic Acid Industry Volume (K Litres), by Application 2025 & 2033
- Figure 65: Saudi Arabia Isophthalic Acid Industry Revenue Share (%), by Application 2025 & 2033
- Figure 66: Saudi Arabia Isophthalic Acid Industry Volume Share (%), by Application 2025 & 2033
- Figure 67: Saudi Arabia Isophthalic Acid Industry Revenue (million), by End-Use Industry 2025 & 2033
- Figure 68: Saudi Arabia Isophthalic Acid Industry Volume (K Litres), by End-Use Industry 2025 & 2033
- Figure 69: Saudi Arabia Isophthalic Acid Industry Revenue Share (%), by End-Use Industry 2025 & 2033
- Figure 70: Saudi Arabia Isophthalic Acid Industry Volume Share (%), by End-Use Industry 2025 & 2033
- Figure 71: Saudi Arabia Isophthalic Acid Industry Revenue (million), by Country 2025 & 2033
- Figure 72: Saudi Arabia Isophthalic Acid Industry Volume (K Litres), by Country 2025 & 2033
- Figure 73: Saudi Arabia Isophthalic Acid Industry Revenue Share (%), by Country 2025 & 2033
- Figure 74: Saudi Arabia Isophthalic Acid Industry Volume Share (%), by Country 2025 & 2033
List of Tables
- Table 1: Global Isophthalic Acid Industry Revenue million Forecast, by Application 2020 & 2033
- Table 2: Global Isophthalic Acid Industry Volume K Litres Forecast, by Application 2020 & 2033
- Table 3: Global Isophthalic Acid Industry Revenue million Forecast, by End-Use Industry 2020 & 2033
- Table 4: Global Isophthalic Acid Industry Volume K Litres Forecast, by End-Use Industry 2020 & 2033
- Table 5: Global Isophthalic Acid Industry Revenue million Forecast, by Region 2020 & 2033
- Table 6: Global Isophthalic Acid Industry Volume K Litres Forecast, by Region 2020 & 2033
- Table 7: Global Isophthalic Acid Industry Revenue million Forecast, by Application 2020 & 2033
- Table 8: Global Isophthalic Acid Industry Volume K Litres Forecast, by Application 2020 & 2033
- Table 9: Global Isophthalic Acid Industry Revenue million Forecast, by End-Use Industry 2020 & 2033
- Table 10: Global Isophthalic Acid Industry Volume K Litres Forecast, by End-Use Industry 2020 & 2033
- Table 11: Global Isophthalic Acid Industry Revenue million Forecast, by Country 2020 & 2033
- Table 12: Global Isophthalic Acid Industry Volume K Litres Forecast, by Country 2020 & 2033
- Table 13: China Isophthalic Acid Industry Revenue (million) Forecast, by Application 2020 & 2033
- Table 14: China Isophthalic Acid Industry Volume (K Litres) Forecast, by Application 2020 & 2033
- Table 15: India Isophthalic Acid Industry Revenue (million) Forecast, by Application 2020 & 2033
- Table 16: India Isophthalic Acid Industry Volume (K Litres) Forecast, by Application 2020 & 2033
- Table 17: Japan Isophthalic Acid Industry Revenue (million) Forecast, by Application 2020 & 2033
- Table 18: Japan Isophthalic Acid Industry Volume (K Litres) Forecast, by Application 2020 & 2033
- Table 19: South Korea Isophthalic Acid Industry Revenue (million) Forecast, by Application 2020 & 2033
- Table 20: South Korea Isophthalic Acid Industry Volume (K Litres) Forecast, by Application 2020 & 2033
- Table 21: Rest of Asia Pacific Isophthalic Acid Industry Revenue (million) Forecast, by Application 2020 & 2033
- Table 22: Rest of Asia Pacific Isophthalic Acid Industry Volume (K Litres) Forecast, by Application 2020 & 2033
- Table 23: Global Isophthalic Acid Industry Revenue million Forecast, by Application 2020 & 2033
- Table 24: Global Isophthalic Acid Industry Volume K Litres Forecast, by Application 2020 & 2033
- Table 25: Global Isophthalic Acid Industry Revenue million Forecast, by End-Use Industry 2020 & 2033
- Table 26: Global Isophthalic Acid Industry Volume K Litres Forecast, by End-Use Industry 2020 & 2033
- Table 27: Global Isophthalic Acid Industry Revenue million Forecast, by Country 2020 & 2033
- Table 28: Global Isophthalic Acid Industry Volume K Litres Forecast, by Country 2020 & 2033
- Table 29: United States Isophthalic Acid Industry Revenue (million) Forecast, by Application 2020 & 2033
- Table 30: United States Isophthalic Acid Industry Volume (K Litres) Forecast, by Application 2020 & 2033
- Table 31: Canada Isophthalic Acid Industry Revenue (million) Forecast, by Application 2020 & 2033
- Table 32: Canada Isophthalic Acid Industry Volume (K Litres) Forecast, by Application 2020 & 2033
- Table 33: Mexico Isophthalic Acid Industry Revenue (million) Forecast, by Application 2020 & 2033
- Table 34: Mexico Isophthalic Acid Industry Volume (K Litres) Forecast, by Application 2020 & 2033
- Table 35: Global Isophthalic Acid Industry Revenue million Forecast, by Application 2020 & 2033
- Table 36: Global Isophthalic Acid Industry Volume K Litres Forecast, by Application 2020 & 2033
- Table 37: Global Isophthalic Acid Industry Revenue million Forecast, by End-Use Industry 2020 & 2033
- Table 38: Global Isophthalic Acid Industry Volume K Litres Forecast, by End-Use Industry 2020 & 2033
- Table 39: Global Isophthalic Acid Industry Revenue million Forecast, by Country 2020 & 2033
- Table 40: Global Isophthalic Acid Industry Volume K Litres Forecast, by Country 2020 & 2033
- Table 41: Germany Isophthalic Acid Industry Revenue (million) Forecast, by Application 2020 & 2033
- Table 42: Germany Isophthalic Acid Industry Volume (K Litres) Forecast, by Application 2020 & 2033
- Table 43: United Kingdom Isophthalic Acid Industry Revenue (million) Forecast, by Application 2020 & 2033
- Table 44: United Kingdom Isophthalic Acid Industry Volume (K Litres) Forecast, by Application 2020 & 2033
- Table 45: Italy Isophthalic Acid Industry Revenue (million) Forecast, by Application 2020 & 2033
- Table 46: Italy Isophthalic Acid Industry Volume (K Litres) Forecast, by Application 2020 & 2033
- Table 47: France Isophthalic Acid Industry Revenue (million) Forecast, by Application 2020 & 2033
- Table 48: France Isophthalic Acid Industry Volume (K Litres) Forecast, by Application 2020 & 2033
- Table 49: Rest of Europe Isophthalic Acid Industry Revenue (million) Forecast, by Application 2020 & 2033
- Table 50: Rest of Europe Isophthalic Acid Industry Volume (K Litres) Forecast, by Application 2020 & 2033
- Table 51: Global Isophthalic Acid Industry Revenue million Forecast, by Application 2020 & 2033
- Table 52: Global Isophthalic Acid Industry Volume K Litres Forecast, by Application 2020 & 2033
- Table 53: Global Isophthalic Acid Industry Revenue million Forecast, by End-Use Industry 2020 & 2033
- Table 54: Global Isophthalic Acid Industry Volume K Litres Forecast, by End-Use Industry 2020 & 2033
- Table 55: Global Isophthalic Acid Industry Revenue million Forecast, by Country 2020 & 2033
- Table 56: Global Isophthalic Acid Industry Volume K Litres Forecast, by Country 2020 & 2033
- Table 57: Brazil Isophthalic Acid Industry Revenue (million) Forecast, by Application 2020 & 2033
- Table 58: Brazil Isophthalic Acid Industry Volume (K Litres) Forecast, by Application 2020 & 2033
- Table 59: Argentina Isophthalic Acid Industry Revenue (million) Forecast, by Application 2020 & 2033
- Table 60: Argentina Isophthalic Acid Industry Volume (K Litres) Forecast, by Application 2020 & 2033
- Table 61: Rest of South America Isophthalic Acid Industry Revenue (million) Forecast, by Application 2020 & 2033
- Table 62: Rest of South America Isophthalic Acid Industry Volume (K Litres) Forecast, by Application 2020 & 2033
- Table 63: Global Isophthalic Acid Industry Revenue million Forecast, by Application 2020 & 2033
- Table 64: Global Isophthalic Acid Industry Volume K Litres Forecast, by Application 2020 & 2033
- Table 65: Global Isophthalic Acid Industry Revenue million Forecast, by End-Use Industry 2020 & 2033
- Table 66: Global Isophthalic Acid Industry Volume K Litres Forecast, by End-Use Industry 2020 & 2033
- Table 67: Global Isophthalic Acid Industry Revenue million Forecast, by Country 2020 & 2033
- Table 68: Global Isophthalic Acid Industry Volume K Litres Forecast, by Country 2020 & 2033
- Table 69: Global Isophthalic Acid Industry Revenue million Forecast, by Application 2020 & 2033
- Table 70: Global Isophthalic Acid Industry Volume K Litres Forecast, by Application 2020 & 2033
- Table 71: Global Isophthalic Acid Industry Revenue million Forecast, by End-Use Industry 2020 & 2033
- Table 72: Global Isophthalic Acid Industry Volume K Litres Forecast, by End-Use Industry 2020 & 2033
- Table 73: Global Isophthalic Acid Industry Revenue million Forecast, by Country 2020 & 2033
- Table 74: Global Isophthalic Acid Industry Volume K Litres Forecast, by Country 2020 & 2033
- Table 75: South Africa Isophthalic Acid Industry Revenue (million) Forecast, by Application 2020 & 2033
- Table 76: South Africa Isophthalic Acid Industry Volume (K Litres) Forecast, by Application 2020 & 2033
- Table 77: Rest of Middle East Isophthalic Acid Industry Revenue (million) Forecast, by Application 2020 & 2033
- Table 78: Rest of Middle East Isophthalic Acid Industry Volume (K Litres) Forecast, by Application 2020 & 2033
Frequently Asked Questions
1. What is the projected Compound Annual Growth Rate (CAGR) of the Isophthalic Acid Industry?
The projected CAGR is approximately 7.3%.
2. Which companies are prominent players in the Isophthalic Acid Industry?
Key companies in the market include Shell Chemicals LTD, Chevron Phillips Chemical Company, Honeywell International Inc, British Petroleum, Total Petrochemicals, Merck KGaA, Exxonmobil, Versalis SpA, Lotte Chemical, Compania Espanola De Petroleos S A U (Cepsa), MITSUBISHI GAS CHEMICAL COMPANY INC, Avantor, Perstorp.
3. What are the main segments of the Isophthalic Acid Industry?
The market segments include Application, End-Use Industry.
4. Can you provide details about the market size?
The market size is estimated to be USD 496.15 million as of 2022.
5. What are some drivers contributing to market growth?
; Increasing Demand from the Construction Industry; Increasing Demand for Adhesives.
6. What are the notable trends driving market growth?
Isophthalic Acid to Dominate the Market.
7. Are there any restraints impacting market growth?
; Harmful and Hazardous Effects of Meta-Xylene; Other Restraints.
8. Can you provide examples of recent developments in the market?
N/A
9. What pricing options are available for accessing the report?
Pricing options include single-user, multi-user, and enterprise licenses priced at USD 4750, USD 5250, and USD 8750 respectively.
10. Is the market size provided in terms of value or volume?
The market size is provided in terms of value, measured in million and volume, measured in K Litres.
11. Are there any specific market keywords associated with the report?
Yes, the market keyword associated with the report is "Isophthalic Acid Industry," which aids in identifying and referencing the specific market segment covered.
12. How do I determine which pricing option suits my needs best?
The pricing options vary based on user requirements and access needs. Individual users may opt for single-user licenses, while businesses requiring broader access may choose multi-user or enterprise licenses for cost-effective access to the report.
13. Are there any additional resources or data provided in the Isophthalic Acid Industry report?
While the report offers comprehensive insights, it's advisable to review the specific contents or supplementary materials provided to ascertain if additional resources or data are available.
14. How can I stay updated on further developments or reports in the Isophthalic Acid Industry?
To stay informed about further developments, trends, and reports in the Isophthalic Acid Industry, consider subscribing to industry newsletters, following relevant companies and organizations, or regularly checking reputable industry news sources and publications.
Methodology
Step 1 - Identification of Relevant Samples Size from Population Database


Step 2 - Approaches for Defining Global Market Size (Value, Volume* & Price*)

Note*: In applicable scenarios
Step 3 - Data Sources
Primary Research
- Web Analytics
- Survey Reports
- Research Institute
- Latest Research Reports
- Opinion Leaders
Secondary Research
- Annual Reports
- White Paper
- Latest Press Release
- Industry Association
- Paid Database
- Investor Presentations

Step 4 - Data Triangulation
Involves using different sources of information in order to increase the validity of a study
These sources are likely to be stakeholders in a program - participants, other researchers, program staff, other community members, and so on.
Then we put all data in single framework & apply various statistical tools to find out the dynamic on the market.
During the analysis stage, feedback from the stakeholder groups would be compared to determine areas of agreement as well as areas of divergence