

Key Insights
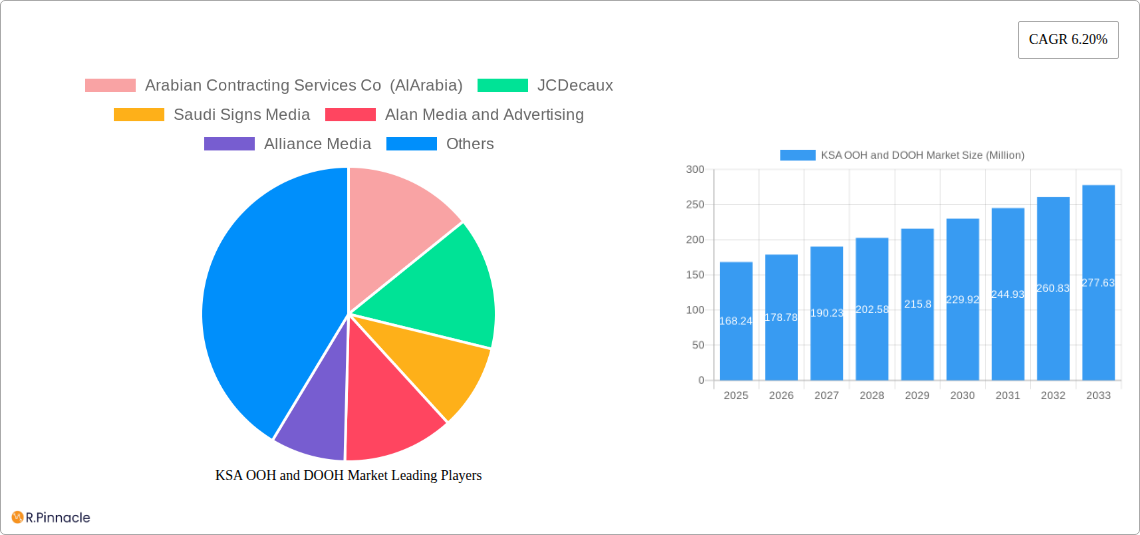
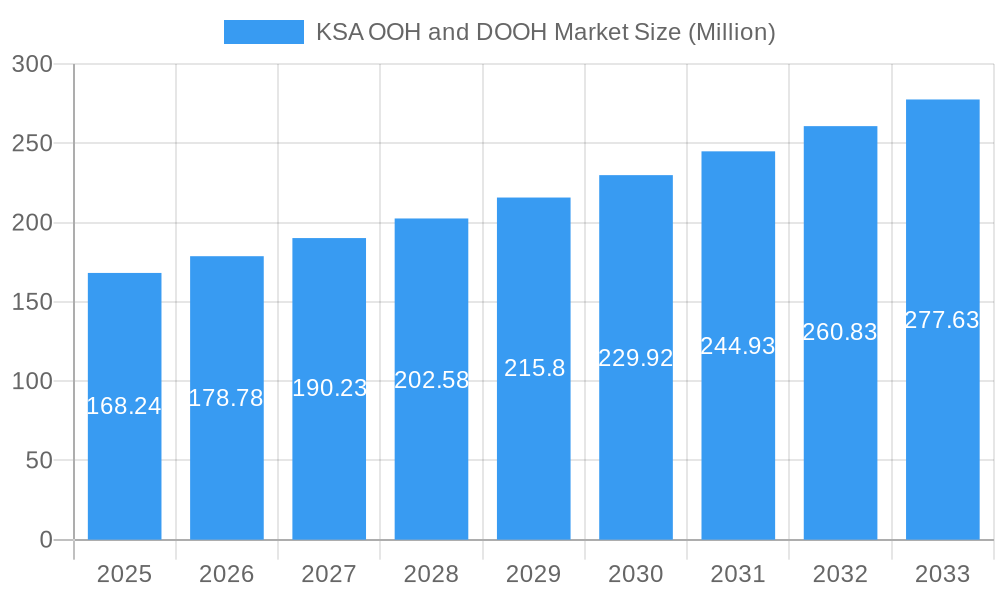
The Kingdom of Saudi Arabia (KSA) Out-of-Home (OOH) and Digital Out-of-Home (DOOH) advertising market presents a compelling investment opportunity, exhibiting robust growth potential. With a 2025 market size of $168.24 million and a projected Compound Annual Growth Rate (CAGR) of 6.20% from 2025 to 2033, the market is poised for significant expansion. This growth is fueled by several key factors. Increasing urbanization and a burgeoning population are driving higher consumer visibility and engagement with OOH and DOOH advertising. Government initiatives focused on infrastructure development, particularly in major cities like Riyadh and Jeddah, create more opportunities for large-scale advertising deployments. Furthermore, the adoption of advanced technologies, such as programmatic DOOH and data-driven campaign optimization, is enhancing the effectiveness and measurability of OOH advertising, attracting greater investment. The market is segmented by various advertising formats including billboards, transit advertising, and digital screens in public spaces, malls, and transportation hubs. Key players such as Arabian Contracting Services Co (AlArabia), JCDecaux, and Saudi Signs Media are actively shaping the market landscape through innovative campaigns and technological advancements.
KSA OOH and DOOH Market Market Size (In Million)
Despite the promising outlook, the KSA OOH and DOOH market faces certain challenges. Competition among established players and new entrants is intensifying, requiring companies to innovate continuously to maintain market share. Economic fluctuations can impact advertising spending, causing temporary slowdowns in growth. Furthermore, regulatory changes and evolving consumer preferences must be closely monitored and incorporated into business strategies. However, the long-term prospects remain optimistic, particularly considering the ongoing diversification of the Saudi Arabian economy and increasing focus on enhancing the quality of life for citizens, both factors that are projected to drive advertising spend and increase the market's overall value. The market's continued growth is expected to create new opportunities for both established players and emerging businesses in the sector.
KSA OOH and DOOH Market Company Market Share
KSA OOH and DOOH Market Report: 2019-2033
This comprehensive report provides an in-depth analysis of the Kingdom of Saudi Arabia (KSA) Out-of-Home (OOH) and Digital Out-of-Home (DOOH) advertising market, offering valuable insights for industry professionals, investors, and businesses seeking to capitalize on this dynamic sector. The report covers the period 2019-2033, with a focus on 2025 as the base and estimated year. It examines market structure, innovation trends, growth drivers, challenges, and future opportunities, providing a clear understanding of the KSA OOH and DOOH landscape.
KSA OOH and DOOH Market Structure & Innovation Trends
This section analyzes the competitive landscape, innovation drivers, and regulatory factors shaping the KSA OOH and DOOH market. The market is characterized by a mix of large multinational players and local companies. Key players include Arabian Contracting Services Co (AlArabia), JCDecaux, Saudi Signs Media, Alan Media and Advertising, Alliance Media, Daktronics Inc, and Advertising Ways Company, though the list is not exhaustive. Market concentration is estimated at xx%, with the top 5 players holding a combined market share of approximately yy%.
- Market Concentration: xx% (Estimated)
- Top 5 Players Market Share: yy% (Estimated)
- M&A Activity: A total of xx M&A deals were recorded between 2019 and 2024, with a total value of approximately $zz Million (Estimated). This activity reflects consolidation and expansion efforts within the sector.
- Innovation Drivers: Technological advancements like programmatic DOOH, data-driven targeting, and interactive displays are driving innovation. Government initiatives to modernize infrastructure and enhance the digital landscape also contribute significantly.
- Regulatory Framework: The regulatory environment plays a crucial role, impacting permits, advertising standards, and overall market growth.
- Product Substitutes: While OOH and DOOH offer unique advantages, competition exists from other advertising channels, including digital and social media.
- End-User Demographics: The report analyzes demographics, consumer preferences, and advertising spending patterns to provide a granular understanding of the target audiences.
KSA OOH and DOOH Market Dynamics & Trends
The KSA OOH and DOOH market is experiencing robust growth, driven by several key factors. Rising disposable incomes, increasing urbanization, and a young, tech-savvy population fuel demand for engaging advertising experiences. Technological disruptions, such as the integration of programmatic buying and data analytics, are transforming the industry, enabling more efficient targeting and measurement. Consumer preferences for interactive and immersive advertising experiences also play a significant role. Competitive dynamics are characterized by both fierce competition among established players and the emergence of innovative startups. The market is expected to grow at a Compound Annual Growth Rate (CAGR) of xx% during the forecast period (2025-2033), reaching a market size of $yy Million by 2033. Market penetration is currently estimated at zz%, with significant potential for further growth.
Dominant Regions & Segments in KSA OOH and DOOH Market
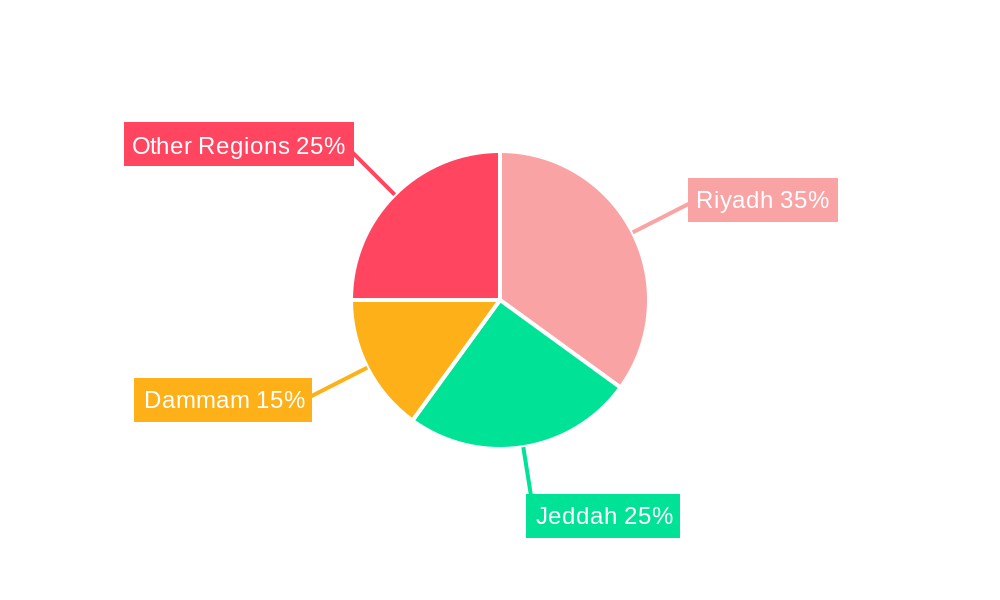
The Riyadh region dominates the KSA OOH and DOOH market, accounting for xx% of the total market value in 2025. This dominance is attributed to factors such as:
- High Population Density: Riyadh boasts a high concentration of people, providing a large potential audience for advertisers.
- Robust Infrastructure: Well-developed infrastructure, including highways and commercial centers, provides ample opportunities for OOH and DOOH advertising placements.
- Economic Activity: Riyadh’s position as the economic and administrative center of the KSA fuels high advertising spending.
Other significant regions include Jeddah and Dammam. The report further analyzes the various segments within the market, including billboards, transit advertising, digital screens, and others, highlighting their unique growth trajectories and competitive landscapes.
KSA OOH and DOOH Market Product Innovations
Recent product innovations include the integration of advanced technologies such as augmented reality (AR), virtual reality (VR), and interactive displays, enhancing engagement and effectiveness. Programmatic DOOH is gaining significant traction, allowing for data-driven targeting and real-time optimization of advertising campaigns. These innovations align with the evolving needs of advertisers and the preferences of consumers, improving campaign efficiency and ROI.
Report Scope & Segmentation Analysis
This report segments the KSA OOH and DOOH market based on several factors: advertising format (billboards, street furniture, transit, digital screens, etc.), location (urban, suburban, rural), industry (retail, FMCG, automotive, etc.), and advertising type (static, dynamic, interactive). Each segment’s growth projections, market size, and competitive dynamics are analyzed in detail. The projected market size for each segment varies considerably, with digital formats expected to experience the highest growth.
Key Drivers of KSA OOH and DOOH Market Growth
Several key factors drive the growth of the KSA OOH and DOOH market: The rapid urbanization and infrastructure development create more opportunities for ad placements. Government initiatives to promote digital transformation contribute to the adoption of DOOH technologies. Growing consumer spending and disposable incomes fuel increased advertising investment. Finally, the increasing use of data analytics and programmatic advertising enhances the effectiveness and efficiency of OOH and DOOH campaigns.
Challenges in the KSA OOH and DOOH Market Sector
Challenges include securing permits and navigating regulatory frameworks, managing supply chain complexities, and facing competition from other advertising channels. The high cost of premium ad placements can also be a barrier for smaller advertisers. The report quantifies the impact of these challenges on market growth and outlines mitigation strategies.
Emerging Opportunities in KSA OOH and DOOH Market
Emerging opportunities include the expansion of programmatic DOOH, the integration of new technologies like AR/VR, and the growth of interactive advertising experiences. The increasing adoption of data analytics for campaign optimization and measurement also presents significant opportunities. New markets, such as smart city initiatives and entertainment venues, also offer potential for growth.
Leading Players in the KSA OOH and DOOH Market Market
- Arabian Contracting Services Co (AlArabia)
- JCDecaux
- Saudi Signs Media
- Alan Media and Advertising
- Alliance Media
- Daktronics Inc
- Advertising Ways Company
Key Developments in KSA OOH and DOOH Market Industry
- October 2023: Yazle partnered with Invenda, boosting programmatic DOOH access in KSA and the UAE, providing advertisers with enhanced tools and prime advertising spaces.
- April 2024: Diriyah Season launched the "Out of Phone (OOP)" campaign, a regional first bridging TikTok and OOH, showcasing the power of integrating digital and physical advertising.
Future Outlook for KSA OOH and DOOH Market Market
The KSA OOH and DOOH market exhibits strong future potential, driven by sustained economic growth, infrastructure development, and the increasing adoption of innovative advertising technologies. Strategic opportunities exist for companies to capitalize on the growing demand for engaging and data-driven advertising solutions. The market is poised for continued expansion, with significant growth expected in the coming years.
KSA OOH and DOOH Market Segmentation
-
1. Type
- 1.1. Static (Traditional) OOH
-
1.2. Digital OOH (LED Screens)
- 1.2.1. Programmatic OOH
- 1.2.2. Other Digital OOH Types
-
2. Application
- 2.1. Billboards
-
2.2. Transportation (Transit)
- 2.2.1. Airports
- 2.2.2. Other Transportation Applications (Buses, etc.)
- 2.3. Street Furniture
- 2.4. Other Place-based Media
-
3. End-user Industry
- 3.1. Automotive
- 3.2. Retail and Consumer Goods
- 3.3. Healthcare
- 3.4. BFSI
- 3.5. Other End-user Industries
KSA OOH and DOOH Market Segmentation By Geography
-
1. North America
- 1.1. United States
- 1.2. Canada
- 1.3. Mexico
-
2. South America
- 2.1. Brazil
- 2.2. Argentina
- 2.3. Rest of South America
-
3. Europe
- 3.1. United Kingdom
- 3.2. Germany
- 3.3. France
- 3.4. Italy
- 3.5. Spain
- 3.6. Russia
- 3.7. Benelux
- 3.8. Nordics
- 3.9. Rest of Europe
-
4. Middle East & Africa
- 4.1. Turkey
- 4.2. Israel
- 4.3. GCC
- 4.4. North Africa
- 4.5. South Africa
- 4.6. Rest of Middle East & Africa
-
5. Asia Pacific
- 5.1. China
- 5.2. India
- 5.3. Japan
- 5.4. South Korea
- 5.5. ASEAN
- 5.6. Oceania
- 5.7. Rest of Asia Pacific
KSA OOH and DOOH Market Regional Market Share
Geographic Coverage of KSA OOH and DOOH Market
KSA OOH and DOOH Market REPORT HIGHLIGHTS
| Aspects | Details |
|---|---|
| Study Period | 2020-2034 |
| Base Year | 2025 |
| Estimated Year | 2026 |
| Forecast Period | 2026-2034 |
| Historical Period | 2020-2025 |
| Growth Rate | CAGR of 6.20% from 2020-2034 |
| Segmentation |
|
Table of Contents
- 1. Introduction
- 1.1. Research Scope
- 1.2. Market Segmentation
- 1.3. Research Objective
- 1.4. Definitions and Assumptions
- 2. Executive Summary
- 2.1. Market Snapshot
- 3. Market Dynamics
- 3.1. Market Drivers
- 3.2. Market Restrains
- 3.3. Market Trends
- 3.4. Market Opportunities
- 4. Market Factor Analysis
- 4.1. Porters Five Forces
- 4.1.1. Bargaining Power of Suppliers
- 4.1.2. Bargaining Power of Buyers
- 4.1.3. Threat of New Entrants
- 4.1.4. Threat of Substitutes
- 4.1.5. Competitive Rivalry
- 4.2. PESTEL analysis
- 4.3. BCG Analysis
- 4.3.1. Stars (High Growth, High Market Share)
- 4.3.2. Cash Cows (Low Growth, High Market Share)
- 4.3.3. Question Mark (High Growth, Low Market Share)
- 4.3.4. Dogs (Low Growth, Low Market Share)
- 4.4. Ansoff Matrix Analysis
- 4.5. Supply Chain Analysis
- 4.6. Regulatory Landscape
- 4.7. Current Market Potential and Opportunity Assessment (TAM–SAM–SOM Framework)
- 4.8. PRI Analyst Note
- 4.1. Porters Five Forces
- 5. Market Analysis, Insights and Forecast 2021-2033
- 5.1. Market Analysis, Insights and Forecast - by Type
- 5.1.1. Static (Traditional) OOH
- 5.1.2. Digital OOH (LED Screens)
- 5.1.2.1. Programmatic OOH
- 5.1.2.2. Other Digital OOH Types
- 5.2. Market Analysis, Insights and Forecast - by Application
- 5.2.1. Billboards
- 5.2.2. Transportation (Transit)
- 5.2.2.1. Airports
- 5.2.2.2. Other Transportation Applications (Buses, etc.)
- 5.2.3. Street Furniture
- 5.2.4. Other Place-based Media
- 5.3. Market Analysis, Insights and Forecast - by End-user Industry
- 5.3.1. Automotive
- 5.3.2. Retail and Consumer Goods
- 5.3.3. Healthcare
- 5.3.4. BFSI
- 5.3.5. Other End-user Industries
- 5.4. Market Analysis, Insights and Forecast - by Region
- 5.4.1. North America
- 5.4.2. South America
- 5.4.3. Europe
- 5.4.4. Middle East & Africa
- 5.4.5. Asia Pacific
- 5.1. Market Analysis, Insights and Forecast - by Type
- 6. Global KSA OOH and DOOH Market Analysis, Insights and Forecast, 2021-2033
- 6.1. Market Analysis, Insights and Forecast - by Type
- 6.1.1. Static (Traditional) OOH
- 6.1.2. Digital OOH (LED Screens)
- 6.1.2.1. Programmatic OOH
- 6.1.2.2. Other Digital OOH Types
- 6.2. Market Analysis, Insights and Forecast - by Application
- 6.2.1. Billboards
- 6.2.2. Transportation (Transit)
- 6.2.2.1. Airports
- 6.2.2.2. Other Transportation Applications (Buses, etc.)
- 6.2.3. Street Furniture
- 6.2.4. Other Place-based Media
- 6.3. Market Analysis, Insights and Forecast - by End-user Industry
- 6.3.1. Automotive
- 6.3.2. Retail and Consumer Goods
- 6.3.3. Healthcare
- 6.3.4. BFSI
- 6.3.5. Other End-user Industries
- 6.1. Market Analysis, Insights and Forecast - by Type
- 7. North America KSA OOH and DOOH Market Analysis, Insights and Forecast, 2020-2032
- 7.1. Market Analysis, Insights and Forecast - by Type
- 7.1.1. Static (Traditional) OOH
- 7.1.2. Digital OOH (LED Screens)
- 7.1.2.1. Programmatic OOH
- 7.1.2.2. Other Digital OOH Types
- 7.2. Market Analysis, Insights and Forecast - by Application
- 7.2.1. Billboards
- 7.2.2. Transportation (Transit)
- 7.2.2.1. Airports
- 7.2.2.2. Other Transportation Applications (Buses, etc.)
- 7.2.3. Street Furniture
- 7.2.4. Other Place-based Media
- 7.3. Market Analysis, Insights and Forecast - by End-user Industry
- 7.3.1. Automotive
- 7.3.2. Retail and Consumer Goods
- 7.3.3. Healthcare
- 7.3.4. BFSI
- 7.3.5. Other End-user Industries
- 7.1. Market Analysis, Insights and Forecast - by Type
- 8. South America KSA OOH and DOOH Market Analysis, Insights and Forecast, 2020-2032
- 8.1. Market Analysis, Insights and Forecast - by Type
- 8.1.1. Static (Traditional) OOH
- 8.1.2. Digital OOH (LED Screens)
- 8.1.2.1. Programmatic OOH
- 8.1.2.2. Other Digital OOH Types
- 8.2. Market Analysis, Insights and Forecast - by Application
- 8.2.1. Billboards
- 8.2.2. Transportation (Transit)
- 8.2.2.1. Airports
- 8.2.2.2. Other Transportation Applications (Buses, etc.)
- 8.2.3. Street Furniture
- 8.2.4. Other Place-based Media
- 8.3. Market Analysis, Insights and Forecast - by End-user Industry
- 8.3.1. Automotive
- 8.3.2. Retail and Consumer Goods
- 8.3.3. Healthcare
- 8.3.4. BFSI
- 8.3.5. Other End-user Industries
- 8.1. Market Analysis, Insights and Forecast - by Type
- 9. Europe KSA OOH and DOOH Market Analysis, Insights and Forecast, 2020-2032
- 9.1. Market Analysis, Insights and Forecast - by Type
- 9.1.1. Static (Traditional) OOH
- 9.1.2. Digital OOH (LED Screens)
- 9.1.2.1. Programmatic OOH
- 9.1.2.2. Other Digital OOH Types
- 9.2. Market Analysis, Insights and Forecast - by Application
- 9.2.1. Billboards
- 9.2.2. Transportation (Transit)
- 9.2.2.1. Airports
- 9.2.2.2. Other Transportation Applications (Buses, etc.)
- 9.2.3. Street Furniture
- 9.2.4. Other Place-based Media
- 9.3. Market Analysis, Insights and Forecast - by End-user Industry
- 9.3.1. Automotive
- 9.3.2. Retail and Consumer Goods
- 9.3.3. Healthcare
- 9.3.4. BFSI
- 9.3.5. Other End-user Industries
- 9.1. Market Analysis, Insights and Forecast - by Type
- 10. Middle East & Africa KSA OOH and DOOH Market Analysis, Insights and Forecast, 2020-2032
- 10.1. Market Analysis, Insights and Forecast - by Type
- 10.1.1. Static (Traditional) OOH
- 10.1.2. Digital OOH (LED Screens)
- 10.1.2.1. Programmatic OOH
- 10.1.2.2. Other Digital OOH Types
- 10.2. Market Analysis, Insights and Forecast - by Application
- 10.2.1. Billboards
- 10.2.2. Transportation (Transit)
- 10.2.2.1. Airports
- 10.2.2.2. Other Transportation Applications (Buses, etc.)
- 10.2.3. Street Furniture
- 10.2.4. Other Place-based Media
- 10.3. Market Analysis, Insights and Forecast - by End-user Industry
- 10.3.1. Automotive
- 10.3.2. Retail and Consumer Goods
- 10.3.3. Healthcare
- 10.3.4. BFSI
- 10.3.5. Other End-user Industries
- 10.1. Market Analysis, Insights and Forecast - by Type
- 11. Asia Pacific KSA OOH and DOOH Market Analysis, Insights and Forecast, 2020-2032
- 11.1. Market Analysis, Insights and Forecast - by Type
- 11.1.1. Static (Traditional) OOH
- 11.1.2. Digital OOH (LED Screens)
- 11.1.2.1. Programmatic OOH
- 11.1.2.2. Other Digital OOH Types
- 11.2. Market Analysis, Insights and Forecast - by Application
- 11.2.1. Billboards
- 11.2.2. Transportation (Transit)
- 11.2.2.1. Airports
- 11.2.2.2. Other Transportation Applications (Buses, etc.)
- 11.2.3. Street Furniture
- 11.2.4. Other Place-based Media
- 11.3. Market Analysis, Insights and Forecast - by End-user Industry
- 11.3.1. Automotive
- 11.3.2. Retail and Consumer Goods
- 11.3.3. Healthcare
- 11.3.4. BFSI
- 11.3.5. Other End-user Industries
- 11.1. Market Analysis, Insights and Forecast - by Type
- 12. Competitive Analysis
- 12.1. Company Profiles
- 12.1.1 Arabian Contracting Services Co (AlArabia)
- 12.1.1.1. Company Overview
- 12.1.1.2. Products
- 12.1.1.3. Company Financials
- 12.1.1.4. SWOT Analysis
- 12.1.2 JCDecaux
- 12.1.2.1. Company Overview
- 12.1.2.2. Products
- 12.1.2.3. Company Financials
- 12.1.2.4. SWOT Analysis
- 12.1.3 Saudi Signs Media
- 12.1.3.1. Company Overview
- 12.1.3.2. Products
- 12.1.3.3. Company Financials
- 12.1.3.4. SWOT Analysis
- 12.1.4 Alan Media and Advertising
- 12.1.4.1. Company Overview
- 12.1.4.2. Products
- 12.1.4.3. Company Financials
- 12.1.4.4. SWOT Analysis
- 12.1.5 Alliance Media
- 12.1.5.1. Company Overview
- 12.1.5.2. Products
- 12.1.5.3. Company Financials
- 12.1.5.4. SWOT Analysis
- 12.1.6 Daktronics Inc
- 12.1.6.1. Company Overview
- 12.1.6.2. Products
- 12.1.6.3. Company Financials
- 12.1.6.4. SWOT Analysis
- 12.1.7 Advertising Ways Company*List Not Exhaustive
- 12.1.7.1. Company Overview
- 12.1.7.2. Products
- 12.1.7.3. Company Financials
- 12.1.7.4. SWOT Analysis
- 12.1.1 Arabian Contracting Services Co (AlArabia)
- 12.2. Market Entropy
- 12.2.1 Company's Key Areas Served
- 12.2.2 Recent Developments
- 12.3. Company Market Share Analysis 2025
- 12.3.1 Top 5 Companies Market Share Analysis
- 12.3.2 Top 3 Companies Market Share Analysis
- 12.4. List of Potential Customers
- 13. Research Methodology
List of Figures
- Figure 1: Global KSA OOH and DOOH Market Revenue Breakdown (Million, %) by Region 2025 & 2033
- Figure 2: Global KSA OOH and DOOH Market Volume Breakdown (Million, %) by Region 2025 & 2033
- Figure 3: North America KSA OOH and DOOH Market Revenue (Million), by Type 2025 & 2033
- Figure 4: North America KSA OOH and DOOH Market Volume (Million), by Type 2025 & 2033
- Figure 5: North America KSA OOH and DOOH Market Revenue Share (%), by Type 2025 & 2033
- Figure 6: North America KSA OOH and DOOH Market Volume Share (%), by Type 2025 & 2033
- Figure 7: North America KSA OOH and DOOH Market Revenue (Million), by Application 2025 & 2033
- Figure 8: North America KSA OOH and DOOH Market Volume (Million), by Application 2025 & 2033
- Figure 9: North America KSA OOH and DOOH Market Revenue Share (%), by Application 2025 & 2033
- Figure 10: North America KSA OOH and DOOH Market Volume Share (%), by Application 2025 & 2033
- Figure 11: North America KSA OOH and DOOH Market Revenue (Million), by End-user Industry 2025 & 2033
- Figure 12: North America KSA OOH and DOOH Market Volume (Million), by End-user Industry 2025 & 2033
- Figure 13: North America KSA OOH and DOOH Market Revenue Share (%), by End-user Industry 2025 & 2033
- Figure 14: North America KSA OOH and DOOH Market Volume Share (%), by End-user Industry 2025 & 2033
- Figure 15: North America KSA OOH and DOOH Market Revenue (Million), by Country 2025 & 2033
- Figure 16: North America KSA OOH and DOOH Market Volume (Million), by Country 2025 & 2033
- Figure 17: North America KSA OOH and DOOH Market Revenue Share (%), by Country 2025 & 2033
- Figure 18: North America KSA OOH and DOOH Market Volume Share (%), by Country 2025 & 2033
- Figure 19: South America KSA OOH and DOOH Market Revenue (Million), by Type 2025 & 2033
- Figure 20: South America KSA OOH and DOOH Market Volume (Million), by Type 2025 & 2033
- Figure 21: South America KSA OOH and DOOH Market Revenue Share (%), by Type 2025 & 2033
- Figure 22: South America KSA OOH and DOOH Market Volume Share (%), by Type 2025 & 2033
- Figure 23: South America KSA OOH and DOOH Market Revenue (Million), by Application 2025 & 2033
- Figure 24: South America KSA OOH and DOOH Market Volume (Million), by Application 2025 & 2033
- Figure 25: South America KSA OOH and DOOH Market Revenue Share (%), by Application 2025 & 2033
- Figure 26: South America KSA OOH and DOOH Market Volume Share (%), by Application 2025 & 2033
- Figure 27: South America KSA OOH and DOOH Market Revenue (Million), by End-user Industry 2025 & 2033
- Figure 28: South America KSA OOH and DOOH Market Volume (Million), by End-user Industry 2025 & 2033
- Figure 29: South America KSA OOH and DOOH Market Revenue Share (%), by End-user Industry 2025 & 2033
- Figure 30: South America KSA OOH and DOOH Market Volume Share (%), by End-user Industry 2025 & 2033
- Figure 31: South America KSA OOH and DOOH Market Revenue (Million), by Country 2025 & 2033
- Figure 32: South America KSA OOH and DOOH Market Volume (Million), by Country 2025 & 2033
- Figure 33: South America KSA OOH and DOOH Market Revenue Share (%), by Country 2025 & 2033
- Figure 34: South America KSA OOH and DOOH Market Volume Share (%), by Country 2025 & 2033
- Figure 35: Europe KSA OOH and DOOH Market Revenue (Million), by Type 2025 & 2033
- Figure 36: Europe KSA OOH and DOOH Market Volume (Million), by Type 2025 & 2033
- Figure 37: Europe KSA OOH and DOOH Market Revenue Share (%), by Type 2025 & 2033
- Figure 38: Europe KSA OOH and DOOH Market Volume Share (%), by Type 2025 & 2033
- Figure 39: Europe KSA OOH and DOOH Market Revenue (Million), by Application 2025 & 2033
- Figure 40: Europe KSA OOH and DOOH Market Volume (Million), by Application 2025 & 2033
- Figure 41: Europe KSA OOH and DOOH Market Revenue Share (%), by Application 2025 & 2033
- Figure 42: Europe KSA OOH and DOOH Market Volume Share (%), by Application 2025 & 2033
- Figure 43: Europe KSA OOH and DOOH Market Revenue (Million), by End-user Industry 2025 & 2033
- Figure 44: Europe KSA OOH and DOOH Market Volume (Million), by End-user Industry 2025 & 2033
- Figure 45: Europe KSA OOH and DOOH Market Revenue Share (%), by End-user Industry 2025 & 2033
- Figure 46: Europe KSA OOH and DOOH Market Volume Share (%), by End-user Industry 2025 & 2033
- Figure 47: Europe KSA OOH and DOOH Market Revenue (Million), by Country 2025 & 2033
- Figure 48: Europe KSA OOH and DOOH Market Volume (Million), by Country 2025 & 2033
- Figure 49: Europe KSA OOH and DOOH Market Revenue Share (%), by Country 2025 & 2033
- Figure 50: Europe KSA OOH and DOOH Market Volume Share (%), by Country 2025 & 2033
- Figure 51: Middle East & Africa KSA OOH and DOOH Market Revenue (Million), by Type 2025 & 2033
- Figure 52: Middle East & Africa KSA OOH and DOOH Market Volume (Million), by Type 2025 & 2033
- Figure 53: Middle East & Africa KSA OOH and DOOH Market Revenue Share (%), by Type 2025 & 2033
- Figure 54: Middle East & Africa KSA OOH and DOOH Market Volume Share (%), by Type 2025 & 2033
- Figure 55: Middle East & Africa KSA OOH and DOOH Market Revenue (Million), by Application 2025 & 2033
- Figure 56: Middle East & Africa KSA OOH and DOOH Market Volume (Million), by Application 2025 & 2033
- Figure 57: Middle East & Africa KSA OOH and DOOH Market Revenue Share (%), by Application 2025 & 2033
- Figure 58: Middle East & Africa KSA OOH and DOOH Market Volume Share (%), by Application 2025 & 2033
- Figure 59: Middle East & Africa KSA OOH and DOOH Market Revenue (Million), by End-user Industry 2025 & 2033
- Figure 60: Middle East & Africa KSA OOH and DOOH Market Volume (Million), by End-user Industry 2025 & 2033
- Figure 61: Middle East & Africa KSA OOH and DOOH Market Revenue Share (%), by End-user Industry 2025 & 2033
- Figure 62: Middle East & Africa KSA OOH and DOOH Market Volume Share (%), by End-user Industry 2025 & 2033
- Figure 63: Middle East & Africa KSA OOH and DOOH Market Revenue (Million), by Country 2025 & 2033
- Figure 64: Middle East & Africa KSA OOH and DOOH Market Volume (Million), by Country 2025 & 2033
- Figure 65: Middle East & Africa KSA OOH and DOOH Market Revenue Share (%), by Country 2025 & 2033
- Figure 66: Middle East & Africa KSA OOH and DOOH Market Volume Share (%), by Country 2025 & 2033
- Figure 67: Asia Pacific KSA OOH and DOOH Market Revenue (Million), by Type 2025 & 2033
- Figure 68: Asia Pacific KSA OOH and DOOH Market Volume (Million), by Type 2025 & 2033
- Figure 69: Asia Pacific KSA OOH and DOOH Market Revenue Share (%), by Type 2025 & 2033
- Figure 70: Asia Pacific KSA OOH and DOOH Market Volume Share (%), by Type 2025 & 2033
- Figure 71: Asia Pacific KSA OOH and DOOH Market Revenue (Million), by Application 2025 & 2033
- Figure 72: Asia Pacific KSA OOH and DOOH Market Volume (Million), by Application 2025 & 2033
- Figure 73: Asia Pacific KSA OOH and DOOH Market Revenue Share (%), by Application 2025 & 2033
- Figure 74: Asia Pacific KSA OOH and DOOH Market Volume Share (%), by Application 2025 & 2033
- Figure 75: Asia Pacific KSA OOH and DOOH Market Revenue (Million), by End-user Industry 2025 & 2033
- Figure 76: Asia Pacific KSA OOH and DOOH Market Volume (Million), by End-user Industry 2025 & 2033
- Figure 77: Asia Pacific KSA OOH and DOOH Market Revenue Share (%), by End-user Industry 2025 & 2033
- Figure 78: Asia Pacific KSA OOH and DOOH Market Volume Share (%), by End-user Industry 2025 & 2033
- Figure 79: Asia Pacific KSA OOH and DOOH Market Revenue (Million), by Country 2025 & 2033
- Figure 80: Asia Pacific KSA OOH and DOOH Market Volume (Million), by Country 2025 & 2033
- Figure 81: Asia Pacific KSA OOH and DOOH Market Revenue Share (%), by Country 2025 & 2033
- Figure 82: Asia Pacific KSA OOH and DOOH Market Volume Share (%), by Country 2025 & 2033
List of Tables
- Table 1: Global KSA OOH and DOOH Market Revenue Million Forecast, by Type 2020 & 2033
- Table 2: Global KSA OOH and DOOH Market Volume Million Forecast, by Type 2020 & 2033
- Table 3: Global KSA OOH and DOOH Market Revenue Million Forecast, by Application 2020 & 2033
- Table 4: Global KSA OOH and DOOH Market Volume Million Forecast, by Application 2020 & 2033
- Table 5: Global KSA OOH and DOOH Market Revenue Million Forecast, by End-user Industry 2020 & 2033
- Table 6: Global KSA OOH and DOOH Market Volume Million Forecast, by End-user Industry 2020 & 2033
- Table 7: Global KSA OOH and DOOH Market Revenue Million Forecast, by Region 2020 & 2033
- Table 8: Global KSA OOH and DOOH Market Volume Million Forecast, by Region 2020 & 2033
- Table 9: Global KSA OOH and DOOH Market Revenue Million Forecast, by Type 2020 & 2033
- Table 10: Global KSA OOH and DOOH Market Volume Million Forecast, by Type 2020 & 2033
- Table 11: Global KSA OOH and DOOH Market Revenue Million Forecast, by Application 2020 & 2033
- Table 12: Global KSA OOH and DOOH Market Volume Million Forecast, by Application 2020 & 2033
- Table 13: Global KSA OOH and DOOH Market Revenue Million Forecast, by End-user Industry 2020 & 2033
- Table 14: Global KSA OOH and DOOH Market Volume Million Forecast, by End-user Industry 2020 & 2033
- Table 15: Global KSA OOH and DOOH Market Revenue Million Forecast, by Country 2020 & 2033
- Table 16: Global KSA OOH and DOOH Market Volume Million Forecast, by Country 2020 & 2033
- Table 17: United States KSA OOH and DOOH Market Revenue (Million) Forecast, by Application 2020 & 2033
- Table 18: United States KSA OOH and DOOH Market Volume (Million) Forecast, by Application 2020 & 2033
- Table 19: Canada KSA OOH and DOOH Market Revenue (Million) Forecast, by Application 2020 & 2033
- Table 20: Canada KSA OOH and DOOH Market Volume (Million) Forecast, by Application 2020 & 2033
- Table 21: Mexico KSA OOH and DOOH Market Revenue (Million) Forecast, by Application 2020 & 2033
- Table 22: Mexico KSA OOH and DOOH Market Volume (Million) Forecast, by Application 2020 & 2033
- Table 23: Global KSA OOH and DOOH Market Revenue Million Forecast, by Type 2020 & 2033
- Table 24: Global KSA OOH and DOOH Market Volume Million Forecast, by Type 2020 & 2033
- Table 25: Global KSA OOH and DOOH Market Revenue Million Forecast, by Application 2020 & 2033
- Table 26: Global KSA OOH and DOOH Market Volume Million Forecast, by Application 2020 & 2033
- Table 27: Global KSA OOH and DOOH Market Revenue Million Forecast, by End-user Industry 2020 & 2033
- Table 28: Global KSA OOH and DOOH Market Volume Million Forecast, by End-user Industry 2020 & 2033
- Table 29: Global KSA OOH and DOOH Market Revenue Million Forecast, by Country 2020 & 2033
- Table 30: Global KSA OOH and DOOH Market Volume Million Forecast, by Country 2020 & 2033
- Table 31: Brazil KSA OOH and DOOH Market Revenue (Million) Forecast, by Application 2020 & 2033
- Table 32: Brazil KSA OOH and DOOH Market Volume (Million) Forecast, by Application 2020 & 2033
- Table 33: Argentina KSA OOH and DOOH Market Revenue (Million) Forecast, by Application 2020 & 2033
- Table 34: Argentina KSA OOH and DOOH Market Volume (Million) Forecast, by Application 2020 & 2033
- Table 35: Rest of South America KSA OOH and DOOH Market Revenue (Million) Forecast, by Application 2020 & 2033
- Table 36: Rest of South America KSA OOH and DOOH Market Volume (Million) Forecast, by Application 2020 & 2033
- Table 37: Global KSA OOH and DOOH Market Revenue Million Forecast, by Type 2020 & 2033
- Table 38: Global KSA OOH and DOOH Market Volume Million Forecast, by Type 2020 & 2033
- Table 39: Global KSA OOH and DOOH Market Revenue Million Forecast, by Application 2020 & 2033
- Table 40: Global KSA OOH and DOOH Market Volume Million Forecast, by Application 2020 & 2033
- Table 41: Global KSA OOH and DOOH Market Revenue Million Forecast, by End-user Industry 2020 & 2033
- Table 42: Global KSA OOH and DOOH Market Volume Million Forecast, by End-user Industry 2020 & 2033
- Table 43: Global KSA OOH and DOOH Market Revenue Million Forecast, by Country 2020 & 2033
- Table 44: Global KSA OOH and DOOH Market Volume Million Forecast, by Country 2020 & 2033
- Table 45: United Kingdom KSA OOH and DOOH Market Revenue (Million) Forecast, by Application 2020 & 2033
- Table 46: United Kingdom KSA OOH and DOOH Market Volume (Million) Forecast, by Application 2020 & 2033
- Table 47: Germany KSA OOH and DOOH Market Revenue (Million) Forecast, by Application 2020 & 2033
- Table 48: Germany KSA OOH and DOOH Market Volume (Million) Forecast, by Application 2020 & 2033
- Table 49: France KSA OOH and DOOH Market Revenue (Million) Forecast, by Application 2020 & 2033
- Table 50: France KSA OOH and DOOH Market Volume (Million) Forecast, by Application 2020 & 2033
- Table 51: Italy KSA OOH and DOOH Market Revenue (Million) Forecast, by Application 2020 & 2033
- Table 52: Italy KSA OOH and DOOH Market Volume (Million) Forecast, by Application 2020 & 2033
- Table 53: Spain KSA OOH and DOOH Market Revenue (Million) Forecast, by Application 2020 & 2033
- Table 54: Spain KSA OOH and DOOH Market Volume (Million) Forecast, by Application 2020 & 2033
- Table 55: Russia KSA OOH and DOOH Market Revenue (Million) Forecast, by Application 2020 & 2033
- Table 56: Russia KSA OOH and DOOH Market Volume (Million) Forecast, by Application 2020 & 2033
- Table 57: Benelux KSA OOH and DOOH Market Revenue (Million) Forecast, by Application 2020 & 2033
- Table 58: Benelux KSA OOH and DOOH Market Volume (Million) Forecast, by Application 2020 & 2033
- Table 59: Nordics KSA OOH and DOOH Market Revenue (Million) Forecast, by Application 2020 & 2033
- Table 60: Nordics KSA OOH and DOOH Market Volume (Million) Forecast, by Application 2020 & 2033
- Table 61: Rest of Europe KSA OOH and DOOH Market Revenue (Million) Forecast, by Application 2020 & 2033
- Table 62: Rest of Europe KSA OOH and DOOH Market Volume (Million) Forecast, by Application 2020 & 2033
- Table 63: Global KSA OOH and DOOH Market Revenue Million Forecast, by Type 2020 & 2033
- Table 64: Global KSA OOH and DOOH Market Volume Million Forecast, by Type 2020 & 2033
- Table 65: Global KSA OOH and DOOH Market Revenue Million Forecast, by Application 2020 & 2033
- Table 66: Global KSA OOH and DOOH Market Volume Million Forecast, by Application 2020 & 2033
- Table 67: Global KSA OOH and DOOH Market Revenue Million Forecast, by End-user Industry 2020 & 2033
- Table 68: Global KSA OOH and DOOH Market Volume Million Forecast, by End-user Industry 2020 & 2033
- Table 69: Global KSA OOH and DOOH Market Revenue Million Forecast, by Country 2020 & 2033
- Table 70: Global KSA OOH and DOOH Market Volume Million Forecast, by Country 2020 & 2033
- Table 71: Turkey KSA OOH and DOOH Market Revenue (Million) Forecast, by Application 2020 & 2033
- Table 72: Turkey KSA OOH and DOOH Market Volume (Million) Forecast, by Application 2020 & 2033
- Table 73: Israel KSA OOH and DOOH Market Revenue (Million) Forecast, by Application 2020 & 2033
- Table 74: Israel KSA OOH and DOOH Market Volume (Million) Forecast, by Application 2020 & 2033
- Table 75: GCC KSA OOH and DOOH Market Revenue (Million) Forecast, by Application 2020 & 2033
- Table 76: GCC KSA OOH and DOOH Market Volume (Million) Forecast, by Application 2020 & 2033
- Table 77: North Africa KSA OOH and DOOH Market Revenue (Million) Forecast, by Application 2020 & 2033
- Table 78: North Africa KSA OOH and DOOH Market Volume (Million) Forecast, by Application 2020 & 2033
- Table 79: South Africa KSA OOH and DOOH Market Revenue (Million) Forecast, by Application 2020 & 2033
- Table 80: South Africa KSA OOH and DOOH Market Volume (Million) Forecast, by Application 2020 & 2033
- Table 81: Rest of Middle East & Africa KSA OOH and DOOH Market Revenue (Million) Forecast, by Application 2020 & 2033
- Table 82: Rest of Middle East & Africa KSA OOH and DOOH Market Volume (Million) Forecast, by Application 2020 & 2033
- Table 83: Global KSA OOH and DOOH Market Revenue Million Forecast, by Type 2020 & 2033
- Table 84: Global KSA OOH and DOOH Market Volume Million Forecast, by Type 2020 & 2033
- Table 85: Global KSA OOH and DOOH Market Revenue Million Forecast, by Application 2020 & 2033
- Table 86: Global KSA OOH and DOOH Market Volume Million Forecast, by Application 2020 & 2033
- Table 87: Global KSA OOH and DOOH Market Revenue Million Forecast, by End-user Industry 2020 & 2033
- Table 88: Global KSA OOH and DOOH Market Volume Million Forecast, by End-user Industry 2020 & 2033
- Table 89: Global KSA OOH and DOOH Market Revenue Million Forecast, by Country 2020 & 2033
- Table 90: Global KSA OOH and DOOH Market Volume Million Forecast, by Country 2020 & 2033
- Table 91: China KSA OOH and DOOH Market Revenue (Million) Forecast, by Application 2020 & 2033
- Table 92: China KSA OOH and DOOH Market Volume (Million) Forecast, by Application 2020 & 2033
- Table 93: India KSA OOH and DOOH Market Revenue (Million) Forecast, by Application 2020 & 2033
- Table 94: India KSA OOH and DOOH Market Volume (Million) Forecast, by Application 2020 & 2033
- Table 95: Japan KSA OOH and DOOH Market Revenue (Million) Forecast, by Application 2020 & 2033
- Table 96: Japan KSA OOH and DOOH Market Volume (Million) Forecast, by Application 2020 & 2033
- Table 97: South Korea KSA OOH and DOOH Market Revenue (Million) Forecast, by Application 2020 & 2033
- Table 98: South Korea KSA OOH and DOOH Market Volume (Million) Forecast, by Application 2020 & 2033
- Table 99: ASEAN KSA OOH and DOOH Market Revenue (Million) Forecast, by Application 2020 & 2033
- Table 100: ASEAN KSA OOH and DOOH Market Volume (Million) Forecast, by Application 2020 & 2033
- Table 101: Oceania KSA OOH and DOOH Market Revenue (Million) Forecast, by Application 2020 & 2033
- Table 102: Oceania KSA OOH and DOOH Market Volume (Million) Forecast, by Application 2020 & 2033
- Table 103: Rest of Asia Pacific KSA OOH and DOOH Market Revenue (Million) Forecast, by Application 2020 & 2033
- Table 104: Rest of Asia Pacific KSA OOH and DOOH Market Volume (Million) Forecast, by Application 2020 & 2033
Frequently Asked Questions
1. What is the projected Compound Annual Growth Rate (CAGR) of the KSA OOH and DOOH Market?
The projected CAGR is approximately 6.20%.
2. Which companies are prominent players in the KSA OOH and DOOH Market?
Key companies in the market include Arabian Contracting Services Co (AlArabia), JCDecaux, Saudi Signs Media, Alan Media and Advertising, Alliance Media, Daktronics Inc, Advertising Ways Company*List Not Exhaustive.
3. What are the main segments of the KSA OOH and DOOH Market?
The market segments include Type , Application , End-user Industry .
4. Can you provide details about the market size?
The market size is estimated to be USD 168.24 Million as of 2022.
5. What are some drivers contributing to market growth?
Ongoing Shift Toward Digital Advertising; Growing Development of Public Transport Networks.
6. What are the notable trends driving market growth?
Retail and Consumer Goods Segment Holds the Largest Market Share.
7. Are there any restraints impacting market growth?
Ongoing Shift Toward Digital Advertising; Growing Development of Public Transport Networks.
8. Can you provide examples of recent developments in the market?
April 2024: Diriyah Season partnered with advertising powerhouses UM and FP7 McCann KSA to launch a groundbreaking campaign. This campaign, named "Out of Phone (OOP)," was a regional first, bridging TikTok and out-of-home (OOH) advertising. The primary goal was to transcend TikTok's digital boundaries. The campaign showcased Diriyah Season’s experiences through OOH ads, echoing the magnetic appeal of TikTok content.
9. What pricing options are available for accessing the report?
Pricing options include single-user, multi-user, and enterprise licenses priced at USD 3800, USD 4500, and USD 5800 respectively.
10. Is the market size provided in terms of value or volume?
The market size is provided in terms of value, measured in Million and volume, measured in Million.
11. Are there any specific market keywords associated with the report?
Yes, the market keyword associated with the report is "KSA OOH and DOOH Market," which aids in identifying and referencing the specific market segment covered.
12. How do I determine which pricing option suits my needs best?
The pricing options vary based on user requirements and access needs. Individual users may opt for single-user licenses, while businesses requiring broader access may choose multi-user or enterprise licenses for cost-effective access to the report.
13. Are there any additional resources or data provided in the KSA OOH and DOOH Market report?
While the report offers comprehensive insights, it's advisable to review the specific contents or supplementary materials provided to ascertain if additional resources or data are available.
14. How can I stay updated on further developments or reports in the KSA OOH and DOOH Market?
To stay informed about further developments, trends, and reports in the KSA OOH and DOOH Market, consider subscribing to industry newsletters, following relevant companies and organizations, or regularly checking reputable industry news sources and publications.
Methodology
Step 1 - Identification of Relevant Samples Size from Population Database


Step 2 - Approaches for Defining Global Market Size (Value, Volume* & Price*)

Note*: In applicable scenarios
Step 3 - Data Sources
Primary Research
- Web Analytics
- Survey Reports
- Research Institute
- Latest Research Reports
- Opinion Leaders
Secondary Research
- Annual Reports
- White Paper
- Latest Press Release
- Industry Association
- Paid Database
- Investor Presentations

Step 4 - Data Triangulation
Involves using different sources of information in order to increase the validity of a study
These sources are likely to be stakeholders in a program - participants, other researchers, program staff, other community members, and so on.
Then we put all data in single framework & apply various statistical tools to find out the dynamic on the market.
During the analysis stage, feedback from the stakeholder groups would be compared to determine areas of agreement as well as areas of divergence