Emerging Trends in Lab Informatics Software Industry: A Technology Perspective 2025-2033

Lab Informatics Software Industry by Product (Laboratory Information Management System (LIMS), Electronic Lab Notebooks (ELN), Enterprise Content Management (ECM), Laboratory Execution System (LES), Chromatography Data System (CDS), Scientific Data Management System (SDMS), Electron), by Component (Services, Software), by Delivery Mode (On-premise, Web-hosted, Cloud-based), by North America (United States, Canada, Mexico), by Europe (Germany, United Kingdom, France, Italy, Spain, Rest of Europe), by Asia Pacific (China, Japan, India, Australia, South Korea, Rest of Asia Pacific), by Middle East and Africa (GCC, South Africa, Rest of Middle East and Africa), by South America (Brazil, Argentina, Rest of South America) Forecast 2025-2033

Jul 3 2025
Base Year: 2024

150 Pages
Main Logo

Emerging Trends in Lab Informatics Software Industry: A Technology Perspective 2025-2033


Home
Industries
Healthcare
sponsor image
sponsor image
sponsor image
sponsor image
sponsor image
sponsor image
sponsor image

Tailored for you

  • In-depth Analysis Tailored to Specified Regions or Segments
  • Company Profiles Customized to User Preferences
  • Comprehensive Insights Focused on Specific Segments or Regions
  • Customized Evaluation of Competitive Landscape to Meet Your Needs
  • Tailored Customization to Address Other Specific Requirements
Ask for customization


Key Insights

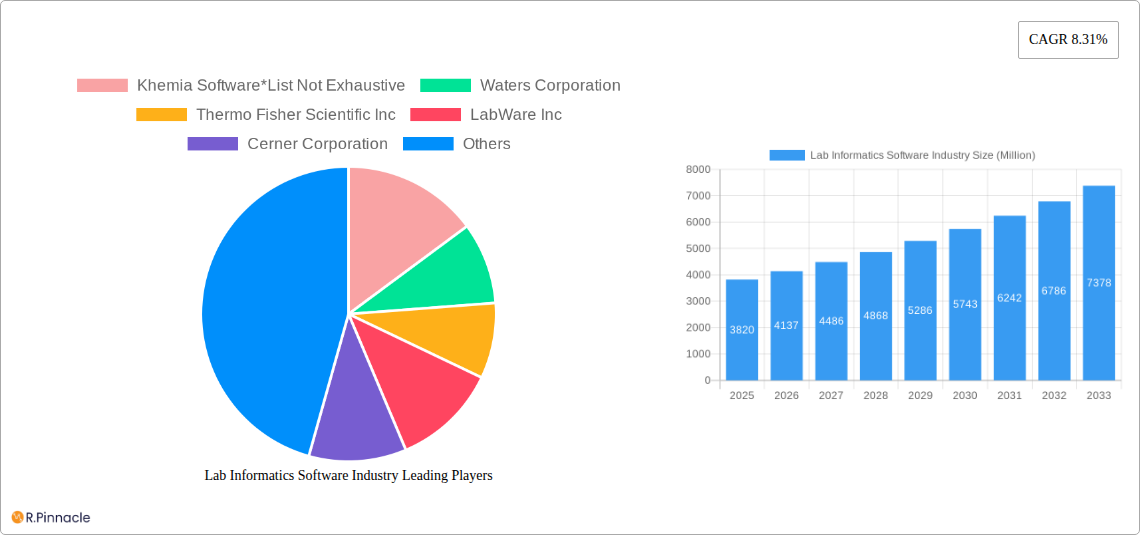
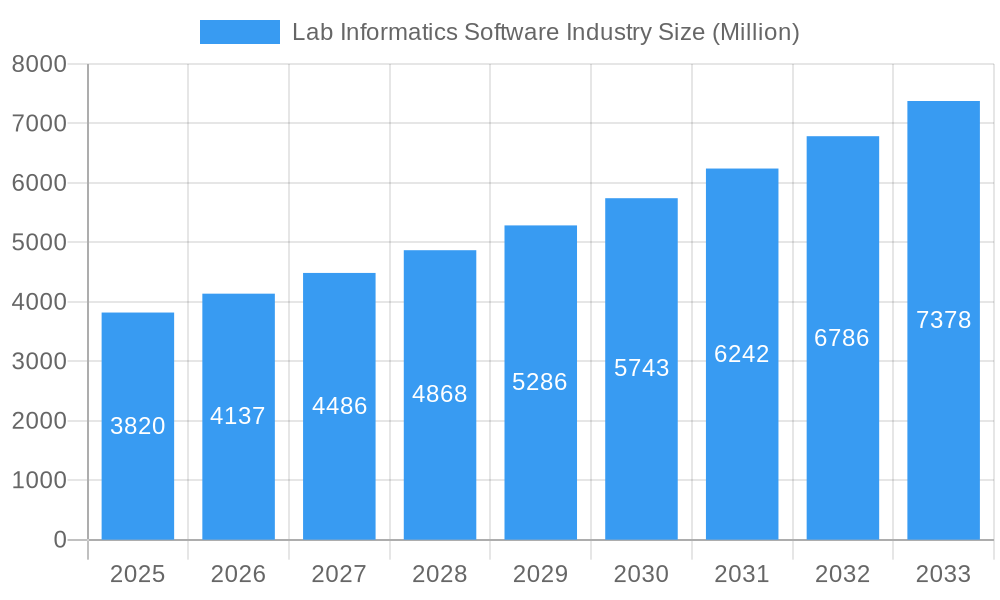
The Lab Informatics Software market, valued at $3.82 billion in 2025, is projected to experience robust growth, driven by the increasing demand for efficient data management and analysis in research and clinical settings. A compound annual growth rate (CAGR) of 8.31% from 2025 to 2033 indicates a significant expansion of this market, reaching an estimated $7.5 billion by 2033. This growth is fueled by several key factors. Firstly, the rising adoption of cloud-based solutions offers scalability, accessibility, and cost-effectiveness compared to on-premise systems. Secondly, the increasing complexity of scientific data necessitates sophisticated software for management and analysis, particularly in genomics, proteomics, and drug discovery. Furthermore, stringent regulatory requirements for data integrity and traceability in regulated industries like pharmaceuticals and healthcare are driving the adoption of LIMS, ELN, and SDMS solutions. The market segmentation reveals that cloud-based delivery modes and services are expected to witness higher growth rates compared to on-premise software. North America currently holds a significant market share, owing to established research infrastructure and early adoption of advanced technologies. However, rapid technological advancements and increasing investments in research and development in Asia-Pacific are expected to fuel substantial growth in this region over the forecast period. Competition is intense, with established players like Thermo Fisher Scientific, Agilent Technologies, and Waters Corporation competing alongside specialized providers.

The competitive landscape is characterized by both large multinational corporations and smaller niche players. The ongoing innovation in areas such as artificial intelligence (AI) and machine learning (ML) integration within lab informatics software is creating new opportunities for market expansion. AI-powered data analysis capabilities are enhancing research efficiency and enabling more insightful findings from complex datasets. The integration of these technologies promises to further accelerate the growth of the market, leading to a more streamlined and intelligent approach to scientific research and data management. However, challenges such as high initial investment costs for software implementation and the need for specialized training can potentially hinder market growth in certain regions.

Lab Informatics Software Industry Research Report - Market Size, Growth & Forecast

Lab Informatics Software Industry Report: 2019-2033

This comprehensive report provides an in-depth analysis of the Lab Informatics Software industry, offering invaluable insights for industry professionals, investors, and strategic decision-makers. With a study period spanning 2019-2033, a base year of 2025, and a forecast period of 2025-2033, this report delivers a complete understanding of past performance, current market dynamics, and future growth projections. The market is valued at $XX Million in 2025 and is projected to reach $XX Million by 2033, exhibiting a CAGR of XX%.

Lab Informatics Software Industry Market Structure & Innovation Trends

The Lab Informatics Software market exhibits a moderately concentrated structure, with key players like Thermo Fisher Scientific Inc, Waters Corporation, and LabWare Inc holding significant market share. However, smaller, specialized companies like Khemia Software are also contributing to innovation. Market share data for 2025 estimates Thermo Fisher Scientific at approximately XX%, Waters Corporation at approximately XX%, and LabWare Inc at approximately XX%. The remaining share is distributed across numerous other players.

Innovation Drivers: The industry is propelled by advancements in cloud computing, AI, and big data analytics, leading to the development of sophisticated LIMS, ELNs, and SDMS solutions. Stringent regulatory requirements for data integrity and traceability further drive adoption.

Regulatory Frameworks: Compliance with regulations like FDA 21 CFR Part 11 and GDPR significantly influences software development and adoption.

Mergers & Acquisitions (M&A): The industry has witnessed several M&A activities in recent years. Deal values have varied, with some exceeding $XX Million. These activities are driven by a desire to expand market reach, acquire cutting-edge technologies, and enhance service offerings. For example, the acquisition of [Company Name] by [Acquirer Name] in [Year] resulted in a combined market share of approximately XX%.

Product Substitutes: While dedicated lab informatics software dominates, general-purpose data management software could be considered a substitute, though they often lack the specialized features needed for laboratory data.

Lab Informatics Software Industry Growth

Lab Informatics Software Industry Market Dynamics & Trends

The Lab Informatics Software market is experiencing robust growth, driven by several factors. The increasing adoption of automation and digitization in laboratories is a major growth catalyst. The need for improved data management, enhanced collaboration, and streamlined workflows across various laboratory settings fuels market expansion. The growing volume of data generated in research and development, as well as routine testing, also necessitates sophisticated software solutions. Further growth is being witnessed in the adoption of cloud-based solutions, offering scalability and accessibility benefits. The market penetration of cloud-based LIMS is estimated at XX% in 2025, projected to reach XX% by 2033. The overall market exhibits a positive competitive landscape, with established players continually innovating and new entrants introducing niche solutions.

Lab Informatics Software Industry Growth

Dominant Regions & Segments in Lab Informatics Software Industry

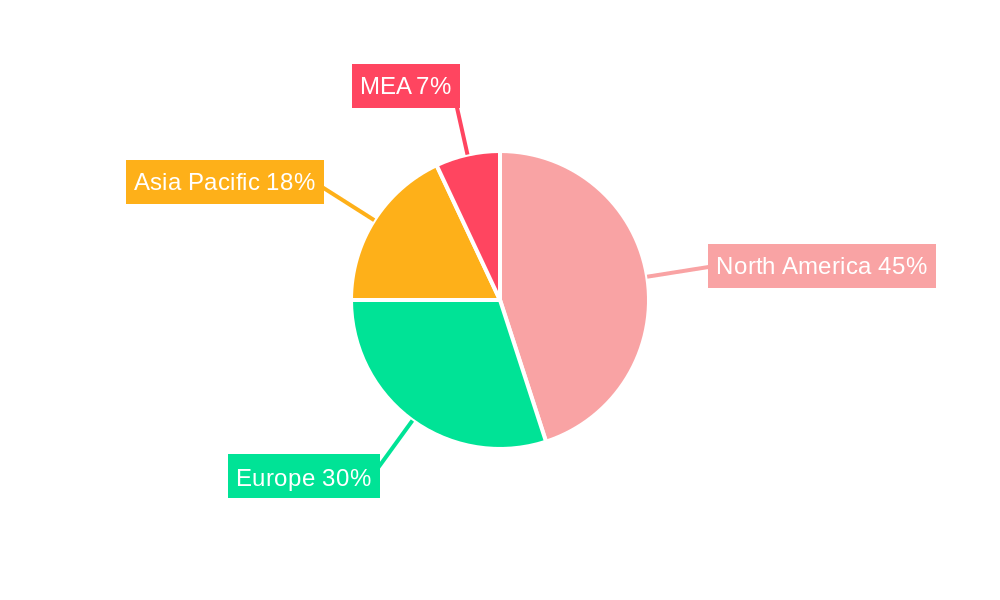
North America currently holds the dominant position in the Lab Informatics Software market, followed by Europe and Asia Pacific. This dominance is attributed to factors such as higher adoption rates, increased R&D spending, and the presence of major industry players.

By Product: The LIMS segment holds the largest market share, driven by its widespread use in various laboratory settings. ELNs are experiencing significant growth, fueled by their ability to enhance collaboration and data organization.

By Component: The software segment is the larger component due to the core nature of software in the functioning of the overall solutions. However, the services segment is also demonstrating steady growth, with increasing demand for implementation, validation, and support services.

By Delivery Mode: The cloud-based delivery model is experiencing rapid growth, driven by its scalability, cost-effectiveness, and accessibility. However, on-premise solutions remain prevalent in certain segments due to data security and regulatory compliance concerns.

  • Key Drivers for North America: High R&D investment, stringent regulatory compliance requirements, and the presence of numerous pharmaceutical and biotechnology companies.
  • Key Drivers for Europe: Government initiatives promoting digitalization in healthcare and research.
  • Key Drivers for Asia Pacific: Growing pharmaceutical industry, increasing adoption of advanced technologies, and favorable government regulations.

Lab Informatics Software Industry Product Innovations

Recent innovations focus on AI-powered data analysis, enhanced data visualization, improved integration with laboratory instruments, and the development of user-friendly interfaces. The integration of blockchain technology for enhanced data security and traceability is also emerging. These innovations address the needs for improved efficiency, data integrity, and regulatory compliance. The market is witnessing a shift towards comprehensive, integrated platforms that combine multiple functionalities, such as LIMS, ELN, and SDMS, into a single system.

Report Scope & Segmentation Analysis

This report provides a detailed segmentation of the Lab Informatics Software market across various parameters:

By Product: LIMS, ELN, ECM, LES, CDS, SDMS, EDC, and CDMS. Each segment exhibits varying growth rates based on industry adoption trends and technological advancements. For example, the LIMS segment is projected to hold a significant market share throughout the forecast period, while the ELN and SDMS segments are expected to demonstrate strong growth.

By Component: Services and Software. The software component dominates in terms of market value, but the services segment is expected to grow at a faster rate.

By Delivery Mode: On-premise, Web-hosted, and Cloud-based. The cloud-based segment demonstrates the highest growth rate due to its flexibility and cost-effectiveness.

Key Drivers of Lab Informatics Software Industry Growth

The Lab Informatics Software industry's growth is fueled by the increasing need for efficient data management in laboratories, driven by the rise in data volume and complexity across various sectors, including pharmaceuticals, biotechnology, and healthcare. The growing adoption of automation and digitization across lab settings is also a major driver. Stricter regulatory compliance requirements and the need for enhanced data security are additional factors influencing the market.

Challenges in the Lab Informatics Software Industry Sector

The industry faces challenges such as high initial investment costs associated with implementing sophisticated software solutions, the need for extensive training and support for end-users, and the complexity of integrating disparate systems. Data security and privacy concerns continue to be significant hurdles, along with the need for continuous software updates and maintenance to ensure compliance with evolving regulations. The competitive landscape, with both established players and new entrants, adds to the complexity.

Emerging Opportunities in Lab Informatics Software Industry

The integration of AI and machine learning is a major opportunity for the industry, enabling advanced data analysis and automation capabilities. The growing demand for cloud-based solutions, particularly SaaS offerings, presents significant opportunities for scalability and cost optimization. Expansion into new markets and the development of specialized solutions for niche laboratory applications are also attractive avenues for growth.

Leading Players in the Lab Informatics Software Industry Market

  • Khemia Software
  • Waters Corporation
  • Thermo Fisher Scientific Inc
  • LabWare Inc
  • Cerner Corporation
  • Abbott Laboratories (Abbott Informatics Corporation)
  • PerkinElmer Inc
  • LabVantage Solutions Inc
  • McKesson Corporation
  • Agilent Technologies
  • LabLynx Inc

Key Developments in Lab Informatics Software Industry

  • August 2021: CTI Clinical Trial and Consulting Services partnered with LabWare, Inc. to expand laboratory services for rare disease and cell & gene therapy research.
  • March 2021: LabVantage Solutions, Inc. launched LabVantage Analytics, a self-service advanced analytics solution for LIMS and enterprise data.

Future Outlook for Lab Informatics Software Industry Market

The Lab Informatics Software market is poised for sustained growth, driven by technological advancements, increasing data volumes, and regulatory pressures. The adoption of cloud-based solutions, AI-powered analytics, and integrated platforms will continue to shape the market landscape. Strategic partnerships, M&A activities, and the development of specialized solutions for niche applications will further contribute to market expansion. The market is expected to experience a period of significant transformation and consolidation in the coming years.

Lab Informatics Software Industry Segmentation

  • 1. Product
    • 1.1. Laboratory Information Management System (LIMS)
    • 1.2. Electronic Lab Notebooks (ELN)
    • 1.3. Enterprise Content Management (ECM)
    • 1.4. Laboratory Execution System (LES)
    • 1.5. Chromatography Data System (CDS)
    • 1.6. Scientific Data Management System (SDMS)
    • 1.7. Electron
  • 2. Component
    • 2.1. Services
    • 2.2. Software
  • 3. Delivery Mode
    • 3.1. On-premise
    • 3.2. Web-hosted
    • 3.3. Cloud-based

Lab Informatics Software Industry Segmentation By Geography

  • 1. North America
    • 1.1. United States
    • 1.2. Canada
    • 1.3. Mexico
  • 2. Europe
    • 2.1. Germany
    • 2.2. United Kingdom
    • 2.3. France
    • 2.4. Italy
    • 2.5. Spain
    • 2.6. Rest of Europe
  • 3. Asia Pacific
    • 3.1. China
    • 3.2. Japan
    • 3.3. India
    • 3.4. Australia
    • 3.5. South Korea
    • 3.6. Rest of Asia Pacific
  • 4. Middle East and Africa
    • 4.1. GCC
    • 4.2. South Africa
    • 4.3. Rest of Middle East and Africa
  • 5. South America
    • 5.1. Brazil
    • 5.2. Argentina
    • 5.3. Rest of South America
Lab Informatics Software Industry Regional Share


Lab Informatics Software Industry REPORT HIGHLIGHTS

AspectsDetails
Study Period 2019-2033
Base Year 2024
Estimated Year 2025
Forecast Period2025-2033
Historical Period2019-2024
Growth RateCAGR of 8.31% from 2019-2033
Segmentation
    • By Product
      • Laboratory Information Management System (LIMS)
      • Electronic Lab Notebooks (ELN)
      • Enterprise Content Management (ECM)
      • Laboratory Execution System (LES)
      • Chromatography Data System (CDS)
      • Scientific Data Management System (SDMS)
      • Electron
    • By Component
      • Services
      • Software
    • By Delivery Mode
      • On-premise
      • Web-hosted
      • Cloud-based
  • By Geography
    • North America
      • United States
      • Canada
      • Mexico
    • Europe
      • Germany
      • United Kingdom
      • France
      • Italy
      • Spain
      • Rest of Europe
    • Asia Pacific
      • China
      • Japan
      • India
      • Australia
      • South Korea
      • Rest of Asia Pacific
    • Middle East and Africa
      • GCC
      • South Africa
      • Rest of Middle East and Africa
    • South America
      • Brazil
      • Argentina
      • Rest of South America


Table of Contents

  1. 1. Introduction
    • 1.1. Research Scope
    • 1.2. Market Segmentation
    • 1.3. Research Methodology
    • 1.4. Definitions and Assumptions
  2. 2. Executive Summary
    • 2.1. Introduction
  3. 3. Market Dynamics
    • 3.1. Introduction
      • 3.2. Market Drivers
        • 3.2.1. High Accuracy and Efficiency of Results; Increasing Applications of Lab Informatics Solutions; Increasing Number of Diagnoses
      • 3.3. Market Restrains
        • 3.3.1. Lack of Integration Standards for Laboratory Informatics; Lack of Skilled Professionals
      • 3.4. Market Trends
        • 3.4.1. Laboratory Information Management System is Expected to Hold its Highest Market Share in the Product
  4. 4. Market Factor Analysis
    • 4.1. Porters Five Forces
    • 4.2. Supply/Value Chain
    • 4.3. PESTEL analysis
    • 4.4. Market Entropy
    • 4.5. Patent/Trademark Analysis
  5. 5. Global Lab Informatics Software Industry Analysis, Insights and Forecast, 2019-2031
    • 5.1. Market Analysis, Insights and Forecast - by Product
      • 5.1.1. Laboratory Information Management System (LIMS)
      • 5.1.2. Electronic Lab Notebooks (ELN)
      • 5.1.3. Enterprise Content Management (ECM)
      • 5.1.4. Laboratory Execution System (LES)
      • 5.1.5. Chromatography Data System (CDS)
      • 5.1.6. Scientific Data Management System (SDMS)
      • 5.1.7. Electron
    • 5.2. Market Analysis, Insights and Forecast - by Component
      • 5.2.1. Services
      • 5.2.2. Software
    • 5.3. Market Analysis, Insights and Forecast - by Delivery Mode
      • 5.3.1. On-premise
      • 5.3.2. Web-hosted
      • 5.3.3. Cloud-based
    • 5.4. Market Analysis, Insights and Forecast - by Region
      • 5.4.1. North America
      • 5.4.2. Europe
      • 5.4.3. Asia Pacific
      • 5.4.4. Middle East and Africa
      • 5.4.5. South America
  6. 6. North America Lab Informatics Software Industry Analysis, Insights and Forecast, 2019-2031
    • 6.1. Market Analysis, Insights and Forecast - by Product
      • 6.1.1. Laboratory Information Management System (LIMS)
      • 6.1.2. Electronic Lab Notebooks (ELN)
      • 6.1.3. Enterprise Content Management (ECM)
      • 6.1.4. Laboratory Execution System (LES)
      • 6.1.5. Chromatography Data System (CDS)
      • 6.1.6. Scientific Data Management System (SDMS)
      • 6.1.7. Electron
    • 6.2. Market Analysis, Insights and Forecast - by Component
      • 6.2.1. Services
      • 6.2.2. Software
    • 6.3. Market Analysis, Insights and Forecast - by Delivery Mode
      • 6.3.1. On-premise
      • 6.3.2. Web-hosted
      • 6.3.3. Cloud-based
  7. 7. Europe Lab Informatics Software Industry Analysis, Insights and Forecast, 2019-2031
    • 7.1. Market Analysis, Insights and Forecast - by Product
      • 7.1.1. Laboratory Information Management System (LIMS)
      • 7.1.2. Electronic Lab Notebooks (ELN)
      • 7.1.3. Enterprise Content Management (ECM)
      • 7.1.4. Laboratory Execution System (LES)
      • 7.1.5. Chromatography Data System (CDS)
      • 7.1.6. Scientific Data Management System (SDMS)
      • 7.1.7. Electron
    • 7.2. Market Analysis, Insights and Forecast - by Component
      • 7.2.1. Services
      • 7.2.2. Software
    • 7.3. Market Analysis, Insights and Forecast - by Delivery Mode
      • 7.3.1. On-premise
      • 7.3.2. Web-hosted
      • 7.3.3. Cloud-based
  8. 8. Asia Pacific Lab Informatics Software Industry Analysis, Insights and Forecast, 2019-2031
    • 8.1. Market Analysis, Insights and Forecast - by Product
      • 8.1.1. Laboratory Information Management System (LIMS)
      • 8.1.2. Electronic Lab Notebooks (ELN)
      • 8.1.3. Enterprise Content Management (ECM)
      • 8.1.4. Laboratory Execution System (LES)
      • 8.1.5. Chromatography Data System (CDS)
      • 8.1.6. Scientific Data Management System (SDMS)
      • 8.1.7. Electron
    • 8.2. Market Analysis, Insights and Forecast - by Component
      • 8.2.1. Services
      • 8.2.2. Software
    • 8.3. Market Analysis, Insights and Forecast - by Delivery Mode
      • 8.3.1. On-premise
      • 8.3.2. Web-hosted
      • 8.3.3. Cloud-based
  9. 9. Middle East and Africa Lab Informatics Software Industry Analysis, Insights and Forecast, 2019-2031
    • 9.1. Market Analysis, Insights and Forecast - by Product
      • 9.1.1. Laboratory Information Management System (LIMS)
      • 9.1.2. Electronic Lab Notebooks (ELN)
      • 9.1.3. Enterprise Content Management (ECM)
      • 9.1.4. Laboratory Execution System (LES)
      • 9.1.5. Chromatography Data System (CDS)
      • 9.1.6. Scientific Data Management System (SDMS)
      • 9.1.7. Electron
    • 9.2. Market Analysis, Insights and Forecast - by Component
      • 9.2.1. Services
      • 9.2.2. Software
    • 9.3. Market Analysis, Insights and Forecast - by Delivery Mode
      • 9.3.1. On-premise
      • 9.3.2. Web-hosted
      • 9.3.3. Cloud-based
  10. 10. South America Lab Informatics Software Industry Analysis, Insights and Forecast, 2019-2031
    • 10.1. Market Analysis, Insights and Forecast - by Product
      • 10.1.1. Laboratory Information Management System (LIMS)
      • 10.1.2. Electronic Lab Notebooks (ELN)
      • 10.1.3. Enterprise Content Management (ECM)
      • 10.1.4. Laboratory Execution System (LES)
      • 10.1.5. Chromatography Data System (CDS)
      • 10.1.6. Scientific Data Management System (SDMS)
      • 10.1.7. Electron
    • 10.2. Market Analysis, Insights and Forecast - by Component
      • 10.2.1. Services
      • 10.2.2. Software
    • 10.3. Market Analysis, Insights and Forecast - by Delivery Mode
      • 10.3.1. On-premise
      • 10.3.2. Web-hosted
      • 10.3.3. Cloud-based
  11. 11. North Americ Lab Informatics Software Industry Analysis, Insights and Forecast, 2019-2031
      • 11.1. Market Analysis, Insights and Forecast - By Country/Sub-region
        • 11.1.1 United States
        • 11.1.2 Canada
        • 11.1.3 Mexico
  12. 12. South America Lab Informatics Software Industry Analysis, Insights and Forecast, 2019-2031
      • 12.1. Market Analysis, Insights and Forecast - By Country/Sub-region
        • 12.1.1 Brazil
        • 12.1.2 Mexico
        • 12.1.3 Rest of South America
  13. 13. Europe Lab Informatics Software Industry Analysis, Insights and Forecast, 2019-2031
      • 13.1. Market Analysis, Insights and Forecast - By Country/Sub-region
        • 13.1.1 Germany
        • 13.1.2 United Kingdom
        • 13.1.3 France
        • 13.1.4 Italy
        • 13.1.5 Spain
        • 13.1.6 Rest of Europe
  14. 14. Asia Pacific Lab Informatics Software Industry Analysis, Insights and Forecast, 2019-2031
      • 14.1. Market Analysis, Insights and Forecast - By Country/Sub-region
        • 14.1.1 China
        • 14.1.2 Japan
        • 14.1.3 India
        • 14.1.4 South Korea
        • 14.1.5 Taiwan
        • 14.1.6 Australia
        • 14.1.7 Rest of Asia-Pacific
  15. 15. MEA Lab Informatics Software Industry Analysis, Insights and Forecast, 2019-2031
      • 15.1. Market Analysis, Insights and Forecast - By Country/Sub-region
        • 15.1.1 Middle East
        • 15.1.2 Africa
  16. 16. Competitive Analysis
    • 16.1. Global Market Share Analysis 2024
      • 16.2. Company Profiles
        • 16.2.1 Khemia Software*List Not Exhaustive
          • 16.2.1.1. Overview
          • 16.2.1.2. Products
          • 16.2.1.3. SWOT Analysis
          • 16.2.1.4. Recent Developments
          • 16.2.1.5. Financials (Based on Availability)
        • 16.2.2 Waters Corporation
          • 16.2.2.1. Overview
          • 16.2.2.2. Products
          • 16.2.2.3. SWOT Analysis
          • 16.2.2.4. Recent Developments
          • 16.2.2.5. Financials (Based on Availability)
        • 16.2.3 Thermo Fisher Scientific Inc
          • 16.2.3.1. Overview
          • 16.2.3.2. Products
          • 16.2.3.3. SWOT Analysis
          • 16.2.3.4. Recent Developments
          • 16.2.3.5. Financials (Based on Availability)
        • 16.2.4 LabWare Inc
          • 16.2.4.1. Overview
          • 16.2.4.2. Products
          • 16.2.4.3. SWOT Analysis
          • 16.2.4.4. Recent Developments
          • 16.2.4.5. Financials (Based on Availability)
        • 16.2.5 Cerner Corporation
          • 16.2.5.1. Overview
          • 16.2.5.2. Products
          • 16.2.5.3. SWOT Analysis
          • 16.2.5.4. Recent Developments
          • 16.2.5.5. Financials (Based on Availability)
        • 16.2.6 Abbott Laboratories (Abbott Informatics Corporation)
          • 16.2.6.1. Overview
          • 16.2.6.2. Products
          • 16.2.6.3. SWOT Analysis
          • 16.2.6.4. Recent Developments
          • 16.2.6.5. Financials (Based on Availability)
        • 16.2.7 PerkinElmer Inc
          • 16.2.7.1. Overview
          • 16.2.7.2. Products
          • 16.2.7.3. SWOT Analysis
          • 16.2.7.4. Recent Developments
          • 16.2.7.5. Financials (Based on Availability)
        • 16.2.8 LabVantage Solutions Inc
          • 16.2.8.1. Overview
          • 16.2.8.2. Products
          • 16.2.8.3. SWOT Analysis
          • 16.2.8.4. Recent Developments
          • 16.2.8.5. Financials (Based on Availability)
        • 16.2.9 McKesson Corporation
          • 16.2.9.1. Overview
          • 16.2.9.2. Products
          • 16.2.9.3. SWOT Analysis
          • 16.2.9.4. Recent Developments
          • 16.2.9.5. Financials (Based on Availability)
        • 16.2.10 Agilent Technologies
          • 16.2.10.1. Overview
          • 16.2.10.2. Products
          • 16.2.10.3. SWOT Analysis
          • 16.2.10.4. Recent Developments
          • 16.2.10.5. Financials (Based on Availability)
        • 16.2.11 LabLynx Inc
          • 16.2.11.1. Overview
          • 16.2.11.2. Products
          • 16.2.11.3. SWOT Analysis
          • 16.2.11.4. Recent Developments
          • 16.2.11.5. Financials (Based on Availability)

List of Figures

  1. Figure 1: Global Lab Informatics Software Industry Revenue Breakdown (Million, %) by Region 2024 & 2032
  2. Figure 2: North Americ Lab Informatics Software Industry Revenue (Million), by Country 2024 & 2032
  3. Figure 3: North Americ Lab Informatics Software Industry Revenue Share (%), by Country 2024 & 2032
  4. Figure 4: South America Lab Informatics Software Industry Revenue (Million), by Country 2024 & 2032
  5. Figure 5: South America Lab Informatics Software Industry Revenue Share (%), by Country 2024 & 2032
  6. Figure 6: Europe Lab Informatics Software Industry Revenue (Million), by Country 2024 & 2032
  7. Figure 7: Europe Lab Informatics Software Industry Revenue Share (%), by Country 2024 & 2032
  8. Figure 8: Asia Pacific Lab Informatics Software Industry Revenue (Million), by Country 2024 & 2032
  9. Figure 9: Asia Pacific Lab Informatics Software Industry Revenue Share (%), by Country 2024 & 2032
  10. Figure 10: MEA Lab Informatics Software Industry Revenue (Million), by Country 2024 & 2032
  11. Figure 11: MEA Lab Informatics Software Industry Revenue Share (%), by Country 2024 & 2032
  12. Figure 12: North America Lab Informatics Software Industry Revenue (Million), by Product 2024 & 2032
  13. Figure 13: North America Lab Informatics Software Industry Revenue Share (%), by Product 2024 & 2032
  14. Figure 14: North America Lab Informatics Software Industry Revenue (Million), by Component 2024 & 2032
  15. Figure 15: North America Lab Informatics Software Industry Revenue Share (%), by Component 2024 & 2032
  16. Figure 16: North America Lab Informatics Software Industry Revenue (Million), by Delivery Mode 2024 & 2032
  17. Figure 17: North America Lab Informatics Software Industry Revenue Share (%), by Delivery Mode 2024 & 2032
  18. Figure 18: North America Lab Informatics Software Industry Revenue (Million), by Country 2024 & 2032
  19. Figure 19: North America Lab Informatics Software Industry Revenue Share (%), by Country 2024 & 2032
  20. Figure 20: Europe Lab Informatics Software Industry Revenue (Million), by Product 2024 & 2032
  21. Figure 21: Europe Lab Informatics Software Industry Revenue Share (%), by Product 2024 & 2032
  22. Figure 22: Europe Lab Informatics Software Industry Revenue (Million), by Component 2024 & 2032
  23. Figure 23: Europe Lab Informatics Software Industry Revenue Share (%), by Component 2024 & 2032
  24. Figure 24: Europe Lab Informatics Software Industry Revenue (Million), by Delivery Mode 2024 & 2032
  25. Figure 25: Europe Lab Informatics Software Industry Revenue Share (%), by Delivery Mode 2024 & 2032
  26. Figure 26: Europe Lab Informatics Software Industry Revenue (Million), by Country 2024 & 2032
  27. Figure 27: Europe Lab Informatics Software Industry Revenue Share (%), by Country 2024 & 2032
  28. Figure 28: Asia Pacific Lab Informatics Software Industry Revenue (Million), by Product 2024 & 2032
  29. Figure 29: Asia Pacific Lab Informatics Software Industry Revenue Share (%), by Product 2024 & 2032
  30. Figure 30: Asia Pacific Lab Informatics Software Industry Revenue (Million), by Component 2024 & 2032
  31. Figure 31: Asia Pacific Lab Informatics Software Industry Revenue Share (%), by Component 2024 & 2032
  32. Figure 32: Asia Pacific Lab Informatics Software Industry Revenue (Million), by Delivery Mode 2024 & 2032
  33. Figure 33: Asia Pacific Lab Informatics Software Industry Revenue Share (%), by Delivery Mode 2024 & 2032
  34. Figure 34: Asia Pacific Lab Informatics Software Industry Revenue (Million), by Country 2024 & 2032
  35. Figure 35: Asia Pacific Lab Informatics Software Industry Revenue Share (%), by Country 2024 & 2032
  36. Figure 36: Middle East and Africa Lab Informatics Software Industry Revenue (Million), by Product 2024 & 2032
  37. Figure 37: Middle East and Africa Lab Informatics Software Industry Revenue Share (%), by Product 2024 & 2032
  38. Figure 38: Middle East and Africa Lab Informatics Software Industry Revenue (Million), by Component 2024 & 2032
  39. Figure 39: Middle East and Africa Lab Informatics Software Industry Revenue Share (%), by Component 2024 & 2032
  40. Figure 40: Middle East and Africa Lab Informatics Software Industry Revenue (Million), by Delivery Mode 2024 & 2032
  41. Figure 41: Middle East and Africa Lab Informatics Software Industry Revenue Share (%), by Delivery Mode 2024 & 2032
  42. Figure 42: Middle East and Africa Lab Informatics Software Industry Revenue (Million), by Country 2024 & 2032
  43. Figure 43: Middle East and Africa Lab Informatics Software Industry Revenue Share (%), by Country 2024 & 2032
  44. Figure 44: South America Lab Informatics Software Industry Revenue (Million), by Product 2024 & 2032
  45. Figure 45: South America Lab Informatics Software Industry Revenue Share (%), by Product 2024 & 2032
  46. Figure 46: South America Lab Informatics Software Industry Revenue (Million), by Component 2024 & 2032
  47. Figure 47: South America Lab Informatics Software Industry Revenue Share (%), by Component 2024 & 2032
  48. Figure 48: South America Lab Informatics Software Industry Revenue (Million), by Delivery Mode 2024 & 2032
  49. Figure 49: South America Lab Informatics Software Industry Revenue Share (%), by Delivery Mode 2024 & 2032
  50. Figure 50: South America Lab Informatics Software Industry Revenue (Million), by Country 2024 & 2032
  51. Figure 51: South America Lab Informatics Software Industry Revenue Share (%), by Country 2024 & 2032

List of Tables

  1. Table 1: Global Lab Informatics Software Industry Revenue Million Forecast, by Region 2019 & 2032
  2. Table 2: Global Lab Informatics Software Industry Revenue Million Forecast, by Product 2019 & 2032
  3. Table 3: Global Lab Informatics Software Industry Revenue Million Forecast, by Component 2019 & 2032
  4. Table 4: Global Lab Informatics Software Industry Revenue Million Forecast, by Delivery Mode 2019 & 2032
  5. Table 5: Global Lab Informatics Software Industry Revenue Million Forecast, by Region 2019 & 2032
  6. Table 6: Global Lab Informatics Software Industry Revenue Million Forecast, by Country 2019 & 2032
  7. Table 7: United States Lab Informatics Software Industry Revenue (Million) Forecast, by Application 2019 & 2032
  8. Table 8: Canada Lab Informatics Software Industry Revenue (Million) Forecast, by Application 2019 & 2032
  9. Table 9: Mexico Lab Informatics Software Industry Revenue (Million) Forecast, by Application 2019 & 2032
  10. Table 10: Global Lab Informatics Software Industry Revenue Million Forecast, by Country 2019 & 2032
  11. Table 11: Brazil Lab Informatics Software Industry Revenue (Million) Forecast, by Application 2019 & 2032
  12. Table 12: Mexico Lab Informatics Software Industry Revenue (Million) Forecast, by Application 2019 & 2032
  13. Table 13: Rest of South America Lab Informatics Software Industry Revenue (Million) Forecast, by Application 2019 & 2032
  14. Table 14: Global Lab Informatics Software Industry Revenue Million Forecast, by Country 2019 & 2032
  15. Table 15: Germany Lab Informatics Software Industry Revenue (Million) Forecast, by Application 2019 & 2032
  16. Table 16: United Kingdom Lab Informatics Software Industry Revenue (Million) Forecast, by Application 2019 & 2032
  17. Table 17: France Lab Informatics Software Industry Revenue (Million) Forecast, by Application 2019 & 2032
  18. Table 18: Italy Lab Informatics Software Industry Revenue (Million) Forecast, by Application 2019 & 2032
  19. Table 19: Spain Lab Informatics Software Industry Revenue (Million) Forecast, by Application 2019 & 2032
  20. Table 20: Rest of Europe Lab Informatics Software Industry Revenue (Million) Forecast, by Application 2019 & 2032
  21. Table 21: Global Lab Informatics Software Industry Revenue Million Forecast, by Country 2019 & 2032
  22. Table 22: China Lab Informatics Software Industry Revenue (Million) Forecast, by Application 2019 & 2032
  23. Table 23: Japan Lab Informatics Software Industry Revenue (Million) Forecast, by Application 2019 & 2032
  24. Table 24: India Lab Informatics Software Industry Revenue (Million) Forecast, by Application 2019 & 2032
  25. Table 25: South Korea Lab Informatics Software Industry Revenue (Million) Forecast, by Application 2019 & 2032
  26. Table 26: Taiwan Lab Informatics Software Industry Revenue (Million) Forecast, by Application 2019 & 2032
  27. Table 27: Australia Lab Informatics Software Industry Revenue (Million) Forecast, by Application 2019 & 2032
  28. Table 28: Rest of Asia-Pacific Lab Informatics Software Industry Revenue (Million) Forecast, by Application 2019 & 2032
  29. Table 29: Global Lab Informatics Software Industry Revenue Million Forecast, by Country 2019 & 2032
  30. Table 30: Middle East Lab Informatics Software Industry Revenue (Million) Forecast, by Application 2019 & 2032
  31. Table 31: Africa Lab Informatics Software Industry Revenue (Million) Forecast, by Application 2019 & 2032
  32. Table 32: Global Lab Informatics Software Industry Revenue Million Forecast, by Product 2019 & 2032
  33. Table 33: Global Lab Informatics Software Industry Revenue Million Forecast, by Component 2019 & 2032
  34. Table 34: Global Lab Informatics Software Industry Revenue Million Forecast, by Delivery Mode 2019 & 2032
  35. Table 35: Global Lab Informatics Software Industry Revenue Million Forecast, by Country 2019 & 2032
  36. Table 36: United States Lab Informatics Software Industry Revenue (Million) Forecast, by Application 2019 & 2032
  37. Table 37: Canada Lab Informatics Software Industry Revenue (Million) Forecast, by Application 2019 & 2032
  38. Table 38: Mexico Lab Informatics Software Industry Revenue (Million) Forecast, by Application 2019 & 2032
  39. Table 39: Global Lab Informatics Software Industry Revenue Million Forecast, by Product 2019 & 2032
  40. Table 40: Global Lab Informatics Software Industry Revenue Million Forecast, by Component 2019 & 2032
  41. Table 41: Global Lab Informatics Software Industry Revenue Million Forecast, by Delivery Mode 2019 & 2032
  42. Table 42: Global Lab Informatics Software Industry Revenue Million Forecast, by Country 2019 & 2032
  43. Table 43: Germany Lab Informatics Software Industry Revenue (Million) Forecast, by Application 2019 & 2032
  44. Table 44: United Kingdom Lab Informatics Software Industry Revenue (Million) Forecast, by Application 2019 & 2032
  45. Table 45: France Lab Informatics Software Industry Revenue (Million) Forecast, by Application 2019 & 2032
  46. Table 46: Italy Lab Informatics Software Industry Revenue (Million) Forecast, by Application 2019 & 2032
  47. Table 47: Spain Lab Informatics Software Industry Revenue (Million) Forecast, by Application 2019 & 2032
  48. Table 48: Rest of Europe Lab Informatics Software Industry Revenue (Million) Forecast, by Application 2019 & 2032
  49. Table 49: Global Lab Informatics Software Industry Revenue Million Forecast, by Product 2019 & 2032
  50. Table 50: Global Lab Informatics Software Industry Revenue Million Forecast, by Component 2019 & 2032
  51. Table 51: Global Lab Informatics Software Industry Revenue Million Forecast, by Delivery Mode 2019 & 2032
  52. Table 52: Global Lab Informatics Software Industry Revenue Million Forecast, by Country 2019 & 2032
  53. Table 53: China Lab Informatics Software Industry Revenue (Million) Forecast, by Application 2019 & 2032
  54. Table 54: Japan Lab Informatics Software Industry Revenue (Million) Forecast, by Application 2019 & 2032
  55. Table 55: India Lab Informatics Software Industry Revenue (Million) Forecast, by Application 2019 & 2032
  56. Table 56: Australia Lab Informatics Software Industry Revenue (Million) Forecast, by Application 2019 & 2032
  57. Table 57: South Korea Lab Informatics Software Industry Revenue (Million) Forecast, by Application 2019 & 2032
  58. Table 58: Rest of Asia Pacific Lab Informatics Software Industry Revenue (Million) Forecast, by Application 2019 & 2032
  59. Table 59: Global Lab Informatics Software Industry Revenue Million Forecast, by Product 2019 & 2032
  60. Table 60: Global Lab Informatics Software Industry Revenue Million Forecast, by Component 2019 & 2032
  61. Table 61: Global Lab Informatics Software Industry Revenue Million Forecast, by Delivery Mode 2019 & 2032
  62. Table 62: Global Lab Informatics Software Industry Revenue Million Forecast, by Country 2019 & 2032
  63. Table 63: GCC Lab Informatics Software Industry Revenue (Million) Forecast, by Application 2019 & 2032
  64. Table 64: South Africa Lab Informatics Software Industry Revenue (Million) Forecast, by Application 2019 & 2032
  65. Table 65: Rest of Middle East and Africa Lab Informatics Software Industry Revenue (Million) Forecast, by Application 2019 & 2032
  66. Table 66: Global Lab Informatics Software Industry Revenue Million Forecast, by Product 2019 & 2032
  67. Table 67: Global Lab Informatics Software Industry Revenue Million Forecast, by Component 2019 & 2032
  68. Table 68: Global Lab Informatics Software Industry Revenue Million Forecast, by Delivery Mode 2019 & 2032
  69. Table 69: Global Lab Informatics Software Industry Revenue Million Forecast, by Country 2019 & 2032
  70. Table 70: Brazil Lab Informatics Software Industry Revenue (Million) Forecast, by Application 2019 & 2032
  71. Table 71: Argentina Lab Informatics Software Industry Revenue (Million) Forecast, by Application 2019 & 2032
  72. Table 72: Rest of South America Lab Informatics Software Industry Revenue (Million) Forecast, by Application 2019 & 2032


Frequently Asked Questions

1. What is the projected Compound Annual Growth Rate (CAGR) of the Lab Informatics Software Industry?

The projected CAGR is approximately 8.31%.

2. Which companies are prominent players in the Lab Informatics Software Industry?

Key companies in the market include Khemia Software*List Not Exhaustive, Waters Corporation, Thermo Fisher Scientific Inc, LabWare Inc, Cerner Corporation, Abbott Laboratories (Abbott Informatics Corporation), PerkinElmer Inc, LabVantage Solutions Inc, McKesson Corporation, Agilent Technologies, LabLynx Inc.

3. What are the main segments of the Lab Informatics Software Industry?

The market segments include Product, Component, Delivery Mode.

4. Can you provide details about the market size?

The market size is estimated to be USD 3.82 Million as of 2022.

5. What are some drivers contributing to market growth?

High Accuracy and Efficiency of Results; Increasing Applications of Lab Informatics Solutions; Increasing Number of Diagnoses.

6. What are the notable trends driving market growth?

Laboratory Information Management System is Expected to Hold its Highest Market Share in the Product.

7. Are there any restraints impacting market growth?

Lack of Integration Standards for Laboratory Informatics; Lack of Skilled Professionals.

8. Can you provide examples of recent developments in the market?

In August 2021, CTI Clinical Trial and Consulting Services (CTI) entered into a partnership with LabWare, Inc. to expand laboratory services to support rare disease and cell & gene therapy research across all regions of the world.

9. What pricing options are available for accessing the report?

Pricing options include single-user, multi-user, and enterprise licenses priced at USD 4750, USD 5250, and USD 8750 respectively.

10. Is the market size provided in terms of value or volume?

The market size is provided in terms of value, measured in Million.

11. Are there any specific market keywords associated with the report?

Yes, the market keyword associated with the report is "Lab Informatics Software Industry," which aids in identifying and referencing the specific market segment covered.

12. How do I determine which pricing option suits my needs best?

The pricing options vary based on user requirements and access needs. Individual users may opt for single-user licenses, while businesses requiring broader access may choose multi-user or enterprise licenses for cost-effective access to the report.

13. Are there any additional resources or data provided in the Lab Informatics Software Industry report?

While the report offers comprehensive insights, it's advisable to review the specific contents or supplementary materials provided to ascertain if additional resources or data are available.

14. How can I stay updated on further developments or reports in the Lab Informatics Software Industry?

To stay informed about further developments, trends, and reports in the Lab Informatics Software Industry, consider subscribing to industry newsletters, following relevant companies and organizations, or regularly checking reputable industry news sources and publications.


Methodology

Step 1 - Identification of Relevant Samples Size from Population Database

Step Chart
Bar Chart
Method Chart

Step 2 - Approaches for Defining Global Market Size (Value, Volume* & Price*)

Approach Chart
Top-down and bottom-up approaches are used to validate the global market size and estimate the market size for manufactures, regional segments, product, and application.

Note*: In applicable scenarios

Step 3 - Data Sources

Primary Research

  • Web Analytics
  • Survey Reports
  • Research Institute
  • Latest Research Reports
  • Opinion Leaders

Secondary Research

  • Annual Reports
  • White Paper
  • Latest Press Release
  • Industry Association
  • Paid Database
  • Investor Presentations
Analyst Chart

Step 4 - Data Triangulation

Involves using different sources of information in order to increase the validity of a study

These sources are likely to be stakeholders in a program - participants, other researchers, program staff, other community members, and so on.

Then we put all data in single framework & apply various statistical tools to find out the dynamic on the market.

During the analysis stage, feedback from the stakeholder groups would be compared to determine areas of agreement as well as areas of divergence

Additionally, after gathering mixed and scattered data from a wide range of sources, data is triangulated and correlated to come up with estimated figures which are further validated through primary mediums or industry experts, opinion leaders.

About Report Pinnacle

Report Pinnacle provides top-tier market research, industry intelligence, and actionable insights for finance, technology, healthcare, and consumer sectors. Our reports empower you to make informed decisions and achieve business success.

Our expert team combines primary research, data analytics, and industry knowledge to deliver insights you can trust. We offer syndicated reports, custom research, and consulting services tailored to your unique business needs.

At Report Pinnacle, we are committed to quality, transparency, and client satisfaction. Every report is rigorously validated to ensure accuracy and relevance. Our global perspective and local expertise help you understand both broad trends and detailed market shifts.

Stay ahead with Report Pinnacle. Subscribe to our newsletter for the latest insights and research highlights, and follow us on social media for real-time updates.

Report Pinnacle – Your Partner for Reaching the Top in Market Intelligence.

artwork spiralartwork spiralRelated Reports
artwork underline

UAE Medical Aesthetic Devices Market 2025-2033 Analysis: Trends, Competitor Dynamics, and Growth Opportunities

Discover the booming UAE Medical Aesthetic Devices market! This in-depth analysis reveals key trends, growth drivers (like rising disposable incomes and medical tourism), and leading players in the sector. Explore market size projections, segment breakdowns (energy-based, non-energy-based devices), and future opportunities.

September 2025
Base Year: 2024
No Of Pages: 234
Price: $4750

Protein Stability Analysis Market Industry’s Future Growth Prospects

The Protein Stability Analysis market is booming, projected to reach $XX million by 2033 with a CAGR of 8.40%. Discover key trends, leading companies (Horiba, PerkinElmer, Thermo Fisher), and market segmentation in our comprehensive analysis. Learn how advancements in techniques like chromatography and spectroscopy are driving growth.

September 2025
Base Year: 2024
No Of Pages: 234
Price: $4750

Unlocking the Future of US Veterinary Healthcare Industry: Growth and Trends 2025-2033

The US veterinary healthcare market is booming, projected to reach nearly $50 billion by 2033 with a 5% CAGR. Discover key drivers, trends, and market segments impacting growth in this dynamic industry, including pet humanization, advanced diagnostics, and therapeutic innovations. Learn about leading companies and regional market shares.

September 2025
Base Year: 2024
No Of Pages: 197
Price: $3800

Laboratory Gas Generators Market Market’s Consumer Preferences: Trends and Analysis 2025-2033

The Laboratory Gas Generators Market is booming, projected to reach $504.22 million in 2025, with a CAGR of 6.59% through 2033. Driven by increasing R&D and cost-efficiency needs, this market offers opportunities across various segments including nitrogen, hydrogen, and zero-air generators. Explore key trends and leading companies in this expanding sector.

September 2025
Base Year: 2024
No Of Pages: 234
Price: $4750

Combination Drugs Industry for Diabetes Competitor Insights: Trends and Opportunities 2025-2033

The global market for combination diabetes drugs is booming, projected to reach $1.09B in 2025 and grow at a CAGR of 10.87% through 2033. Learn about key market drivers, leading companies (Novo Nordisk, Sanofi, Merck), regional trends, and the future of this rapidly expanding sector.

September 2025
Base Year: 2024
No Of Pages: 234
Price: $4750

Neuroendoscopy Market Future-proof Strategies: Trends, Competitor Dynamics, and Opportunities 2025-2033

The neuroendoscopy market is booming, projected to reach \$5.08 Billion by 2033, driven by minimally invasive surgeries & technological advancements. Explore market trends, regional analysis, key players (Schindler, Machida, Adeor), and growth forecasts for rigid & flexible neuroendoscopes in our comprehensive report.

September 2025
Base Year: 2024
No Of Pages: 234
Price: $4750

Pharmaceutical Market in Netherlands 2025 Market Trends and 2033 Forecasts: Exploring Growth Potential

Discover the latest insights into the booming Netherlands pharmaceutical market. Explore key trends, growth drivers, and major players shaping this dynamic sector, including market size projections to 2033 and segment analysis by therapeutic area and dispensing method.

September 2025
Base Year: 2024
No Of Pages: 197
Price: $3800

Mexico Ophthalmic Devices Market: Growth Opportunities and Competitive Landscape Overview 2025-2033

Discover the booming Mexico ophthalmic devices market! This comprehensive analysis reveals market size, CAGR, key drivers, trends, and restraints, featuring insights into surgical, diagnostic, and vision correction devices. Learn about leading companies and forecast trends through 2033.

August 2025
Base Year: 2024
No Of Pages: 197
Price: $3800

Inflation Devices Market Projected to Grow at XX CAGR: Insights and Forecasts 2025-2033

The Inflation Devices Market is booming, projected to reach $XX million by 2033 with a 4.70% CAGR. Driven by rising cardiovascular disease prevalence and minimally invasive procedures, this market analysis covers key segments (Interventional Cardiology, Digital Displays etc.), major players (Boston Scientific, Medtronic etc.), and regional trends. Discover growth opportunities and competitive landscape insights.

August 2025
Base Year: 2024
No Of Pages: 234
Price: $4750

Comprehensive Review of Veterinary Laser Industry Growth Potential

The veterinary laser therapy market is booming, with an 8.30% CAGR. Discover key trends, applications (pain management, tissue repair), leading companies, and regional insights for this rapidly growing sector in our comprehensive market analysis. Explore the future of animal healthcare with laser technology.

August 2025
Base Year: 2024
No Of Pages: 234
Price: $4750

Understanding Consumer Behavior in Global Artificial Intelligence in Diagnostics Market Market: 2025-2033

The Global AI in Diagnostics Market is booming, with a 33.14% CAGR. Learn about key drivers, trends, and the leading companies shaping this transformative sector, including AI-powered image analysis for cardiology, oncology, and neurology. Explore market size projections, regional breakdowns, and the future of AI in healthcare diagnostics.

August 2025
Base Year: 2024
No Of Pages: 234
Price: $4750

Large Volume Parenteral Industry Industry Insights and Forecasts

Discover the booming Large Volume Parenteral (LVP) market trends and projections for 2025-2033. This in-depth analysis reveals market size, CAGR, key drivers, restraints, regional insights, and competitive landscape, featuring major players like Fresenius Kabi and Baxter. Explore segmentations by volume, application, and packaging.

August 2025
Base Year: 2024
No Of Pages: 234
Price: $4750

Meglitinide Market in Europe Projected to Grow at XX CAGR: Insights and Forecasts 2025-2033

Discover the latest insights on the European meglitinide market. This comprehensive analysis reveals market size, growth projections (CAGR 2.30%), key players (Novo Nordisk, Boehringer Ingelheim, etc.), and regional trends. Learn about market drivers, restraints, and future growth opportunities in this dynamic sector.

August 2025
Base Year: 2024
No Of Pages: 234
Price: $4750

Emerging Markets for Germicidal Irradiation Market Industry

Discover the booming germicidal irradiation market! This in-depth analysis reveals a CAGR of 8.90% driven by rising healthcare infections & technological advancements. Explore market segmentation, key players (Volcano Corporation, Halma PLC, GE Healthcare), and regional trends in North America, Europe, and Asia-Pacific. Get insights for 2025-2033.

August 2025
Base Year: 2024
No Of Pages: 234
Price: $4750

Asia-Pacific Artificial Organs and Bionic Implants Market’s Role in Shaping Industry Trends 2025-2033

The Asia-Pacific artificial organs and bionic implants market is booming, projected to reach $7.59 billion by 2025, with an 8.10% CAGR. Discover key trends, drivers, and leading companies shaping this rapidly growing sector. Explore market analysis and future projections for artificial hearts, kidneys, bionics, and more.

August 2025
Base Year: 2024
No Of Pages: 234
Price: $4750

Growth Catalysts in Wearable Tracking Devices Market Market

The Wearable Tracking Devices market is booming, projected to reach [estimated 2033 market size] by 2033, with a CAGR of 15.6%. Discover key trends, leading companies (Fitbit, Apple, Samsung), and regional insights in this comprehensive market analysis. Explore the growth drivers, restraints, and segments shaping this dynamic industry.

August 2025
Base Year: 2024
No Of Pages: 234
Price: $4750

Emerging Market Insights in APAC Remote Patient Monitoring Systems Industry: 2025-2033 Overview

The APAC Remote Patient Monitoring (RPM) market is booming, projected to reach $3.5 Billion by 2033, driven by rising chronic diseases, technological advancements, and government initiatives. Explore key market trends, leading companies, and growth opportunities in this comprehensive analysis.

August 2025
Base Year: 2024
No Of Pages: 100
Price: $4750

Enzyme Inhibitors Drugs Industry in North America: Market Dynamics and Forecasts 2025-2033

Discover the latest market analysis on Enzyme Inhibitors Drugs, a rapidly expanding sector with a projected CAGR of 3.95%. This comprehensive report explores market size, drivers, trends, restraints, and key players, covering segments like PPIs, Protease Inhibitors, and regional breakdowns. Learn about growth opportunities and challenges in this vital pharmaceutical market.

August 2025
Base Year: 2024
No Of Pages: 234
Price: $4750

Poultry Vaccines Industry Competitive Strategies: Trends and Forecasts 2025-2033

The global poultry vaccines market is booming, projected to reach [estimated 2033 market size based on CAGR] by 2033, driven by rising poultry consumption, emerging diseases like Avian Influenza, and advancements in vaccine technology. Learn about market trends, key players (Zoetis, Elanco, Merck), and regional growth in our comprehensive analysis.

August 2025
Base Year: 2024
No Of Pages: 234
Price: $4750

Emerging Markets for North America Lab-on-a-Chip Industry Industry

The North American lab-on-a-chip market is booming, projected to reach $X million by 2033, driven by advancements in diagnostics, drug discovery, and personalized medicine. Explore market trends, key players, and growth opportunities in this dynamic sector.

August 2025
Base Year: 2024
No Of Pages: 150
Price: $4750

Particle Therapy Market in Developing Economies: Trends and Growth Analysis 2025-2033

The global particle therapy market is booming, projected at a 7.60% CAGR through 2033. Discover key drivers, trends, and restraints shaping this dynamic sector, including proton therapy, heavy ion therapy, and regional market analysis. Learn about leading companies and the future of cancer treatment innovation.

August 2025
Base Year: 2024
No Of Pages: 234
Price: $4750

Comprehensive Overview of France Self-Monitoring Blood Glucose Devices Market Trends: 2025-2033

Discover the booming France self-monitoring blood glucose (SMBG) devices market! This comprehensive analysis reveals a €532 million market in 2025, projected to grow at a CAGR of 7.18% until 2033. Explore key drivers, trends, restraints, and leading companies shaping this dynamic sector. Learn more about glucometer devices, test strips, and lancets.

August 2025
Base Year: 2024
No Of Pages: 100
Price: $3800

Consumer Behavior and Diabetes Drugs Market in Italy Trends

Discover the latest market analysis of the Italian diabetes drugs market (2025-2033). Explore key growth drivers, including rising diabetes prevalence and innovative drug therapies, alongside market restraints and detailed segmentation. Learn about the leading pharmaceutical companies and projected market size.

August 2025
Base Year: 2024
No Of Pages: 197
Price: $3800

Decoding UK Artificial Organs & Bionic Implants Market’s Market Size Potential by 2033

Discover the UK's thriving artificial organs & bionic implants market, projected to reach £174 million by 2033. Explore market drivers, trends, and challenges shaping this innovative sector, including key players like Medtronic and Edwards Lifesciences.

August 2025
Base Year: 2024
No Of Pages: 197
Price: $3800

Hematology Analyzers Industry Competitive Advantage: Trends and Opportunities to 2033

The global hematology analyzers market is booming, projected to reach $11.1 billion by 2033, driven by rising blood disorder prevalence, technological advancements, and an aging population. Explore market trends, key players (Siemens, Abbott, Roche), and regional growth in this detailed analysis.

August 2025
Base Year: 2024
No Of Pages: 150
Price: $4750

Patient Recliners Market Competitive Advantage: Trends and Opportunities to 2033

The global Patient Recliners Market is booming, projected to reach [estimated market size in 2033] by 2033, with a CAGR of 12.50%. Driven by aging populations and advancements in healthcare technology, this market offers lucrative opportunities for investors and industry players. Learn about key trends, leading companies, and regional growth projections.

August 2025
Base Year: 2024
No Of Pages: 234
Price: $4750

Australia Endoscopic Spinal Surgery Industry Industry Overview and Projections

Discover the booming Australian endoscopic spinal surgery market! This report reveals a $384.82M market in 2025, projecting strong growth to 2033. Explore key drivers, trends, restraints, and leading companies shaping this minimally invasive surgery sector.

August 2025
Base Year: 2024
No Of Pages: 197
Price: $3800

Europe Epigenetics Industry Future-Proofing Growth: Strategic Insights and Analysis 2025-2033

The European epigenetics market is booming, with a projected CAGR of 14.50% through 2033. This in-depth analysis explores market size, key drivers (cancer diagnostics, technological advancements), restraints, segmentation (by technology, product, application), and leading companies. Discover the growth potential in oncology, non-oncology applications, and key European regions.

August 2025
Base Year: 2024
No Of Pages: 234
Price: $4750

Unveiling Global Dental Bone Void Filler Market Growth Patterns: CAGR Analysis and Forecasts 2025-2033

The global dental bone void filler market is booming, projected to reach [estimated market size in 2033] by 2033, driven by rising dental procedures and advancements in biomaterials. Explore market trends, leading companies (DePuy Synthes, Medtronic), and regional analysis in this comprehensive market report. Learn about tricalcium phosphate, biphasic calcium phosphate, and calcium phosphate cement segments.

August 2025
Base Year: 2024
No Of Pages: 234
Price: $4750

Middle East and Africa CT Market Strategic Market Roadmap: Analysis and Forecasts 2025-2033

Discover the booming Middle East & Africa CT scan market. This in-depth analysis reveals key trends, drivers, and challenges impacting growth through 2033, including market size projections, CAGR, and segment performance. Learn more about key players and regional variations.

August 2025
Base Year: 2024
No Of Pages: 234
Price: $4750

Global Cannabis Testing Lab Market Trends: Region-Specific Insights 2025-2033

The global cannabis testing lab market is booming, projected to reach $3.05 billion by 2033 with a 13.12% CAGR. This report analyzes market size, growth drivers (regulation, consumer demand), restraints, and key players across North America, Europe, and Asia-Pacific. Discover segment trends in potency testing, terpene profiling, and more.

August 2025
Base Year: 2024
No Of Pages: 234
Price: $4750

Australia Drug Delivery Devices Market 2025-2033 Overview: Trends, Competitor Dynamics, and Opportunities

Discover the booming Australian drug delivery devices market! This in-depth analysis reveals a CAGR of 5.10% (2025-2033), driven by chronic disease prevalence and technological advancements. Explore market segmentation, key players (Becton Dickinson, Bayer, Novartis, etc.), and future growth projections.

August 2025
Base Year: 2024
No Of Pages: 197
Price: $3800

Holter Monitor Market Future Pathways: Strategic Insights to 2033

The Holter Monitor Market is booming, projected to reach [estimated 2033 market size] by 2033, driven by technological advancements, rising cardiovascular disease prevalence, and increasing demand for remote patient monitoring. This comprehensive analysis explores market size, CAGR, key players (Medtronic, GE Healthcare, Philips), and regional trends. Learn more!

August 2025
Base Year: 2024
No Of Pages: 234
Price: $4750

Growth Roadmap for Ophthalmic Ultrasound Systems Market Market 2025-2033

The Ophthalmic Ultrasound Systems Market is booming, projected to reach [estimated 2033 market size] by 2033, driven by rising age-related eye diseases and technological advancements. Discover key trends, leading companies, and regional insights in this comprehensive market analysis.

August 2025
Base Year: 2024
No Of Pages: 150
Price: $4750

Laser Therapy Industry: Growth Opportunities and Competitive Landscape Overview 2025-2033

The global laser therapy market is booming, projected to reach \$528.4 million by 2033 with a CAGR of 10.31%. Discover key trends, applications (wound care, pain management, cosmetics), leading companies, and regional insights in this comprehensive market analysis.

August 2025
Base Year: 2024
No Of Pages: 234
Price: $4750

Consumer-Driven Trends in Animal Parasiticide Market Market

The global animal parasiticide market is booming, projected to reach \$16.1 billion by 2033, driven by rising pet ownership and livestock farming. Learn about market trends, key players (Bayer, Zoetis, Merck), and regional growth in this in-depth analysis.

August 2025
Base Year: 2024
No Of Pages: 234
Price: $4750

Strategic Insights for Portable Blood Gas Analyzer Industry Market Expansion

The portable blood gas analyzer market is booming, driven by point-of-care testing and technological advancements. Learn about market size, growth projections (2025-2033), key players (Danaher, Abbott, Siemens), regional trends, and the impact of chronic disease prevalence. Discover the latest insights into this rapidly evolving sector.

August 2025
Base Year: 2024
No Of Pages: 150
Price: $4750

Strategic Vision for Sweden Cardiovascular Devices Market Market Expansion

The Sweden Cardiovascular Devices Market is booming, projected to reach €456 million by 2033 with a 4.20% CAGR. Driven by an aging population and advancements in minimally invasive procedures, key players like Medtronic and Siemens Healthineers are shaping this growing sector. Discover market trends and insights now!

August 2025
Base Year: 2024
No Of Pages: 120
Price: $3800

Flexible Endoscopes Market Consumer Behavior Dynamics: Key Trends 2025-2033

The flexible endoscopes market is booming, projected to reach $11.9 Billion by 2033, driven by technological advancements, increasing prevalence of chronic diseases, and a growing geriatric population. Explore market trends, segmentation, key players, and regional analysis in this comprehensive report.

August 2025
Base Year: 2024
No Of Pages: 234
Price: $4750

Analyzing Competitor Moves: Corneal Topographers Market Growth Outlook 2025-2033

The Corneal Topographers Market is booming, projected to surpass $250 million by 2033, driven by technological advancements and rising prevalence of refractive errors. Explore market trends, key players (Aeon Imaging, Medmont, Zeiss), and regional insights in this comprehensive analysis.

August 2025
Base Year: 2024
No Of Pages: 234
Price: $4750

Exploring Key Trends in Healthcare Additive Manufacturing (3D Printing) Industry Market

Discover the explosive growth of the Healthcare Additive Manufacturing (3D Printing) market! Learn about key trends, leading companies, and the future of personalized medicine through 3D-printed medical devices, implants, and prosthetics. Explore market size, CAGR, and regional analysis for 2025-2033.

August 2025
Base Year: 2024
No Of Pages: 234
Price: $4750

Italy Nuclear Imaging Market Market’s Consumer Preferences: Trends and Analysis 2025-2033

Discover the growth trajectory of Italy's nuclear imaging market, projected to reach €308.68 million by 2033. This comprehensive analysis explores market drivers, restraints, and key players like Fujifilm, Siemens Healthineers, and Bracco, focusing on PET/SPECT applications and equipment advancements.

August 2025
Base Year: 2024
No Of Pages: 197
Price: $3800

Comprehensive Insights into Medication Management System Market: Trends and Growth Projections 2025-2033

The Medication Management System (MMS) market is booming, projected to reach $3.12 billion by 2025, with an 11.10% CAGR. Discover key drivers, trends, and restraints shaping this rapidly evolving sector, including CPOE, CDSS, and eMAR solutions. Explore market segmentation, leading companies, and regional insights in this comprehensive analysis.

August 2025
Base Year: 2024
No Of Pages: 150
Price: $4750

Future Forecasts for Hemodynamic Monitoring Devices Market Industry Growth

The global hemodynamic monitoring devices market is booming, projected to reach [estimated 2033 market size] by 2033, driven by technological advancements, aging populations, and rising chronic disease prevalence. Explore market trends, segmentation, key players (Smiths Medical, Masimo, etc.), and regional insights in this comprehensive analysis.

August 2025
Base Year: 2024
No Of Pages: 234
Price: $4750

Global Bone Cement Market Decade Long Trends, Analysis and Forecast 2025-2033

The global bone cement market is booming, projected to reach $XX million by 2033 with a 6.50% CAGR. Driven by rising orthopedic surgeries & aging populations, this market analysis explores key trends, restraints, and leading companies like Johnson & Johnson, Stryker, and Zimmer Biomet, across key regions including North America and Europe. Discover the future of bone cement technology.

August 2025
Base Year: 2024
No Of Pages: 234
Price: $4750

Emerging Markets Driving Veterinary Reference Labs Market Growth

The global veterinary reference labs market is booming, projected to reach \$10.9 billion by 2033, driven by rising pet ownership and advanced diagnostic technologies. Explore market trends, key players (IDEXX, Zoetis), regional insights, and growth opportunities in this comprehensive analysis.

August 2025
Base Year: 2024
No Of Pages: 234
Price: $4750

Powered Surgical Instrument Market and Emerging Technologies: Growth Insights 2025-2033

Discover the booming powered surgical instruments market! This comprehensive analysis reveals a $2.19B market (2025) projected to reach [estimated 2033 value based on CAGR] by 2033, driven by minimally invasive surgery & technological advancements. Explore market segmentation, key players (Johnson & Johnson, Medtronic, etc.), and regional insights for North America, Europe, and Asia Pacific.

August 2025
Base Year: 2024
No Of Pages: 234
Price: $4750

MEA Sodium-dependent Glucose Co-transporter 2 Inhibitors Market XX CAGR Growth Analysis 2025-2033

The MEA Sodium-dependent Glucose Co-transporter 2 (SGLT2) Inhibitors market is poised for significant growth, driven by rising diabetes prevalence and expanding healthcare infrastructure. Discover key trends, market size projections (2025-2033), and competitive landscape analysis in this comprehensive market report.

August 2025
Base Year: 2024
No Of Pages: 234
Price: $4750

South Korea Oral Anti-Diabetic Drug Market Market’s Consumer Landscape: Insights and Trends 2025-2033

Discover the dynamic South Korea oral anti-diabetic drug market analysis. Explore key growth drivers, market segmentation (SGLT-2 inhibitors, DPP-4 inhibitors, etc.), leading companies (Merck, Pfizer, Novo Nordisk), and future trends (2025-2033) impacting this expanding sector. Learn about the rising prevalence of diabetes and the implications for market expansion in South Korea.

August 2025
Base Year: 2024
No Of Pages: 234
Price: $4750

Implantable Drug Delivery System Industry Trends and Forecast 2025-2033

The Implantable Drug Delivery System market is booming, projected to reach $XX million by 2033, driven by chronic disease prevalence and technological advancements. Learn about market trends, key players (like Medtronic, Boston Scientific), and regional growth in our comprehensive analysis.

August 2025
Base Year: 2024
No Of Pages: 234
Price: $4750

Business Address

Head Office

Ansec House 3 rd floor Tank Road, Yerwada, Pune, Maharashtra 411014

Contact Information

Craig Francis

Business Development Head

+17162654855

[email protected]

Secure Payment Partners

payment image
RetailLogisticsPackagingAutomotiveHealthcareAgricultureEnergy & PowerFood & BeverageAerospace & DefenseChemicals & MaterialsHospitality and TourismAnimal Nutrition & WellnessConsumer Goods and ServicesReal Estate and ConstructionHome and Property ImprovementTechnology, Media and TelecomManufacturing Products and ServicesFinancial Services and Investment Intelligence

© 2025 PRDUA Research & Media Private Limited, All rights reserved

Privacy Policy
Terms and Conditions
FAQ
  • Home
  • About Us
  • Industries
    • Aerospace & Defense
    • Agriculture
    • Animal Nutrition & Wellness
    • Automotive
    • Chemicals & Materials
    • Consumer Goods and Services
    • Energy & Power
    • Financial Services and Investment Intelligence
    • Food & Beverage
    • Home and Property Improvement
    • Hospitality and Tourism
    • Logistics
    • Manufacturing Products and Services
    • Packaging
    • Professional and Commercial Services
    • Real Estate and Construction
    • Retail
    • Technology, Media and Telecom
    • Healthcare
  • Services
  • Contact
Main Logo
  • Home
  • About Us
  • Industries
    • Aerospace & Defense
    • Agriculture
    • Animal Nutrition & Wellness
    • Automotive
    • Chemicals & Materials
    • Consumer Goods and Services
    • Energy & Power
    • Financial Services and Investment Intelligence
    • Food & Beverage
    • Home and Property Improvement
    • Hospitality and Tourism
    • Logistics
    • Manufacturing Products and Services
    • Packaging
    • Professional and Commercial Services
    • Real Estate and Construction
    • Retail
    • Technology, Media and Telecom
    • Healthcare
  • Services
  • Contact
+17162654855
[email protected]

+17162654855

[email protected]