Laboratory Chemicals Market Navigating Dynamics Comprehensive Analysis and Forecasts 2025-2033

Laboratory Chemicals Market by Production Analysis, by Consumption Analysis, by Import Market Analysis (Value & Volume), by Export Market Analysis (Value & Volume), by Price Trend Analysis, by Asia Pacific (China, India, Japan, South Korea, Rest of Asia Pacific), by North America (United States, Canada, Mexico), by Europe (Germany, United Kingdom, Italy, France, Spain, Rest of Europe), by South America (Brazil, Argentina, Rest of South America), by Middle East and Africa (Saudi Arabia, South Africa, USE, Rest of Middle East and Africa) Forecast 2025-2033

Jun 24 2025
Base Year: 2024

180 Pages
Main Logo

Laboratory Chemicals Market Navigating Dynamics Comprehensive Analysis and Forecasts 2025-2033


Home
Industries
Chemicals & Materials
sponsor image
sponsor image
sponsor image
sponsor image

Tailored for you

  • In-depth Analysis Tailored to Specified Regions or Segments
  • Company Profiles Customized to User Preferences
  • Comprehensive Insights Focused on Specific Segments or Regions
  • Customized Evaluation of Competitive Landscape to Meet Your Needs
  • Tailored Customization to Address Other Specific Requirements
Ask for customization


Key Insights

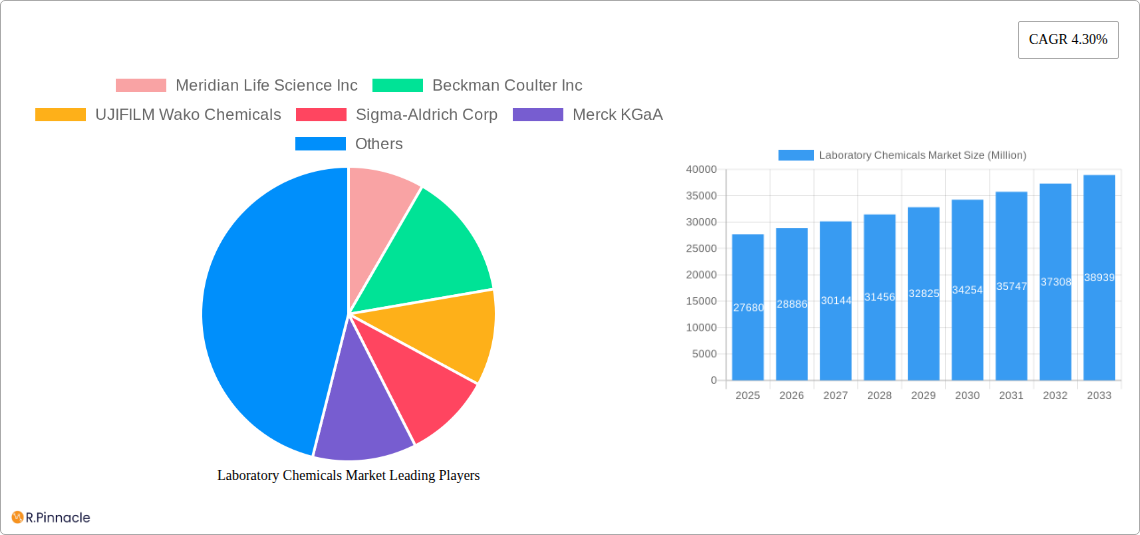
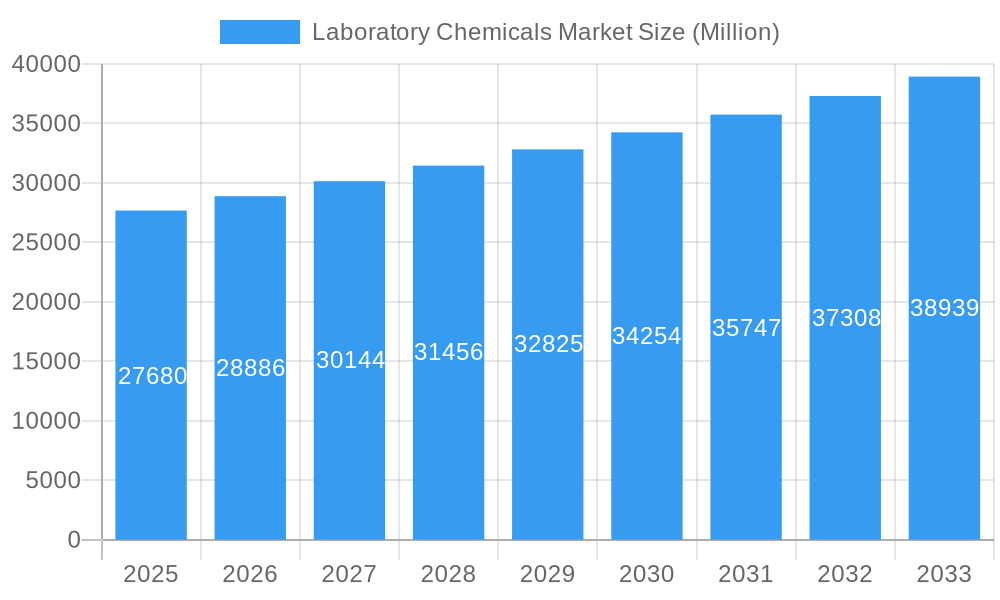
The global laboratory chemicals market, valued at $27.68 billion in 2025, is projected to experience robust growth, driven by a compound annual growth rate (CAGR) of 4.30% from 2025 to 2033. This expansion is fueled by several key factors. The burgeoning pharmaceutical and biotechnology industries necessitate extensive research and development, significantly increasing demand for high-purity chemicals used in drug discovery, formulation, and quality control. Simultaneously, the growing emphasis on environmental monitoring and food safety testing contributes to a consistent demand for analytical and diagnostic chemicals. Advancements in analytical techniques, such as mass spectrometry and chromatography, are also driving market growth by enabling more sophisticated and sensitive testing procedures. The increasing prevalence of chronic diseases globally further boosts demand for diagnostic and therapeutic chemicals in healthcare settings. Furthermore, the expansion of academic research institutions and government-funded research programs contributes to the overall market growth by fostering innovation and technological advancements. Competitive pricing and ongoing product development further bolster the market’s expansion.

Segment-wise, the molecular biology and immunochemistry application segments are expected to dominate the market due to their crucial role in various research and diagnostic applications. Geographically, North America and Europe currently hold significant market shares, driven by well-established research infrastructure and a strong pharmaceutical industry presence. However, the Asia-Pacific region is poised for rapid growth, propelled by increasing healthcare spending and expanding research capabilities in countries like China and India. While challenges like stringent regulatory requirements and potential supply chain disruptions exist, the overall positive market outlook remains strong, projecting continued expansion throughout the forecast period (2025-2033). The presence of numerous key players such as Merck KGaA, Sigma-Aldrich Corp, and Beckman Coulter Inc, ensures market competitiveness and fosters innovation in product development.

Laboratory Chemicals Market Research Report - Market Size, Growth & Forecast

Laboratory Chemicals Market: A Comprehensive Report (2019-2033)

This comprehensive report provides an in-depth analysis of the Laboratory Chemicals Market, offering invaluable insights for industry professionals, investors, and researchers. Covering the period from 2019 to 2033, with a focus on 2025, this study unveils the market's structure, dynamics, dominant segments, and future outlook. The report leverages extensive data analysis to provide actionable intelligence and forecast market trends accurately.

Laboratory Chemicals Market Structure & Innovation Trends

This section analyzes the competitive landscape of the Laboratory Chemicals Market, examining market concentration, innovation drivers, regulatory influences, and strategic activities such as mergers and acquisitions (M&A). The report assesses the market share of key players like Meridian Life Science Inc, Beckman Coulter Inc, UJIFILM Wako Chemicals, Sigma-Aldrich Corp, Merck KGaA, and others, revealing the level of market consolidation. The analysis includes a review of recent M&A activities, quantifying deal values where possible (e.g., XX Million in deals closed in 2024). Furthermore, it explores innovation drivers, including technological advancements in analytical techniques and the emergence of new chemical compounds. Regulatory frameworks impacting the market, potential product substitutes, and end-user demographics are also thoroughly investigated. The influence of government policies and funding on research and development will be examined, along with the impact of evolving consumer preferences (e.g., demand for sustainable and environmentally friendly products). The report also explores the impact of technological advancements, such as automation and AI, on market dynamics, and the strategies adopted by key players to maintain competitive advantages. Finally, the report concludes with an overall assessment of the market's competitive intensity and its future trajectory.

Laboratory Chemicals Market Growth

Laboratory Chemicals Market Dynamics & Trends

This section delves into the key drivers shaping the Laboratory Chemicals Market's growth trajectory from 2019 to 2033. The report analyzes market growth drivers, encompassing factors such as increasing research and development activities across various sectors (healthcare, pharmaceuticals, environmental monitoring, etc.), growing demand for advanced analytical techniques, and expanding applications of laboratory chemicals in diverse industries. Technological disruptions, including the introduction of novel analytical instruments and automation technologies, are also meticulously examined, along with their impact on market penetration and growth rates. Furthermore, evolving consumer preferences, particularly the growing emphasis on product safety, quality, and sustainability, are carefully considered. The report will project a Compound Annual Growth Rate (CAGR) of xx% for the forecast period (2025-2033), with a specific emphasis on market penetration rates in key segments. Competitive dynamics, including pricing strategies, product differentiation, and market share shifts, are comprehensively analyzed to provide a holistic understanding of market trends.

Laboratory Chemicals Market Growth

Dominant Regions & Segments in Laboratory Chemicals Market

This section identifies the leading regions and segments within the Laboratory Chemicals Market. Dominant regions will be analyzed for their contribution to overall market revenue, considering factors such as economic growth, research infrastructure, and government policies. Key segments (Application: Industrial, Academia/Educational, Government, Healthcare (Pharmaceutical); Type: Molecular Biology, Cytokine and Chemokine Testing, Carbohydrate Analysis, Immunochemistry, Cell/Tissue Culture, Environmental Testing, Biochemistry, Other Types) will be assessed for their relative market shares and growth trajectories.

  • Key Drivers (Examples):
    • Healthcare (Pharmaceutical): Increased pharmaceutical R&D spending, stringent regulatory requirements for drug development, and the rise of personalized medicine.
    • Industrial: Growth in manufacturing sectors requiring quality control and process optimization, increased demand for specialized chemicals for specific industrial applications.
    • Molecular Biology: Advancements in genetic engineering, increasing adoption of genomics and proteomics research, and the growing need for high-purity reagents.

The report will provide a detailed analysis of the dominance of each region and segment based on quantitative data and qualitative insights. This includes factors like infrastructure development in research facilities, economic policies supportive of scientific innovation, and presence of major market players.

Laboratory Chemicals Market Product Innovations

This section will highlight recent product developments, emphasizing technological advancements and their impact on market competitiveness. This includes discussions of novel chemical compounds with enhanced performance characteristics, innovative analytical techniques, and automation in laboratory processes. The analysis will showcase the market fit of these innovations, assessing their adoption rates and market potential.

Report Scope & Segmentation Analysis

This report provides a detailed segmentation analysis of the Laboratory Chemicals Market, categorized by application (Industrial, Academia/Educational, Government, Healthcare (Pharmaceutical)) and type (Molecular Biology, Cytokine and Chemokine Testing, Carbohydrate Analysis, Immunochemistry, Cell/Tissue Culture, Environmental Testing, Biochemistry, Other Types). Each segment's market size, growth projections, and competitive dynamics will be assessed separately. For example, the Healthcare (Pharmaceutical) segment will be analyzed in terms of its contribution to overall market revenue, its growth rate, and the competitive landscape within that specific segment. This detailed breakdown will be replicated for each application and type segment.

Key Drivers of Laboratory Chemicals Market Growth

The growth of the Laboratory Chemicals Market is driven by several key factors. Technological advancements, such as the development of new analytical techniques and automation tools, significantly improve efficiency and accuracy in laboratory settings, fueling demand for specialized chemicals. Economic growth in various sectors, particularly healthcare and pharmaceuticals, leads to increased R&D spending, thereby driving up the demand for laboratory chemicals. Favorable regulatory frameworks and government policies supporting scientific research and development also contribute to market growth. Specific examples of these drivers will be provided in the report.

Challenges in the Laboratory Chemicals Market Sector

The Laboratory Chemicals Market faces several challenges. Stringent regulatory hurdles and compliance requirements related to chemical safety and environmental protection can increase costs and complexity for manufacturers. Supply chain disruptions and fluctuations in raw material prices can impact profitability. Intense competition among established players and emerging companies can put pressure on pricing and margins. These challenges, along with their quantifiable impact on market growth, will be comprehensively discussed.

Emerging Opportunities in Laboratory Chemicals Market

Despite the challenges, significant opportunities exist for growth. Emerging markets in developing countries present substantial potential for expansion. Advancements in nanotechnology and biotechnology create opportunities for the development of innovative laboratory chemicals with enhanced functionalities. Growing demand for personalized medicine and point-of-care diagnostics further fuels opportunities in specialized chemical reagents and kits.

Leading Players in the Laboratory Chemicals Market Market

  • Meridian Life Science Inc
  • Beckman Coulter Inc
  • UJIFILM Wako Chemicals
  • Sigma-Aldrich Corp
  • Merck KGaA
  • Mitsubishi Rayon Co Ltd
  • GE Healthcare
  • BD BioScience
  • Carlo Erba Reagents SRL
  • Avantor Inc
  • PerkinElmer Inc
  • ITW Reagents Division
  • Morphisto GmbH
  • BiosYnth SRL
  • R&D Systems

Key Developments in Laboratory Chemicals Market Industry

  • [Month, Year]: Company X launches a new line of high-purity reagents for molecular biology applications.
  • [Month, Year]: Company Y acquires Company Z, expanding its product portfolio and market reach.
  • [Month, Year]: New regulatory guidelines on chemical handling and disposal are implemented. (Specific details will be included)

(Further key developments will be documented in the full report.)

Future Outlook for Laboratory Chemicals Market Market

The Laboratory Chemicals Market is poised for continued growth, driven by persistent demand from research and development activities across various sectors. Strategic partnerships and collaborations among market players are anticipated to further drive innovation. Focus on developing sustainable and environmentally friendly products will shape future market trends. This report provides a detailed forecast of market growth, potential opportunities, and challenges, enabling informed strategic decision-making.

Laboratory Chemicals Market Segmentation

  • 1. Production Analysis
  • 2. Consumption Analysis
  • 3. Import Market Analysis (Value & Volume)
  • 4. Export Market Analysis (Value & Volume)
  • 5. Price Trend Analysis

Laboratory Chemicals Market Segmentation By Geography

  • 1. Asia Pacific
    • 1.1. China
    • 1.2. India
    • 1.3. Japan
    • 1.4. South Korea
    • 1.5. Rest of Asia Pacific
  • 2. North America
    • 2.1. United States
    • 2.2. Canada
    • 2.3. Mexico
  • 3. Europe
    • 3.1. Germany
    • 3.2. United Kingdom
    • 3.3. Italy
    • 3.4. France
    • 3.5. Spain
    • 3.6. Rest of Europe
  • 4. South America
    • 4.1. Brazil
    • 4.2. Argentina
    • 4.3. Rest of South America
  • 5. Middle East and Africa
    • 5.1. Saudi Arabia
    • 5.2. South Africa
    • 5.3. USE
    • 5.4. Rest of Middle East and Africa
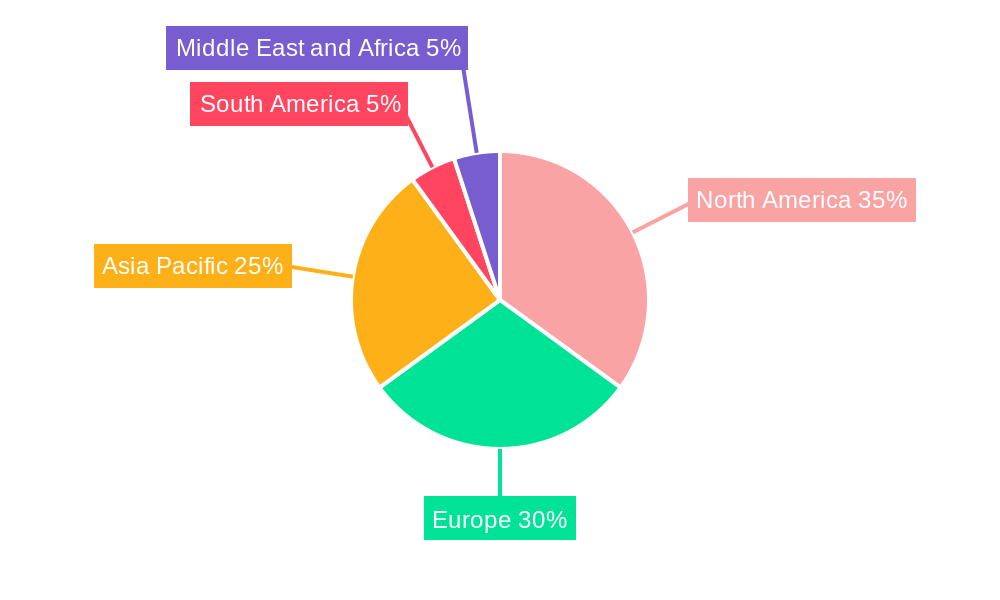
Laboratory Chemicals Market Regional Share


Laboratory Chemicals Market REPORT HIGHLIGHTS

AspectsDetails
Study Period 2019-2033
Base Year 2024
Estimated Year 2025
Forecast Period2025-2033
Historical Period2019-2024
Growth RateCAGR of 4.30% from 2019-2033
Segmentation
    • By Production Analysis
    • By Consumption Analysis
    • By Import Market Analysis (Value & Volume)
    • By Export Market Analysis (Value & Volume)
    • By Price Trend Analysis
  • By Geography
    • Asia Pacific
      • China
      • India
      • Japan
      • South Korea
      • Rest of Asia Pacific
    • North America
      • United States
      • Canada
      • Mexico
    • Europe
      • Germany
      • United Kingdom
      • Italy
      • France
      • Spain
      • Rest of Europe
    • South America
      • Brazil
      • Argentina
      • Rest of South America
    • Middle East and Africa
      • Saudi Arabia
      • South Africa
      • USE
      • Rest of Middle East and Africa


Table of Contents

  1. 1. Introduction
    • 1.1. Research Scope
    • 1.2. Market Segmentation
    • 1.3. Research Methodology
    • 1.4. Definitions and Assumptions
  2. 2. Executive Summary
    • 2.1. Introduction
  3. 3. Market Dynamics
    • 3.1. Introduction
      • 3.2. Market Drivers
        • 3.2.1. Growing R&D Activities in the Field of Biological and Chemical Sciences; Increasing Usage in Wastewater Treatment; Other Drivers
      • 3.3. Market Restrains
        • 3.3.1. Availability of Substitutes for Laboratory Chemicals; Other Restraints
      • 3.4. Market Trends
        • 3.4.1. Industrial Application to Witness the Higher Potential Growth
  4. 4. Market Factor Analysis
    • 4.1. Porters Five Forces
    • 4.2. Supply/Value Chain
    • 4.3. PESTEL analysis
    • 4.4. Market Entropy
    • 4.5. Patent/Trademark Analysis
  5. 5. Global Laboratory Chemicals Market Analysis, Insights and Forecast, 2019-2031
    • 5.1. Market Analysis, Insights and Forecast - by Production Analysis
      • 5.2. Market Analysis, Insights and Forecast - by Consumption Analysis
        • 5.3. Market Analysis, Insights and Forecast - by Import Market Analysis (Value & Volume)
          • 5.4. Market Analysis, Insights and Forecast - by Export Market Analysis (Value & Volume)
            • 5.5. Market Analysis, Insights and Forecast - by Price Trend Analysis
              • 5.6. Market Analysis, Insights and Forecast - by Region
                • 5.6.1. Asia Pacific
                • 5.6.2. North America
                • 5.6.3. Europe
                • 5.6.4. South America
                • 5.6.5. Middle East and Africa
            • 6. Asia Pacific Laboratory Chemicals Market Analysis, Insights and Forecast, 2019-2031
              • 6.1. Market Analysis, Insights and Forecast - by Production Analysis
                • 6.2. Market Analysis, Insights and Forecast - by Consumption Analysis
                  • 6.3. Market Analysis, Insights and Forecast - by Import Market Analysis (Value & Volume)
                    • 6.4. Market Analysis, Insights and Forecast - by Export Market Analysis (Value & Volume)
                      • 6.5. Market Analysis, Insights and Forecast - by Price Trend Analysis
                      • 7. North America Laboratory Chemicals Market Analysis, Insights and Forecast, 2019-2031
                        • 7.1. Market Analysis, Insights and Forecast - by Production Analysis
                          • 7.2. Market Analysis, Insights and Forecast - by Consumption Analysis
                            • 7.3. Market Analysis, Insights and Forecast - by Import Market Analysis (Value & Volume)
                              • 7.4. Market Analysis, Insights and Forecast - by Export Market Analysis (Value & Volume)
                                • 7.5. Market Analysis, Insights and Forecast - by Price Trend Analysis
                                • 8. Europe Laboratory Chemicals Market Analysis, Insights and Forecast, 2019-2031
                                  • 8.1. Market Analysis, Insights and Forecast - by Production Analysis
                                    • 8.2. Market Analysis, Insights and Forecast - by Consumption Analysis
                                      • 8.3. Market Analysis, Insights and Forecast - by Import Market Analysis (Value & Volume)
                                        • 8.4. Market Analysis, Insights and Forecast - by Export Market Analysis (Value & Volume)
                                          • 8.5. Market Analysis, Insights and Forecast - by Price Trend Analysis
                                          • 9. South America Laboratory Chemicals Market Analysis, Insights and Forecast, 2019-2031
                                            • 9.1. Market Analysis, Insights and Forecast - by Production Analysis
                                              • 9.2. Market Analysis, Insights and Forecast - by Consumption Analysis
                                                • 9.3. Market Analysis, Insights and Forecast - by Import Market Analysis (Value & Volume)
                                                  • 9.4. Market Analysis, Insights and Forecast - by Export Market Analysis (Value & Volume)
                                                    • 9.5. Market Analysis, Insights and Forecast - by Price Trend Analysis
                                                    • 10. Middle East and Africa Laboratory Chemicals Market Analysis, Insights and Forecast, 2019-2031
                                                      • 10.1. Market Analysis, Insights and Forecast - by Production Analysis
                                                        • 10.2. Market Analysis, Insights and Forecast - by Consumption Analysis
                                                          • 10.3. Market Analysis, Insights and Forecast - by Import Market Analysis (Value & Volume)
                                                            • 10.4. Market Analysis, Insights and Forecast - by Export Market Analysis (Value & Volume)
                                                              • 10.5. Market Analysis, Insights and Forecast - by Price Trend Analysis
                                                              • 11. Asia Pacific Laboratory Chemicals Market Analysis, Insights and Forecast, 2019-2031
                                                                  • 11.1. Market Analysis, Insights and Forecast - By Country/Sub-region
                                                                    • 11.1.1 China
                                                                    • 11.1.2 India
                                                                    • 11.1.3 Japan
                                                                    • 11.1.4 South Korea
                                                                    • 11.1.5 Rest of Asia Pacific
                                                              • 12. North America Laboratory Chemicals Market Analysis, Insights and Forecast, 2019-2031
                                                                  • 12.1. Market Analysis, Insights and Forecast - By Country/Sub-region
                                                                    • 12.1.1 United States
                                                                    • 12.1.2 Canada
                                                                    • 12.1.3 Mexico
                                                              • 13. Europe Laboratory Chemicals Market Analysis, Insights and Forecast, 2019-2031
                                                                  • 13.1. Market Analysis, Insights and Forecast - By Country/Sub-region
                                                                    • 13.1.1 Germany
                                                                    • 13.1.2 United Kingdom
                                                                    • 13.1.3 Italy
                                                                    • 13.1.4 France
                                                                    • 13.1.5 Spain
                                                                    • 13.1.6 Rest of Europe
                                                              • 14. South America Laboratory Chemicals Market Analysis, Insights and Forecast, 2019-2031
                                                                  • 14.1. Market Analysis, Insights and Forecast - By Country/Sub-region
                                                                    • 14.1.1 Brazil
                                                                    • 14.1.2 Argentina
                                                                    • 14.1.3 Rest of South America
                                                              • 15. Middle East and Africa Laboratory Chemicals Market Analysis, Insights and Forecast, 2019-2031
                                                                  • 15.1. Market Analysis, Insights and Forecast - By Country/Sub-region
                                                                    • 15.1.1 Saudi Arabia
                                                                    • 15.1.2 South Africa
                                                                    • 15.1.3 Rest of Middle East and Africa
                                                              • 16. Competitive Analysis
                                                                • 16.1. Global Market Share Analysis 2024
                                                                  • 16.2. Company Profiles
                                                                    • 16.2.1 Meridian Life Science Inc
                                                                      • 16.2.1.1. Overview
                                                                      • 16.2.1.2. Products
                                                                      • 16.2.1.3. SWOT Analysis
                                                                      • 16.2.1.4. Recent Developments
                                                                      • 16.2.1.5. Financials (Based on Availability)
                                                                    • 16.2.2 Beckman Coulter Inc
                                                                      • 16.2.2.1. Overview
                                                                      • 16.2.2.2. Products
                                                                      • 16.2.2.3. SWOT Analysis
                                                                      • 16.2.2.4. Recent Developments
                                                                      • 16.2.2.5. Financials (Based on Availability)
                                                                    • 16.2.3 UJIFILM Wako Chemicals
                                                                      • 16.2.3.1. Overview
                                                                      • 16.2.3.2. Products
                                                                      • 16.2.3.3. SWOT Analysis
                                                                      • 16.2.3.4. Recent Developments
                                                                      • 16.2.3.5. Financials (Based on Availability)
                                                                    • 16.2.4 Sigma-Aldrich Corp
                                                                      • 16.2.4.1. Overview
                                                                      • 16.2.4.2. Products
                                                                      • 16.2.4.3. SWOT Analysis
                                                                      • 16.2.4.4. Recent Developments
                                                                      • 16.2.4.5. Financials (Based on Availability)
                                                                    • 16.2.5 Merck KGaA
                                                                      • 16.2.5.1. Overview
                                                                      • 16.2.5.2. Products
                                                                      • 16.2.5.3. SWOT Analysis
                                                                      • 16.2.5.4. Recent Developments
                                                                      • 16.2.5.5. Financials (Based on Availability)
                                                                    • 16.2.6 Mitsubishi Rayon Co Ltd
                                                                      • 16.2.6.1. Overview
                                                                      • 16.2.6.2. Products
                                                                      • 16.2.6.3. SWOT Analysis
                                                                      • 16.2.6.4. Recent Developments
                                                                      • 16.2.6.5. Financials (Based on Availability)
                                                                    • 16.2.7 GE Healthcare
                                                                      • 16.2.7.1. Overview
                                                                      • 16.2.7.2. Products
                                                                      • 16.2.7.3. SWOT Analysis
                                                                      • 16.2.7.4. Recent Developments
                                                                      • 16.2.7.5. Financials (Based on Availability)
                                                                    • 16.2.8 BD BioScience
                                                                      • 16.2.8.1. Overview
                                                                      • 16.2.8.2. Products
                                                                      • 16.2.8.3. SWOT Analysis
                                                                      • 16.2.8.4. Recent Developments
                                                                      • 16.2.8.5. Financials (Based on Availability)
                                                                    • 16.2.9 Carlo Erba Reagents SRL
                                                                      • 16.2.9.1. Overview
                                                                      • 16.2.9.2. Products
                                                                      • 16.2.9.3. SWOT Analysis
                                                                      • 16.2.9.4. Recent Developments
                                                                      • 16.2.9.5. Financials (Based on Availability)
                                                                    • 16.2.10 Avantor Inc
                                                                      • 16.2.10.1. Overview
                                                                      • 16.2.10.2. Products
                                                                      • 16.2.10.3. SWOT Analysis
                                                                      • 16.2.10.4. Recent Developments
                                                                      • 16.2.10.5. Financials (Based on Availability)
                                                                    • 16.2.11 PerkinElmer Inc
                                                                      • 16.2.11.1. Overview
                                                                      • 16.2.11.2. Products
                                                                      • 16.2.11.3. SWOT Analysis
                                                                      • 16.2.11.4. Recent Developments
                                                                      • 16.2.11.5. Financials (Based on Availability)
                                                                    • 16.2.12 ITW Reagents Division
                                                                      • 16.2.12.1. Overview
                                                                      • 16.2.12.2. Products
                                                                      • 16.2.12.3. SWOT Analysis
                                                                      • 16.2.12.4. Recent Developments
                                                                      • 16.2.12.5. Financials (Based on Availability)
                                                                    • 16.2.13 Morphisto GmbH
                                                                      • 16.2.13.1. Overview
                                                                      • 16.2.13.2. Products
                                                                      • 16.2.13.3. SWOT Analysis
                                                                      • 16.2.13.4. Recent Developments
                                                                      • 16.2.13.5. Financials (Based on Availability)
                                                                    • 16.2.14 BiosYnth SRL
                                                                      • 16.2.14.1. Overview
                                                                      • 16.2.14.2. Products
                                                                      • 16.2.14.3. SWOT Analysis
                                                                      • 16.2.14.4. Recent Developments
                                                                      • 16.2.14.5. Financials (Based on Availability)
                                                                    • 16.2.15 R&D Systems
                                                                      • 16.2.15.1. Overview
                                                                      • 16.2.15.2. Products
                                                                      • 16.2.15.3. SWOT Analysis
                                                                      • 16.2.15.4. Recent Developments
                                                                      • 16.2.15.5. Financials (Based on Availability)

                                                              List of Figures

                                                              1. Figure 1: Global Laboratory Chemicals Market Revenue Breakdown (Million, %) by Region 2024 & 2032
                                                              2. Figure 2: Global Laboratory Chemicals Market Volume Breakdown (K Tons, %) by Region 2024 & 2032
                                                              3. Figure 3: Asia Pacific Laboratory Chemicals Market Revenue (Million), by Country 2024 & 2032
                                                              4. Figure 4: Asia Pacific Laboratory Chemicals Market Volume (K Tons), by Country 2024 & 2032
                                                              5. Figure 5: Asia Pacific Laboratory Chemicals Market Revenue Share (%), by Country 2024 & 2032
                                                              6. Figure 6: Asia Pacific Laboratory Chemicals Market Volume Share (%), by Country 2024 & 2032
                                                              7. Figure 7: North America Laboratory Chemicals Market Revenue (Million), by Country 2024 & 2032
                                                              8. Figure 8: North America Laboratory Chemicals Market Volume (K Tons), by Country 2024 & 2032
                                                              9. Figure 9: North America Laboratory Chemicals Market Revenue Share (%), by Country 2024 & 2032
                                                              10. Figure 10: North America Laboratory Chemicals Market Volume Share (%), by Country 2024 & 2032
                                                              11. Figure 11: Europe Laboratory Chemicals Market Revenue (Million), by Country 2024 & 2032
                                                              12. Figure 12: Europe Laboratory Chemicals Market Volume (K Tons), by Country 2024 & 2032
                                                              13. Figure 13: Europe Laboratory Chemicals Market Revenue Share (%), by Country 2024 & 2032
                                                              14. Figure 14: Europe Laboratory Chemicals Market Volume Share (%), by Country 2024 & 2032
                                                              15. Figure 15: South America Laboratory Chemicals Market Revenue (Million), by Country 2024 & 2032
                                                              16. Figure 16: South America Laboratory Chemicals Market Volume (K Tons), by Country 2024 & 2032
                                                              17. Figure 17: South America Laboratory Chemicals Market Revenue Share (%), by Country 2024 & 2032
                                                              18. Figure 18: South America Laboratory Chemicals Market Volume Share (%), by Country 2024 & 2032
                                                              19. Figure 19: Middle East and Africa Laboratory Chemicals Market Revenue (Million), by Country 2024 & 2032
                                                              20. Figure 20: Middle East and Africa Laboratory Chemicals Market Volume (K Tons), by Country 2024 & 2032
                                                              21. Figure 21: Middle East and Africa Laboratory Chemicals Market Revenue Share (%), by Country 2024 & 2032
                                                              22. Figure 22: Middle East and Africa Laboratory Chemicals Market Volume Share (%), by Country 2024 & 2032
                                                              23. Figure 23: Asia Pacific Laboratory Chemicals Market Revenue (Million), by Production Analysis 2024 & 2032
                                                              24. Figure 24: Asia Pacific Laboratory Chemicals Market Volume (K Tons), by Production Analysis 2024 & 2032
                                                              25. Figure 25: Asia Pacific Laboratory Chemicals Market Revenue Share (%), by Production Analysis 2024 & 2032
                                                              26. Figure 26: Asia Pacific Laboratory Chemicals Market Volume Share (%), by Production Analysis 2024 & 2032
                                                              27. Figure 27: Asia Pacific Laboratory Chemicals Market Revenue (Million), by Consumption Analysis 2024 & 2032
                                                              28. Figure 28: Asia Pacific Laboratory Chemicals Market Volume (K Tons), by Consumption Analysis 2024 & 2032
                                                              29. Figure 29: Asia Pacific Laboratory Chemicals Market Revenue Share (%), by Consumption Analysis 2024 & 2032
                                                              30. Figure 30: Asia Pacific Laboratory Chemicals Market Volume Share (%), by Consumption Analysis 2024 & 2032
                                                              31. Figure 31: Asia Pacific Laboratory Chemicals Market Revenue (Million), by Import Market Analysis (Value & Volume) 2024 & 2032
                                                              32. Figure 32: Asia Pacific Laboratory Chemicals Market Volume (K Tons), by Import Market Analysis (Value & Volume) 2024 & 2032
                                                              33. Figure 33: Asia Pacific Laboratory Chemicals Market Revenue Share (%), by Import Market Analysis (Value & Volume) 2024 & 2032
                                                              34. Figure 34: Asia Pacific Laboratory Chemicals Market Volume Share (%), by Import Market Analysis (Value & Volume) 2024 & 2032
                                                              35. Figure 35: Asia Pacific Laboratory Chemicals Market Revenue (Million), by Export Market Analysis (Value & Volume) 2024 & 2032
                                                              36. Figure 36: Asia Pacific Laboratory Chemicals Market Volume (K Tons), by Export Market Analysis (Value & Volume) 2024 & 2032
                                                              37. Figure 37: Asia Pacific Laboratory Chemicals Market Revenue Share (%), by Export Market Analysis (Value & Volume) 2024 & 2032
                                                              38. Figure 38: Asia Pacific Laboratory Chemicals Market Volume Share (%), by Export Market Analysis (Value & Volume) 2024 & 2032
                                                              39. Figure 39: Asia Pacific Laboratory Chemicals Market Revenue (Million), by Price Trend Analysis 2024 & 2032
                                                              40. Figure 40: Asia Pacific Laboratory Chemicals Market Volume (K Tons), by Price Trend Analysis 2024 & 2032
                                                              41. Figure 41: Asia Pacific Laboratory Chemicals Market Revenue Share (%), by Price Trend Analysis 2024 & 2032
                                                              42. Figure 42: Asia Pacific Laboratory Chemicals Market Volume Share (%), by Price Trend Analysis 2024 & 2032
                                                              43. Figure 43: Asia Pacific Laboratory Chemicals Market Revenue (Million), by Country 2024 & 2032
                                                              44. Figure 44: Asia Pacific Laboratory Chemicals Market Volume (K Tons), by Country 2024 & 2032
                                                              45. Figure 45: Asia Pacific Laboratory Chemicals Market Revenue Share (%), by Country 2024 & 2032
                                                              46. Figure 46: Asia Pacific Laboratory Chemicals Market Volume Share (%), by Country 2024 & 2032
                                                              47. Figure 47: North America Laboratory Chemicals Market Revenue (Million), by Production Analysis 2024 & 2032
                                                              48. Figure 48: North America Laboratory Chemicals Market Volume (K Tons), by Production Analysis 2024 & 2032
                                                              49. Figure 49: North America Laboratory Chemicals Market Revenue Share (%), by Production Analysis 2024 & 2032
                                                              50. Figure 50: North America Laboratory Chemicals Market Volume Share (%), by Production Analysis 2024 & 2032
                                                              51. Figure 51: North America Laboratory Chemicals Market Revenue (Million), by Consumption Analysis 2024 & 2032
                                                              52. Figure 52: North America Laboratory Chemicals Market Volume (K Tons), by Consumption Analysis 2024 & 2032
                                                              53. Figure 53: North America Laboratory Chemicals Market Revenue Share (%), by Consumption Analysis 2024 & 2032
                                                              54. Figure 54: North America Laboratory Chemicals Market Volume Share (%), by Consumption Analysis 2024 & 2032
                                                              55. Figure 55: North America Laboratory Chemicals Market Revenue (Million), by Import Market Analysis (Value & Volume) 2024 & 2032
                                                              56. Figure 56: North America Laboratory Chemicals Market Volume (K Tons), by Import Market Analysis (Value & Volume) 2024 & 2032
                                                              57. Figure 57: North America Laboratory Chemicals Market Revenue Share (%), by Import Market Analysis (Value & Volume) 2024 & 2032
                                                              58. Figure 58: North America Laboratory Chemicals Market Volume Share (%), by Import Market Analysis (Value & Volume) 2024 & 2032
                                                              59. Figure 59: North America Laboratory Chemicals Market Revenue (Million), by Export Market Analysis (Value & Volume) 2024 & 2032
                                                              60. Figure 60: North America Laboratory Chemicals Market Volume (K Tons), by Export Market Analysis (Value & Volume) 2024 & 2032
                                                              61. Figure 61: North America Laboratory Chemicals Market Revenue Share (%), by Export Market Analysis (Value & Volume) 2024 & 2032
                                                              62. Figure 62: North America Laboratory Chemicals Market Volume Share (%), by Export Market Analysis (Value & Volume) 2024 & 2032
                                                              63. Figure 63: North America Laboratory Chemicals Market Revenue (Million), by Price Trend Analysis 2024 & 2032
                                                              64. Figure 64: North America Laboratory Chemicals Market Volume (K Tons), by Price Trend Analysis 2024 & 2032
                                                              65. Figure 65: North America Laboratory Chemicals Market Revenue Share (%), by Price Trend Analysis 2024 & 2032
                                                              66. Figure 66: North America Laboratory Chemicals Market Volume Share (%), by Price Trend Analysis 2024 & 2032
                                                              67. Figure 67: North America Laboratory Chemicals Market Revenue (Million), by Country 2024 & 2032
                                                              68. Figure 68: North America Laboratory Chemicals Market Volume (K Tons), by Country 2024 & 2032
                                                              69. Figure 69: North America Laboratory Chemicals Market Revenue Share (%), by Country 2024 & 2032
                                                              70. Figure 70: North America Laboratory Chemicals Market Volume Share (%), by Country 2024 & 2032
                                                              71. Figure 71: Europe Laboratory Chemicals Market Revenue (Million), by Production Analysis 2024 & 2032
                                                              72. Figure 72: Europe Laboratory Chemicals Market Volume (K Tons), by Production Analysis 2024 & 2032
                                                              73. Figure 73: Europe Laboratory Chemicals Market Revenue Share (%), by Production Analysis 2024 & 2032
                                                              74. Figure 74: Europe Laboratory Chemicals Market Volume Share (%), by Production Analysis 2024 & 2032
                                                              75. Figure 75: Europe Laboratory Chemicals Market Revenue (Million), by Consumption Analysis 2024 & 2032
                                                              76. Figure 76: Europe Laboratory Chemicals Market Volume (K Tons), by Consumption Analysis 2024 & 2032
                                                              77. Figure 77: Europe Laboratory Chemicals Market Revenue Share (%), by Consumption Analysis 2024 & 2032
                                                              78. Figure 78: Europe Laboratory Chemicals Market Volume Share (%), by Consumption Analysis 2024 & 2032
                                                              79. Figure 79: Europe Laboratory Chemicals Market Revenue (Million), by Import Market Analysis (Value & Volume) 2024 & 2032
                                                              80. Figure 80: Europe Laboratory Chemicals Market Volume (K Tons), by Import Market Analysis (Value & Volume) 2024 & 2032
                                                              81. Figure 81: Europe Laboratory Chemicals Market Revenue Share (%), by Import Market Analysis (Value & Volume) 2024 & 2032
                                                              82. Figure 82: Europe Laboratory Chemicals Market Volume Share (%), by Import Market Analysis (Value & Volume) 2024 & 2032
                                                              83. Figure 83: Europe Laboratory Chemicals Market Revenue (Million), by Export Market Analysis (Value & Volume) 2024 & 2032
                                                              84. Figure 84: Europe Laboratory Chemicals Market Volume (K Tons), by Export Market Analysis (Value & Volume) 2024 & 2032
                                                              85. Figure 85: Europe Laboratory Chemicals Market Revenue Share (%), by Export Market Analysis (Value & Volume) 2024 & 2032
                                                              86. Figure 86: Europe Laboratory Chemicals Market Volume Share (%), by Export Market Analysis (Value & Volume) 2024 & 2032
                                                              87. Figure 87: Europe Laboratory Chemicals Market Revenue (Million), by Price Trend Analysis 2024 & 2032
                                                              88. Figure 88: Europe Laboratory Chemicals Market Volume (K Tons), by Price Trend Analysis 2024 & 2032
                                                              89. Figure 89: Europe Laboratory Chemicals Market Revenue Share (%), by Price Trend Analysis 2024 & 2032
                                                              90. Figure 90: Europe Laboratory Chemicals Market Volume Share (%), by Price Trend Analysis 2024 & 2032
                                                              91. Figure 91: Europe Laboratory Chemicals Market Revenue (Million), by Country 2024 & 2032
                                                              92. Figure 92: Europe Laboratory Chemicals Market Volume (K Tons), by Country 2024 & 2032
                                                              93. Figure 93: Europe Laboratory Chemicals Market Revenue Share (%), by Country 2024 & 2032
                                                              94. Figure 94: Europe Laboratory Chemicals Market Volume Share (%), by Country 2024 & 2032
                                                              95. Figure 95: South America Laboratory Chemicals Market Revenue (Million), by Production Analysis 2024 & 2032
                                                              96. Figure 96: South America Laboratory Chemicals Market Volume (K Tons), by Production Analysis 2024 & 2032
                                                              97. Figure 97: South America Laboratory Chemicals Market Revenue Share (%), by Production Analysis 2024 & 2032
                                                              98. Figure 98: South America Laboratory Chemicals Market Volume Share (%), by Production Analysis 2024 & 2032
                                                              99. Figure 99: South America Laboratory Chemicals Market Revenue (Million), by Consumption Analysis 2024 & 2032
                                                              100. Figure 100: South America Laboratory Chemicals Market Volume (K Tons), by Consumption Analysis 2024 & 2032
                                                              101. Figure 101: South America Laboratory Chemicals Market Revenue Share (%), by Consumption Analysis 2024 & 2032
                                                              102. Figure 102: South America Laboratory Chemicals Market Volume Share (%), by Consumption Analysis 2024 & 2032
                                                              103. Figure 103: South America Laboratory Chemicals Market Revenue (Million), by Import Market Analysis (Value & Volume) 2024 & 2032
                                                              104. Figure 104: South America Laboratory Chemicals Market Volume (K Tons), by Import Market Analysis (Value & Volume) 2024 & 2032
                                                              105. Figure 105: South America Laboratory Chemicals Market Revenue Share (%), by Import Market Analysis (Value & Volume) 2024 & 2032
                                                              106. Figure 106: South America Laboratory Chemicals Market Volume Share (%), by Import Market Analysis (Value & Volume) 2024 & 2032
                                                              107. Figure 107: South America Laboratory Chemicals Market Revenue (Million), by Export Market Analysis (Value & Volume) 2024 & 2032
                                                              108. Figure 108: South America Laboratory Chemicals Market Volume (K Tons), by Export Market Analysis (Value & Volume) 2024 & 2032
                                                              109. Figure 109: South America Laboratory Chemicals Market Revenue Share (%), by Export Market Analysis (Value & Volume) 2024 & 2032
                                                              110. Figure 110: South America Laboratory Chemicals Market Volume Share (%), by Export Market Analysis (Value & Volume) 2024 & 2032
                                                              111. Figure 111: South America Laboratory Chemicals Market Revenue (Million), by Price Trend Analysis 2024 & 2032
                                                              112. Figure 112: South America Laboratory Chemicals Market Volume (K Tons), by Price Trend Analysis 2024 & 2032
                                                              113. Figure 113: South America Laboratory Chemicals Market Revenue Share (%), by Price Trend Analysis 2024 & 2032
                                                              114. Figure 114: South America Laboratory Chemicals Market Volume Share (%), by Price Trend Analysis 2024 & 2032
                                                              115. Figure 115: South America Laboratory Chemicals Market Revenue (Million), by Country 2024 & 2032
                                                              116. Figure 116: South America Laboratory Chemicals Market Volume (K Tons), by Country 2024 & 2032
                                                              117. Figure 117: South America Laboratory Chemicals Market Revenue Share (%), by Country 2024 & 2032
                                                              118. Figure 118: South America Laboratory Chemicals Market Volume Share (%), by Country 2024 & 2032
                                                              119. Figure 119: Middle East and Africa Laboratory Chemicals Market Revenue (Million), by Production Analysis 2024 & 2032
                                                              120. Figure 120: Middle East and Africa Laboratory Chemicals Market Volume (K Tons), by Production Analysis 2024 & 2032
                                                              121. Figure 121: Middle East and Africa Laboratory Chemicals Market Revenue Share (%), by Production Analysis 2024 & 2032
                                                              122. Figure 122: Middle East and Africa Laboratory Chemicals Market Volume Share (%), by Production Analysis 2024 & 2032
                                                              123. Figure 123: Middle East and Africa Laboratory Chemicals Market Revenue (Million), by Consumption Analysis 2024 & 2032
                                                              124. Figure 124: Middle East and Africa Laboratory Chemicals Market Volume (K Tons), by Consumption Analysis 2024 & 2032
                                                              125. Figure 125: Middle East and Africa Laboratory Chemicals Market Revenue Share (%), by Consumption Analysis 2024 & 2032
                                                              126. Figure 126: Middle East and Africa Laboratory Chemicals Market Volume Share (%), by Consumption Analysis 2024 & 2032
                                                              127. Figure 127: Middle East and Africa Laboratory Chemicals Market Revenue (Million), by Import Market Analysis (Value & Volume) 2024 & 2032
                                                              128. Figure 128: Middle East and Africa Laboratory Chemicals Market Volume (K Tons), by Import Market Analysis (Value & Volume) 2024 & 2032
                                                              129. Figure 129: Middle East and Africa Laboratory Chemicals Market Revenue Share (%), by Import Market Analysis (Value & Volume) 2024 & 2032
                                                              130. Figure 130: Middle East and Africa Laboratory Chemicals Market Volume Share (%), by Import Market Analysis (Value & Volume) 2024 & 2032
                                                              131. Figure 131: Middle East and Africa Laboratory Chemicals Market Revenue (Million), by Export Market Analysis (Value & Volume) 2024 & 2032
                                                              132. Figure 132: Middle East and Africa Laboratory Chemicals Market Volume (K Tons), by Export Market Analysis (Value & Volume) 2024 & 2032
                                                              133. Figure 133: Middle East and Africa Laboratory Chemicals Market Revenue Share (%), by Export Market Analysis (Value & Volume) 2024 & 2032
                                                              134. Figure 134: Middle East and Africa Laboratory Chemicals Market Volume Share (%), by Export Market Analysis (Value & Volume) 2024 & 2032
                                                              135. Figure 135: Middle East and Africa Laboratory Chemicals Market Revenue (Million), by Price Trend Analysis 2024 & 2032
                                                              136. Figure 136: Middle East and Africa Laboratory Chemicals Market Volume (K Tons), by Price Trend Analysis 2024 & 2032
                                                              137. Figure 137: Middle East and Africa Laboratory Chemicals Market Revenue Share (%), by Price Trend Analysis 2024 & 2032
                                                              138. Figure 138: Middle East and Africa Laboratory Chemicals Market Volume Share (%), by Price Trend Analysis 2024 & 2032
                                                              139. Figure 139: Middle East and Africa Laboratory Chemicals Market Revenue (Million), by Country 2024 & 2032
                                                              140. Figure 140: Middle East and Africa Laboratory Chemicals Market Volume (K Tons), by Country 2024 & 2032
                                                              141. Figure 141: Middle East and Africa Laboratory Chemicals Market Revenue Share (%), by Country 2024 & 2032
                                                              142. Figure 142: Middle East and Africa Laboratory Chemicals Market Volume Share (%), by Country 2024 & 2032

                                                              List of Tables

                                                              1. Table 1: Global Laboratory Chemicals Market Revenue Million Forecast, by Region 2019 & 2032
                                                              2. Table 2: Global Laboratory Chemicals Market Volume K Tons Forecast, by Region 2019 & 2032
                                                              3. Table 3: Global Laboratory Chemicals Market Revenue Million Forecast, by Production Analysis 2019 & 2032
                                                              4. Table 4: Global Laboratory Chemicals Market Volume K Tons Forecast, by Production Analysis 2019 & 2032
                                                              5. Table 5: Global Laboratory Chemicals Market Revenue Million Forecast, by Consumption Analysis 2019 & 2032
                                                              6. Table 6: Global Laboratory Chemicals Market Volume K Tons Forecast, by Consumption Analysis 2019 & 2032
                                                              7. Table 7: Global Laboratory Chemicals Market Revenue Million Forecast, by Import Market Analysis (Value & Volume) 2019 & 2032
                                                              8. Table 8: Global Laboratory Chemicals Market Volume K Tons Forecast, by Import Market Analysis (Value & Volume) 2019 & 2032
                                                              9. Table 9: Global Laboratory Chemicals Market Revenue Million Forecast, by Export Market Analysis (Value & Volume) 2019 & 2032
                                                              10. Table 10: Global Laboratory Chemicals Market Volume K Tons Forecast, by Export Market Analysis (Value & Volume) 2019 & 2032
                                                              11. Table 11: Global Laboratory Chemicals Market Revenue Million Forecast, by Price Trend Analysis 2019 & 2032
                                                              12. Table 12: Global Laboratory Chemicals Market Volume K Tons Forecast, by Price Trend Analysis 2019 & 2032
                                                              13. Table 13: Global Laboratory Chemicals Market Revenue Million Forecast, by Region 2019 & 2032
                                                              14. Table 14: Global Laboratory Chemicals Market Volume K Tons Forecast, by Region 2019 & 2032
                                                              15. Table 15: Global Laboratory Chemicals Market Revenue Million Forecast, by Country 2019 & 2032
                                                              16. Table 16: Global Laboratory Chemicals Market Volume K Tons Forecast, by Country 2019 & 2032
                                                              17. Table 17: China Laboratory Chemicals Market Revenue (Million) Forecast, by Application 2019 & 2032
                                                              18. Table 18: China Laboratory Chemicals Market Volume (K Tons) Forecast, by Application 2019 & 2032
                                                              19. Table 19: India Laboratory Chemicals Market Revenue (Million) Forecast, by Application 2019 & 2032
                                                              20. Table 20: India Laboratory Chemicals Market Volume (K Tons) Forecast, by Application 2019 & 2032
                                                              21. Table 21: Japan Laboratory Chemicals Market Revenue (Million) Forecast, by Application 2019 & 2032
                                                              22. Table 22: Japan Laboratory Chemicals Market Volume (K Tons) Forecast, by Application 2019 & 2032
                                                              23. Table 23: South Korea Laboratory Chemicals Market Revenue (Million) Forecast, by Application 2019 & 2032
                                                              24. Table 24: South Korea Laboratory Chemicals Market Volume (K Tons) Forecast, by Application 2019 & 2032
                                                              25. Table 25: Rest of Asia Pacific Laboratory Chemicals Market Revenue (Million) Forecast, by Application 2019 & 2032
                                                              26. Table 26: Rest of Asia Pacific Laboratory Chemicals Market Volume (K Tons) Forecast, by Application 2019 & 2032
                                                              27. Table 27: Global Laboratory Chemicals Market Revenue Million Forecast, by Country 2019 & 2032
                                                              28. Table 28: Global Laboratory Chemicals Market Volume K Tons Forecast, by Country 2019 & 2032
                                                              29. Table 29: United States Laboratory Chemicals Market Revenue (Million) Forecast, by Application 2019 & 2032
                                                              30. Table 30: United States Laboratory Chemicals Market Volume (K Tons) Forecast, by Application 2019 & 2032
                                                              31. Table 31: Canada Laboratory Chemicals Market Revenue (Million) Forecast, by Application 2019 & 2032
                                                              32. Table 32: Canada Laboratory Chemicals Market Volume (K Tons) Forecast, by Application 2019 & 2032
                                                              33. Table 33: Mexico Laboratory Chemicals Market Revenue (Million) Forecast, by Application 2019 & 2032
                                                              34. Table 34: Mexico Laboratory Chemicals Market Volume (K Tons) Forecast, by Application 2019 & 2032
                                                              35. Table 35: Global Laboratory Chemicals Market Revenue Million Forecast, by Country 2019 & 2032
                                                              36. Table 36: Global Laboratory Chemicals Market Volume K Tons Forecast, by Country 2019 & 2032
                                                              37. Table 37: Germany Laboratory Chemicals Market Revenue (Million) Forecast, by Application 2019 & 2032
                                                              38. Table 38: Germany Laboratory Chemicals Market Volume (K Tons) Forecast, by Application 2019 & 2032
                                                              39. Table 39: United Kingdom Laboratory Chemicals Market Revenue (Million) Forecast, by Application 2019 & 2032
                                                              40. Table 40: United Kingdom Laboratory Chemicals Market Volume (K Tons) Forecast, by Application 2019 & 2032
                                                              41. Table 41: Italy Laboratory Chemicals Market Revenue (Million) Forecast, by Application 2019 & 2032
                                                              42. Table 42: Italy Laboratory Chemicals Market Volume (K Tons) Forecast, by Application 2019 & 2032
                                                              43. Table 43: France Laboratory Chemicals Market Revenue (Million) Forecast, by Application 2019 & 2032
                                                              44. Table 44: France Laboratory Chemicals Market Volume (K Tons) Forecast, by Application 2019 & 2032
                                                              45. Table 45: Spain Laboratory Chemicals Market Revenue (Million) Forecast, by Application 2019 & 2032
                                                              46. Table 46: Spain Laboratory Chemicals Market Volume (K Tons) Forecast, by Application 2019 & 2032
                                                              47. Table 47: Rest of Europe Laboratory Chemicals Market Revenue (Million) Forecast, by Application 2019 & 2032
                                                              48. Table 48: Rest of Europe Laboratory Chemicals Market Volume (K Tons) Forecast, by Application 2019 & 2032
                                                              49. Table 49: Global Laboratory Chemicals Market Revenue Million Forecast, by Country 2019 & 2032
                                                              50. Table 50: Global Laboratory Chemicals Market Volume K Tons Forecast, by Country 2019 & 2032
                                                              51. Table 51: Brazil Laboratory Chemicals Market Revenue (Million) Forecast, by Application 2019 & 2032
                                                              52. Table 52: Brazil Laboratory Chemicals Market Volume (K Tons) Forecast, by Application 2019 & 2032
                                                              53. Table 53: Argentina Laboratory Chemicals Market Revenue (Million) Forecast, by Application 2019 & 2032
                                                              54. Table 54: Argentina Laboratory Chemicals Market Volume (K Tons) Forecast, by Application 2019 & 2032
                                                              55. Table 55: Rest of South America Laboratory Chemicals Market Revenue (Million) Forecast, by Application 2019 & 2032
                                                              56. Table 56: Rest of South America Laboratory Chemicals Market Volume (K Tons) Forecast, by Application 2019 & 2032
                                                              57. Table 57: Global Laboratory Chemicals Market Revenue Million Forecast, by Country 2019 & 2032
                                                              58. Table 58: Global Laboratory Chemicals Market Volume K Tons Forecast, by Country 2019 & 2032
                                                              59. Table 59: Saudi Arabia Laboratory Chemicals Market Revenue (Million) Forecast, by Application 2019 & 2032
                                                              60. Table 60: Saudi Arabia Laboratory Chemicals Market Volume (K Tons) Forecast, by Application 2019 & 2032
                                                              61. Table 61: South Africa Laboratory Chemicals Market Revenue (Million) Forecast, by Application 2019 & 2032
                                                              62. Table 62: South Africa Laboratory Chemicals Market Volume (K Tons) Forecast, by Application 2019 & 2032
                                                              63. Table 63: Rest of Middle East and Africa Laboratory Chemicals Market Revenue (Million) Forecast, by Application 2019 & 2032
                                                              64. Table 64: Rest of Middle East and Africa Laboratory Chemicals Market Volume (K Tons) Forecast, by Application 2019 & 2032
                                                              65. Table 65: Global Laboratory Chemicals Market Revenue Million Forecast, by Production Analysis 2019 & 2032
                                                              66. Table 66: Global Laboratory Chemicals Market Volume K Tons Forecast, by Production Analysis 2019 & 2032
                                                              67. Table 67: Global Laboratory Chemicals Market Revenue Million Forecast, by Consumption Analysis 2019 & 2032
                                                              68. Table 68: Global Laboratory Chemicals Market Volume K Tons Forecast, by Consumption Analysis 2019 & 2032
                                                              69. Table 69: Global Laboratory Chemicals Market Revenue Million Forecast, by Import Market Analysis (Value & Volume) 2019 & 2032
                                                              70. Table 70: Global Laboratory Chemicals Market Volume K Tons Forecast, by Import Market Analysis (Value & Volume) 2019 & 2032
                                                              71. Table 71: Global Laboratory Chemicals Market Revenue Million Forecast, by Export Market Analysis (Value & Volume) 2019 & 2032
                                                              72. Table 72: Global Laboratory Chemicals Market Volume K Tons Forecast, by Export Market Analysis (Value & Volume) 2019 & 2032
                                                              73. Table 73: Global Laboratory Chemicals Market Revenue Million Forecast, by Price Trend Analysis 2019 & 2032
                                                              74. Table 74: Global Laboratory Chemicals Market Volume K Tons Forecast, by Price Trend Analysis 2019 & 2032
                                                              75. Table 75: Global Laboratory Chemicals Market Revenue Million Forecast, by Country 2019 & 2032
                                                              76. Table 76: Global Laboratory Chemicals Market Volume K Tons Forecast, by Country 2019 & 2032
                                                              77. Table 77: China Laboratory Chemicals Market Revenue (Million) Forecast, by Application 2019 & 2032
                                                              78. Table 78: China Laboratory Chemicals Market Volume (K Tons) Forecast, by Application 2019 & 2032
                                                              79. Table 79: India Laboratory Chemicals Market Revenue (Million) Forecast, by Application 2019 & 2032
                                                              80. Table 80: India Laboratory Chemicals Market Volume (K Tons) Forecast, by Application 2019 & 2032
                                                              81. Table 81: Japan Laboratory Chemicals Market Revenue (Million) Forecast, by Application 2019 & 2032
                                                              82. Table 82: Japan Laboratory Chemicals Market Volume (K Tons) Forecast, by Application 2019 & 2032
                                                              83. Table 83: South Korea Laboratory Chemicals Market Revenue (Million) Forecast, by Application 2019 & 2032
                                                              84. Table 84: South Korea Laboratory Chemicals Market Volume (K Tons) Forecast, by Application 2019 & 2032
                                                              85. Table 85: Rest of Asia Pacific Laboratory Chemicals Market Revenue (Million) Forecast, by Application 2019 & 2032
                                                              86. Table 86: Rest of Asia Pacific Laboratory Chemicals Market Volume (K Tons) Forecast, by Application 2019 & 2032
                                                              87. Table 87: Global Laboratory Chemicals Market Revenue Million Forecast, by Production Analysis 2019 & 2032
                                                              88. Table 88: Global Laboratory Chemicals Market Volume K Tons Forecast, by Production Analysis 2019 & 2032
                                                              89. Table 89: Global Laboratory Chemicals Market Revenue Million Forecast, by Consumption Analysis 2019 & 2032
                                                              90. Table 90: Global Laboratory Chemicals Market Volume K Tons Forecast, by Consumption Analysis 2019 & 2032
                                                              91. Table 91: Global Laboratory Chemicals Market Revenue Million Forecast, by Import Market Analysis (Value & Volume) 2019 & 2032
                                                              92. Table 92: Global Laboratory Chemicals Market Volume K Tons Forecast, by Import Market Analysis (Value & Volume) 2019 & 2032
                                                              93. Table 93: Global Laboratory Chemicals Market Revenue Million Forecast, by Export Market Analysis (Value & Volume) 2019 & 2032
                                                              94. Table 94: Global Laboratory Chemicals Market Volume K Tons Forecast, by Export Market Analysis (Value & Volume) 2019 & 2032
                                                              95. Table 95: Global Laboratory Chemicals Market Revenue Million Forecast, by Price Trend Analysis 2019 & 2032
                                                              96. Table 96: Global Laboratory Chemicals Market Volume K Tons Forecast, by Price Trend Analysis 2019 & 2032
                                                              97. Table 97: Global Laboratory Chemicals Market Revenue Million Forecast, by Country 2019 & 2032
                                                              98. Table 98: Global Laboratory Chemicals Market Volume K Tons Forecast, by Country 2019 & 2032
                                                              99. Table 99: United States Laboratory Chemicals Market Revenue (Million) Forecast, by Application 2019 & 2032
                                                              100. Table 100: United States Laboratory Chemicals Market Volume (K Tons) Forecast, by Application 2019 & 2032
                                                              101. Table 101: Canada Laboratory Chemicals Market Revenue (Million) Forecast, by Application 2019 & 2032
                                                              102. Table 102: Canada Laboratory Chemicals Market Volume (K Tons) Forecast, by Application 2019 & 2032
                                                              103. Table 103: Mexico Laboratory Chemicals Market Revenue (Million) Forecast, by Application 2019 & 2032
                                                              104. Table 104: Mexico Laboratory Chemicals Market Volume (K Tons) Forecast, by Application 2019 & 2032
                                                              105. Table 105: Global Laboratory Chemicals Market Revenue Million Forecast, by Production Analysis 2019 & 2032
                                                              106. Table 106: Global Laboratory Chemicals Market Volume K Tons Forecast, by Production Analysis 2019 & 2032
                                                              107. Table 107: Global Laboratory Chemicals Market Revenue Million Forecast, by Consumption Analysis 2019 & 2032
                                                              108. Table 108: Global Laboratory Chemicals Market Volume K Tons Forecast, by Consumption Analysis 2019 & 2032
                                                              109. Table 109: Global Laboratory Chemicals Market Revenue Million Forecast, by Import Market Analysis (Value & Volume) 2019 & 2032
                                                              110. Table 110: Global Laboratory Chemicals Market Volume K Tons Forecast, by Import Market Analysis (Value & Volume) 2019 & 2032
                                                              111. Table 111: Global Laboratory Chemicals Market Revenue Million Forecast, by Export Market Analysis (Value & Volume) 2019 & 2032
                                                              112. Table 112: Global Laboratory Chemicals Market Volume K Tons Forecast, by Export Market Analysis (Value & Volume) 2019 & 2032
                                                              113. Table 113: Global Laboratory Chemicals Market Revenue Million Forecast, by Price Trend Analysis 2019 & 2032
                                                              114. Table 114: Global Laboratory Chemicals Market Volume K Tons Forecast, by Price Trend Analysis 2019 & 2032
                                                              115. Table 115: Global Laboratory Chemicals Market Revenue Million Forecast, by Country 2019 & 2032
                                                              116. Table 116: Global Laboratory Chemicals Market Volume K Tons Forecast, by Country 2019 & 2032
                                                              117. Table 117: Germany Laboratory Chemicals Market Revenue (Million) Forecast, by Application 2019 & 2032
                                                              118. Table 118: Germany Laboratory Chemicals Market Volume (K Tons) Forecast, by Application 2019 & 2032
                                                              119. Table 119: United Kingdom Laboratory Chemicals Market Revenue (Million) Forecast, by Application 2019 & 2032
                                                              120. Table 120: United Kingdom Laboratory Chemicals Market Volume (K Tons) Forecast, by Application 2019 & 2032
                                                              121. Table 121: Italy Laboratory Chemicals Market Revenue (Million) Forecast, by Application 2019 & 2032
                                                              122. Table 122: Italy Laboratory Chemicals Market Volume (K Tons) Forecast, by Application 2019 & 2032
                                                              123. Table 123: France Laboratory Chemicals Market Revenue (Million) Forecast, by Application 2019 & 2032
                                                              124. Table 124: France Laboratory Chemicals Market Volume (K Tons) Forecast, by Application 2019 & 2032
                                                              125. Table 125: Spain Laboratory Chemicals Market Revenue (Million) Forecast, by Application 2019 & 2032
                                                              126. Table 126: Spain Laboratory Chemicals Market Volume (K Tons) Forecast, by Application 2019 & 2032
                                                              127. Table 127: Rest of Europe Laboratory Chemicals Market Revenue (Million) Forecast, by Application 2019 & 2032
                                                              128. Table 128: Rest of Europe Laboratory Chemicals Market Volume (K Tons) Forecast, by Application 2019 & 2032
                                                              129. Table 129: Global Laboratory Chemicals Market Revenue Million Forecast, by Production Analysis 2019 & 2032
                                                              130. Table 130: Global Laboratory Chemicals Market Volume K Tons Forecast, by Production Analysis 2019 & 2032
                                                              131. Table 131: Global Laboratory Chemicals Market Revenue Million Forecast, by Consumption Analysis 2019 & 2032
                                                              132. Table 132: Global Laboratory Chemicals Market Volume K Tons Forecast, by Consumption Analysis 2019 & 2032
                                                              133. Table 133: Global Laboratory Chemicals Market Revenue Million Forecast, by Import Market Analysis (Value & Volume) 2019 & 2032
                                                              134. Table 134: Global Laboratory Chemicals Market Volume K Tons Forecast, by Import Market Analysis (Value & Volume) 2019 & 2032
                                                              135. Table 135: Global Laboratory Chemicals Market Revenue Million Forecast, by Export Market Analysis (Value & Volume) 2019 & 2032
                                                              136. Table 136: Global Laboratory Chemicals Market Volume K Tons Forecast, by Export Market Analysis (Value & Volume) 2019 & 2032
                                                              137. Table 137: Global Laboratory Chemicals Market Revenue Million Forecast, by Price Trend Analysis 2019 & 2032
                                                              138. Table 138: Global Laboratory Chemicals Market Volume K Tons Forecast, by Price Trend Analysis 2019 & 2032
                                                              139. Table 139: Global Laboratory Chemicals Market Revenue Million Forecast, by Country 2019 & 2032
                                                              140. Table 140: Global Laboratory Chemicals Market Volume K Tons Forecast, by Country 2019 & 2032
                                                              141. Table 141: Brazil Laboratory Chemicals Market Revenue (Million) Forecast, by Application 2019 & 2032
                                                              142. Table 142: Brazil Laboratory Chemicals Market Volume (K Tons) Forecast, by Application 2019 & 2032
                                                              143. Table 143: Argentina Laboratory Chemicals Market Revenue (Million) Forecast, by Application 2019 & 2032
                                                              144. Table 144: Argentina Laboratory Chemicals Market Volume (K Tons) Forecast, by Application 2019 & 2032
                                                              145. Table 145: Rest of South America Laboratory Chemicals Market Revenue (Million) Forecast, by Application 2019 & 2032
                                                              146. Table 146: Rest of South America Laboratory Chemicals Market Volume (K Tons) Forecast, by Application 2019 & 2032
                                                              147. Table 147: Global Laboratory Chemicals Market Revenue Million Forecast, by Production Analysis 2019 & 2032
                                                              148. Table 148: Global Laboratory Chemicals Market Volume K Tons Forecast, by Production Analysis 2019 & 2032
                                                              149. Table 149: Global Laboratory Chemicals Market Revenue Million Forecast, by Consumption Analysis 2019 & 2032
                                                              150. Table 150: Global Laboratory Chemicals Market Volume K Tons Forecast, by Consumption Analysis 2019 & 2032
                                                              151. Table 151: Global Laboratory Chemicals Market Revenue Million Forecast, by Import Market Analysis (Value & Volume) 2019 & 2032
                                                              152. Table 152: Global Laboratory Chemicals Market Volume K Tons Forecast, by Import Market Analysis (Value & Volume) 2019 & 2032
                                                              153. Table 153: Global Laboratory Chemicals Market Revenue Million Forecast, by Export Market Analysis (Value & Volume) 2019 & 2032
                                                              154. Table 154: Global Laboratory Chemicals Market Volume K Tons Forecast, by Export Market Analysis (Value & Volume) 2019 & 2032
                                                              155. Table 155: Global Laboratory Chemicals Market Revenue Million Forecast, by Price Trend Analysis 2019 & 2032
                                                              156. Table 156: Global Laboratory Chemicals Market Volume K Tons Forecast, by Price Trend Analysis 2019 & 2032
                                                              157. Table 157: Global Laboratory Chemicals Market Revenue Million Forecast, by Country 2019 & 2032
                                                              158. Table 158: Global Laboratory Chemicals Market Volume K Tons Forecast, by Country 2019 & 2032
                                                              159. Table 159: Saudi Arabia Laboratory Chemicals Market Revenue (Million) Forecast, by Application 2019 & 2032
                                                              160. Table 160: Saudi Arabia Laboratory Chemicals Market Volume (K Tons) Forecast, by Application 2019 & 2032
                                                              161. Table 161: South Africa Laboratory Chemicals Market Revenue (Million) Forecast, by Application 2019 & 2032
                                                              162. Table 162: South Africa Laboratory Chemicals Market Volume (K Tons) Forecast, by Application 2019 & 2032
                                                              163. Table 163: USE Laboratory Chemicals Market Revenue (Million) Forecast, by Application 2019 & 2032
                                                              164. Table 164: USE Laboratory Chemicals Market Volume (K Tons) Forecast, by Application 2019 & 2032
                                                              165. Table 165: Rest of Middle East and Africa Laboratory Chemicals Market Revenue (Million) Forecast, by Application 2019 & 2032
                                                              166. Table 166: Rest of Middle East and Africa Laboratory Chemicals Market Volume (K Tons) Forecast, by Application 2019 & 2032


                                                              Frequently Asked Questions

                                                              1. What is the projected Compound Annual Growth Rate (CAGR) of the Laboratory Chemicals Market?

                                                              The projected CAGR is approximately 4.30%.

                                                              2. Which companies are prominent players in the Laboratory Chemicals Market?

                                                              Key companies in the market include Meridian Life Science Inc, Beckman Coulter Inc, UJIFILM Wako Chemicals, Sigma-Aldrich Corp, Merck KGaA, Mitsubishi Rayon Co Ltd, GE Healthcare, BD BioScience, Carlo Erba Reagents SRL, Avantor Inc, PerkinElmer Inc, ITW Reagents Division, Morphisto GmbH, BiosYnth SRL, R&D Systems.

                                                              3. What are the main segments of the Laboratory Chemicals Market?

                                                              The market segments include Production Analysis, Consumption Analysis, Import Market Analysis (Value & Volume), Export Market Analysis (Value & Volume), Price Trend Analysis.

                                                              4. Can you provide details about the market size?

                                                              The market size is estimated to be USD 27.68 Million as of 2022.

                                                              5. What are some drivers contributing to market growth?

                                                              Growing R&D Activities in the Field of Biological and Chemical Sciences; Increasing Usage in Wastewater Treatment; Other Drivers.

                                                              6. What are the notable trends driving market growth?

                                                              Industrial Application to Witness the Higher Potential Growth.

                                                              7. Are there any restraints impacting market growth?

                                                              Availability of Substitutes for Laboratory Chemicals; Other Restraints.

                                                              8. Can you provide examples of recent developments in the market?

                                                              The recent developments pertaining to the major players in the market are covered in the complete study.

                                                              9. What pricing options are available for accessing the report?

                                                              Pricing options include single-user, multi-user, and enterprise licenses priced at USD 4750, USD 5250, and USD 8750 respectively.

                                                              10. Is the market size provided in terms of value or volume?

                                                              The market size is provided in terms of value, measured in Million and volume, measured in K Tons.

                                                              11. Are there any specific market keywords associated with the report?

                                                              Yes, the market keyword associated with the report is "Laboratory Chemicals Market," which aids in identifying and referencing the specific market segment covered.

                                                              12. How do I determine which pricing option suits my needs best?

                                                              The pricing options vary based on user requirements and access needs. Individual users may opt for single-user licenses, while businesses requiring broader access may choose multi-user or enterprise licenses for cost-effective access to the report.

                                                              13. Are there any additional resources or data provided in the Laboratory Chemicals Market report?

                                                              While the report offers comprehensive insights, it's advisable to review the specific contents or supplementary materials provided to ascertain if additional resources or data are available.

                                                              14. How can I stay updated on further developments or reports in the Laboratory Chemicals Market?

                                                              To stay informed about further developments, trends, and reports in the Laboratory Chemicals Market, consider subscribing to industry newsletters, following relevant companies and organizations, or regularly checking reputable industry news sources and publications.


                                                              Methodology

                                                              Step 1 - Identification of Relevant Samples Size from Population Database

                                                              Step Chart
                                                              Bar Chart
                                                              Method Chart

                                                              Step 2 - Approaches for Defining Global Market Size (Value, Volume* & Price*)

                                                              Approach Chart
                                                              Top-down and bottom-up approaches are used to validate the global market size and estimate the market size for manufactures, regional segments, product, and application.

                                                              Note*: In applicable scenarios

                                                              Step 3 - Data Sources

                                                              Primary Research

                                                              • Web Analytics
                                                              • Survey Reports
                                                              • Research Institute
                                                              • Latest Research Reports
                                                              • Opinion Leaders

                                                              Secondary Research

                                                              • Annual Reports
                                                              • White Paper
                                                              • Latest Press Release
                                                              • Industry Association
                                                              • Paid Database
                                                              • Investor Presentations
                                                              Analyst Chart

                                                              Step 4 - Data Triangulation

                                                              Involves using different sources of information in order to increase the validity of a study

                                                              These sources are likely to be stakeholders in a program - participants, other researchers, program staff, other community members, and so on.

                                                              Then we put all data in single framework & apply various statistical tools to find out the dynamic on the market.

                                                              During the analysis stage, feedback from the stakeholder groups would be compared to determine areas of agreement as well as areas of divergence

                                                              Additionally, after gathering mixed and scattered data from a wide range of sources, data is triangulated and correlated to come up with estimated figures which are further validated through primary mediums or industry experts, opinion leaders.

                                                              About Report Pinnacle

                                                              Report Pinnacle provides top-tier market research, industry intelligence, and actionable insights for finance, technology, healthcare, and consumer sectors. Our reports empower you to make informed decisions and achieve business success.

                                                              Our expert team combines primary research, data analytics, and industry knowledge to deliver insights you can trust. We offer syndicated reports, custom research, and consulting services tailored to your unique business needs.

                                                              At Report Pinnacle, we are committed to quality, transparency, and client satisfaction. Every report is rigorously validated to ensure accuracy and relevance. Our global perspective and local expertise help you understand both broad trends and detailed market shifts.

                                                              Stay ahead with Report Pinnacle. Subscribe to our newsletter for the latest insights and research highlights, and follow us on social media for real-time updates.

                                                              Report Pinnacle – Your Partner for Reaching the Top in Market Intelligence.

                                                              artwork spiralartwork spiralRelated Reports
                                                              artwork underline

                                                              Comprehensive Review of Indonesia Dry Mix Mortar Market Growth Potential

                                                              Discover the booming Indonesia Dry Mix Mortar market! Explore its $500M valuation, 7% CAGR projection to 2033, key drivers, top players (Heidelberg Materials, MAPEI, Sika), and regional trends. Get insights into this dynamic sector's growth potential.

                                                              July 2025
                                                              Base Year: 2024
                                                              No Of Pages: 197
                                                              Price: $3800

                                                              Adhesive Labels Industry Soars to XXX Million, witnessing a CAGR of XX during the forecast period 2025-2033

                                                              The global adhesive labels market is booming, projected to reach [estimated 2033 value based on CAGR] by 2033. Driven by e-commerce, technological advancements, and diverse applications, this market offers lucrative opportunities. Explore key trends, regional insights, and leading companies shaping this dynamic sector.

                                                              July 2025
                                                              Base Year: 2024
                                                              No Of Pages: 150
                                                              Price: $4750

                                                              Analyzing Asia Garbage Collection Market: Opportunities and Growth Patterns 2025-2033

                                                              The Asia garbage collection market is booming, projected to reach \$103.15 billion by 2033, driven by urbanization, stricter regulations, and technological advancements. Discover key trends, regional insights, and leading companies shaping this rapidly growing sector.

                                                              July 2025
                                                              Base Year: 2024
                                                              No Of Pages: 140
                                                              Price: $3800

                                                              High-Temperature Fiber Industry Market’s Consumer Insights and Trends

                                                              Discover the booming high-temperature fiber market! Our comprehensive analysis reveals key trends, growth projections (2025-2033), and regional market share data, highlighting opportunities in aerospace, automotive, and energy sectors. Learn more about this lucrative industry.

                                                              July 2025
                                                              Base Year: 2024
                                                              No Of Pages: 234
                                                              Price: $4750

                                                              Emerging Market Insights in Middle East LLDPE Market: 2025-2033 Overview

                                                              Discover the booming Middle East LLDPE market! This comprehensive analysis reveals key drivers, trends, and restraints shaping this dynamic sector, projecting significant growth through 2033. Learn about leading players, regional market share, and future opportunities.

                                                              July 2025
                                                              Base Year: 2024
                                                              No Of Pages: 234
                                                              Price: $4750

                                                              Amines Market Planning for the Future: Key Trends 2025-2033

                                                              Discover the dynamic global amines market analysis for 2025-2033. Explore market size, CAGR (4.75%), key drivers, trends, restraints, and leading companies. Gain insights into regional market shares and future growth potential across various segments like ethyleneamines and personal care applications.

                                                              July 2025
                                                              Base Year: 2024
                                                              No Of Pages: 180
                                                              Price: $4750

                                                              Nanotubes Market Trends and Forecasts: Comprehensive Insights

                                                              Discover the booming Nanotubes Market! This comprehensive analysis reveals a $7.98B market in 2025, projected to surge at a 19.95% CAGR through 2033. Explore key drivers, trends, restraints, and regional insights across diverse applications (Li-ion batteries, sensors, healthcare) and leading companies.

                                                              July 2025
                                                              Base Year: 2024
                                                              No Of Pages: 180
                                                              Price: $4750

                                                              Strategic Vision for Middle East Polyamide Market Market Expansion

                                                              Discover the booming Middle East polyamide market! This comprehensive analysis reveals market size, growth trends (projected 6% CAGR), key players (Arkema, BASF, Celanese), and major segments driving expansion in construction, automotive, and textiles. Learn about regional variations and future market outlook until 2033.

                                                              July 2025
                                                              Base Year: 2024
                                                              No Of Pages: 197
                                                              Price: $3800

                                                              Strategic Planning for North America Concrete Admixtures Market Industry Expansion

                                                              Discover the booming North American concrete admixtures market! This in-depth analysis reveals a $2.5B market in 2025, projected to grow at a CAGR exceeding 4% through 2033, driven by infrastructure development and sustainable construction trends. Explore key market segments, leading companies, and future growth opportunities.

                                                              July 2025
                                                              Base Year: 2024
                                                              No Of Pages: 150
                                                              Price: $4750

                                                              Growth Trajectories in Phase Change Materials Industry: Industry Outlook to 2033

                                                              The Phase Change Materials (PCM) market is booming, projected to exceed $4.5 billion by 2033, driven by energy efficiency needs in building & construction, cold chain logistics, and advanced thermal management solutions. Explore market trends, leading companies, and growth opportunities in this dynamic sector.

                                                              July 2025
                                                              Base Year: 2024
                                                              No Of Pages: 180
                                                              Price: $4750

                                                              Unlocking Insights for Magnesium Alloy Market Growth Strategies

                                                              Discover the booming magnesium alloy market! Explore our comprehensive analysis revealing a strong CAGR and significant growth opportunities in automotive, aerospace, and electronics. Learn about market size projections to 2033 and key regional trends.

                                                              July 2025
                                                              Base Year: 2024
                                                              No Of Pages: 234
                                                              Price: $4750

                                                              Consumer-Centric Trends in Dioctyl Maleate (DOM) Market Industry

                                                              Discover the booming Dioctyl Maleate (DOM) market, projected to reach [estimated 2033 value] million by 2033, with a CAGR exceeding 3%. This comprehensive analysis explores market drivers, trends, restraints, and key players like Celanese and ESIM Chemicals, providing insights for strategic decision-making. Learn more about the regional market share and growth projections.

                                                              July 2025
                                                              Base Year: 2024
                                                              No Of Pages: 234
                                                              Price: $4750

                                                              Southeast Asia Melamine Market 2025 to Grow at XX CAGR with XXX Million Market Size: Analysis and Forecasts 2033

                                                              Discover the booming Southeast Asia Melamine Market! This in-depth analysis reveals a CAGR exceeding 5%, driven by construction, furniture, and other key sectors. Explore market size, trends, restraints, and key players like AICA Kogyo and Mitsui Chemicals. Forecast to 2033 included.

                                                              July 2025
                                                              Base Year: 2024
                                                              No Of Pages: 150
                                                              Price: $4750

                                                              Regional Analysis of Melamine Market Growth Trajectories

                                                              Discover the latest insights into the booming melamine market, projected to reach $XX million by 2033 with a CAGR of 4.15%. This comprehensive analysis explores key drivers, trends, restraints, and regional market shares, covering applications like laminates, wood adhesives, and more. Learn about leading companies and future growth opportunities.

                                                              July 2025
                                                              Base Year: 2024
                                                              No Of Pages: 234
                                                              Price: $4750

                                                              Egypt Automotive Oils Market Insightful Analysis: Trends, Competitor Dynamics, and Opportunities 2025-2033

                                                              Discover the booming Egypt automotive oils market! This comprehensive analysis reveals a CAGR of 3.49% (2025-2033), driven by rising vehicle ownership and urbanization. Explore key players, market segmentation, and future trends impacting this lucrative sector. Learn more about market size, growth projections, and regional breakdowns.

                                                              July 2025
                                                              Base Year: 2024
                                                              No Of Pages: 197
                                                              Price: $3800

                                                              Bio-Organic Acid Industry: Disruptive Technologies Driving Market Growth 2025-2033

                                                              The bio-organic acid market is booming, projected to exceed $23 billion by 2033 with a CAGR above 6%. This comprehensive analysis explores market drivers, trends, restraints, key players (ADM, Cargill, Novozymes), and regional insights (North America, Europe, Asia-Pacific). Discover the opportunities in bio-lactic acid, bio-acetic acid, and other bio-based solutions.

                                                              July 2025
                                                              Base Year: 2024
                                                              No Of Pages: 234
                                                              Price: $4750

                                                              Metal Finishing Market Strategic Insights: Analysis 2025 and Forecasts 2033

                                                              The global metal finishing market is booming, projected to reach [estimated 2033 value based on CAGR] by 2033. Discover key trends, drivers, and challenges shaping this dynamic industry, including insights into application segments (automotive, electronics, aerospace) and regional growth. Learn about leading companies and the future of sustainable metal finishing technologies.

                                                              July 2025
                                                              Base Year: 2024
                                                              No Of Pages: 234
                                                              Price: $4750

                                                              Engine Oil in Thailand Market Analysis Uncovered: Market Drivers and Forecasts 2025-2033

                                                              Discover the booming Thailand engine oil market! Our comprehensive analysis reveals a steady CAGR of 1.72%, driven by automotive growth and infrastructure development. Learn about key players, market segments, and future trends shaping this lucrative industry. Explore market size projections until 2033.

                                                              July 2025
                                                              Base Year: 2024
                                                              No Of Pages: 197
                                                              Price: $3800

                                                              Future-Forward Strategies for Canada Automotive OEM Coatings Market Industry

                                                              Discover the booming Canadian automotive OEM coatings market! This in-depth analysis reveals market size, CAGR (exceeding 4%), key drivers (water-borne coatings, lightweighting), restraints, and leading companies. Explore market segmentation by resin type, technology, and application, projected to 2033.

                                                              July 2025
                                                              Base Year: 2024
                                                              No Of Pages: 120
                                                              Price: $3,950

                                                              Regional Analysis of Latin America Injection Molding Machine Industry Growth Trajectories

                                                              Discover the booming Latin American injection molding machine market! Our comprehensive analysis reveals a CAGR exceeding 4%, driven by automotive, packaging, and medical device growth. Learn about key players, market trends, and future projections (2025-2033) for this dynamic industry.

                                                              July 2025
                                                              Base Year: 2024
                                                              No Of Pages: 234
                                                              Price: $4750

                                                              Business Address

                                                              Head Office

                                                              Office no. A 5010, fifth floor, Solitaire Business Hub, Near Phoenix mall, Pune, Maharashtra 411014

                                                              Contact Information

                                                              Craig Francis

                                                              Business Development Head

                                                              +17162654855

                                                              [email protected]

                                                              Connect With Us

                                                              Secure Payment Partners

                                                              payment image
                                                              RetailLogisticsPackagingAutomotiveHealthcareAgricultureEnergy & PowerFood & BeverageAerospace & DefenseChemicals & MaterialsHospitality and TourismAnimal Nutrition & WellnessConsumer Goods and ServicesReal Estate and ConstructionHome and Property ImprovementTechnology, Media and TelecomManufacturing Products and ServicesFinancial Services and Investment Intelligence

                                                              © 2025 All rights reserved


                                                              Privacy Policy
                                                              Terms and Conditions
                                                              FAQ
                                                              • Home
                                                              • About Us
                                                              • Industries
                                                                • Aerospace & Defense
                                                                • Agriculture
                                                                • Animal Nutrition & Wellness
                                                                • Automotive
                                                                • Chemicals & Materials
                                                                • Consumer Goods and Services
                                                                • Energy & Power
                                                                • Financial Services and Investment Intelligence
                                                                • Food & Beverage
                                                                • Home and Property Improvement
                                                                • Hospitality and Tourism
                                                                • Logistics
                                                                • Manufacturing Products and Services
                                                                • Packaging
                                                                • Professional and Commercial Services
                                                                • Real Estate and Construction
                                                                • Retail
                                                                • Technology, Media and Telecom
                                                                • Healthcare
                                                              • Services
                                                              • Contact
                                                              Main Logo
                                                              • Home
                                                              • About Us
                                                              • Industries
                                                                • Aerospace & Defense
                                                                • Agriculture
                                                                • Animal Nutrition & Wellness
                                                                • Automotive
                                                                • Chemicals & Materials
                                                                • Consumer Goods and Services
                                                                • Energy & Power
                                                                • Financial Services and Investment Intelligence
                                                                • Food & Beverage
                                                                • Home and Property Improvement
                                                                • Hospitality and Tourism
                                                                • Logistics
                                                                • Manufacturing Products and Services
                                                                • Packaging
                                                                • Professional and Commercial Services
                                                                • Real Estate and Construction
                                                                • Retail
                                                                • Technology, Media and Telecom
                                                                • Healthcare
                                                              • Services
                                                              • Contact
                                                              +17162654855
                                                              [email protected]

                                                              +17162654855

                                                              [email protected]