

Key Insights
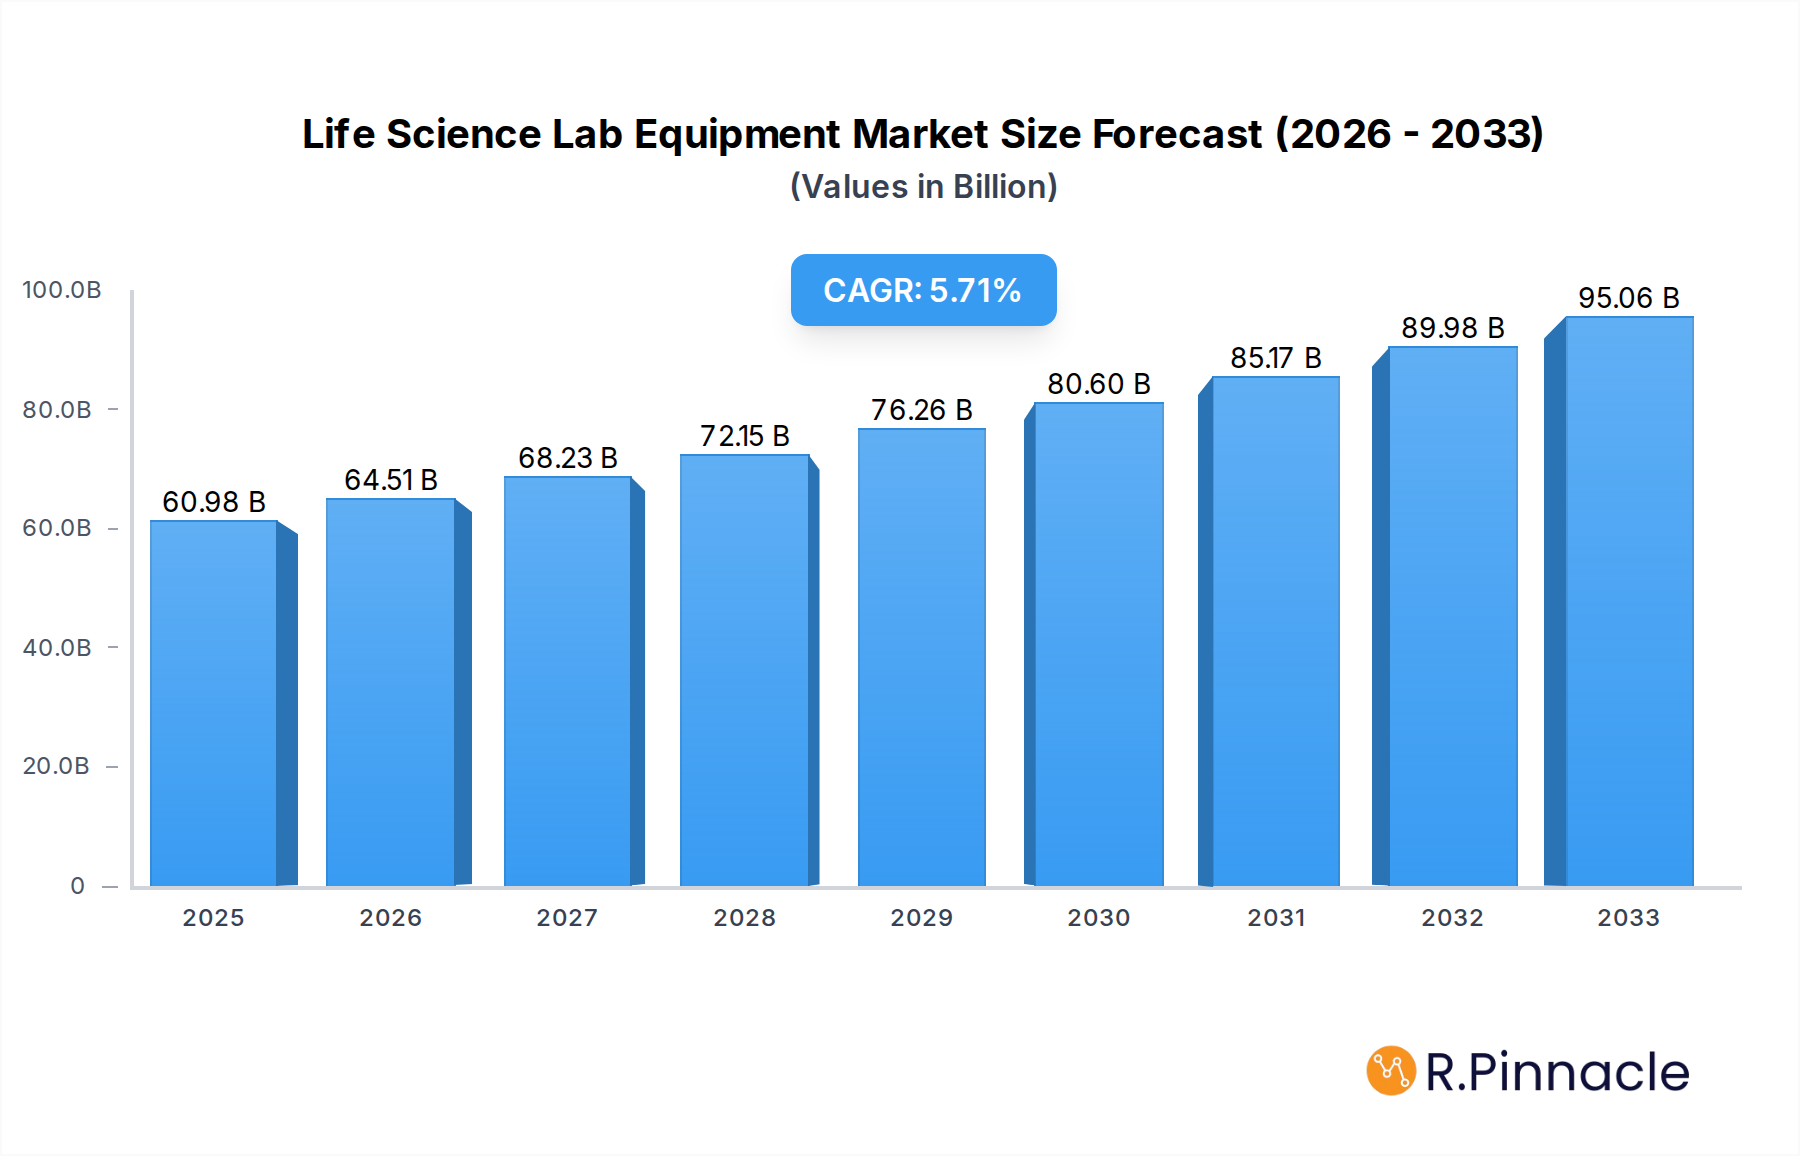
The global Life Science Lab Equipment market is poised for substantial growth, projected to reach an estimated $60.98 billion in 2025. Driven by an ever-increasing demand for advanced research and development across pharmaceuticals, biotechnology, and academic institutions, this sector is experiencing a robust CAGR of 5.8%. The expansion is fueled by a confluence of factors including the relentless pursuit of novel drug discovery, the growing prevalence of chronic diseases necessitating advanced diagnostic tools, and the accelerating pace of genetic and molecular research. Furthermore, government initiatives promoting scientific exploration and increased funding for life sciences are providing a significant tailwind. The market's dynamism is further amplified by ongoing technological advancements, such as the integration of AI and automation in lab workflows, leading to more efficient and accurate research outcomes.

Life Science Lab Equipment Market Size (In Billion)
The market is segmented by application, with Pharma & Bio, and Academic & Government sectors emerging as dominant forces, reflecting the significant investments in these areas for groundbreaking discoveries and public health advancements. In terms of types, DNA/RNA Analysis and Protein Sequencer segments are witnessing heightened activity due to their critical role in personalized medicine and understanding disease mechanisms. Key players like Danaher, Thermo Fisher, and Roche are at the forefront, actively engaging in strategic collaborations and product innovations to capture market share. While the market exhibits strong growth, potential restraints such as high initial investment costs for sophisticated equipment and stringent regulatory approvals for new technologies may present challenges. Nevertheless, the overarching trend points towards a continued upward trajectory, underscoring the indispensable role of life science lab equipment in addressing global health challenges and driving scientific progress.
Life Science Lab Equipment Company Market Share
Gain unparalleled insights into the global Life Science Lab Equipment market with this in-depth report. Covering the historical period from 2019–2024, base year 2025, and a comprehensive forecast period up to 2033, this report offers critical data for strategic decision-making. We analyze market structure, dynamics, dominant regions, product innovations, growth drivers, challenges, and emerging opportunities, providing a holistic view of this vital industry.
Life Science Lab Equipment Market Structure & Innovation Trends
The global Life Science Lab Equipment market exhibits a moderately concentrated structure, with key players like Danaher, Thermo Fisher Scientific, and Shimadzu holding significant market share, estimated to be in the billions. Innovation is primarily driven by advancements in molecular biology, genomics, proteomics, and cell imaging technologies, fueling demand for sophisticated analytical instruments. Regulatory frameworks, particularly stringent compliance requirements for pharmaceutical and biotechnology applications, shape product development and market entry strategies. The threat of product substitutes, while present in simpler laboratory consumables, is minimal for high-end analytical instrumentation where performance and specificity are paramount. End-user demographics are dominated by the Pharma & Bio sector, followed by Academic & Government institutions, and the broader Industry segment. Mergers and acquisitions (M&A) are a consistent feature, with multi-billion dollar deals aimed at consolidating market positions, acquiring innovative technologies, and expanding product portfolios. For instance, recent M&A activities have focused on companies specializing in single-cell analysis and advanced sequencing technologies.
Life Science Lab Equipment Market Dynamics & Trends
The Life Science Lab Equipment market is propelled by a robust set of growth drivers, chief among them being the escalating global investments in life science research and development, projected to reach trillions in the coming years. The increasing prevalence of chronic diseases worldwide necessitates advanced diagnostic and therapeutic research, directly translating into higher demand for sophisticated lab equipment. Technological disruptions are continuously reshaping the landscape; advancements in automation, artificial intelligence (AI) integration in data analysis, and miniaturization of instruments are enhancing efficiency and accuracy in laboratories. Consumer preferences are shifting towards integrated solutions and user-friendly interfaces, alongside a growing demand for real-time data acquisition and cloud-based data management. Competitive dynamics are intense, with companies investing heavily in R&D to gain a competitive edge. Market penetration is steadily increasing across various application areas, particularly in drug discovery, personalized medicine, and synthetic biology. The estimated Compound Annual Growth Rate (CAGR) for the forecast period is xx%, reflecting sustained growth fueled by these underlying trends. The market size in the base year is valued at billions, with significant expansion anticipated.
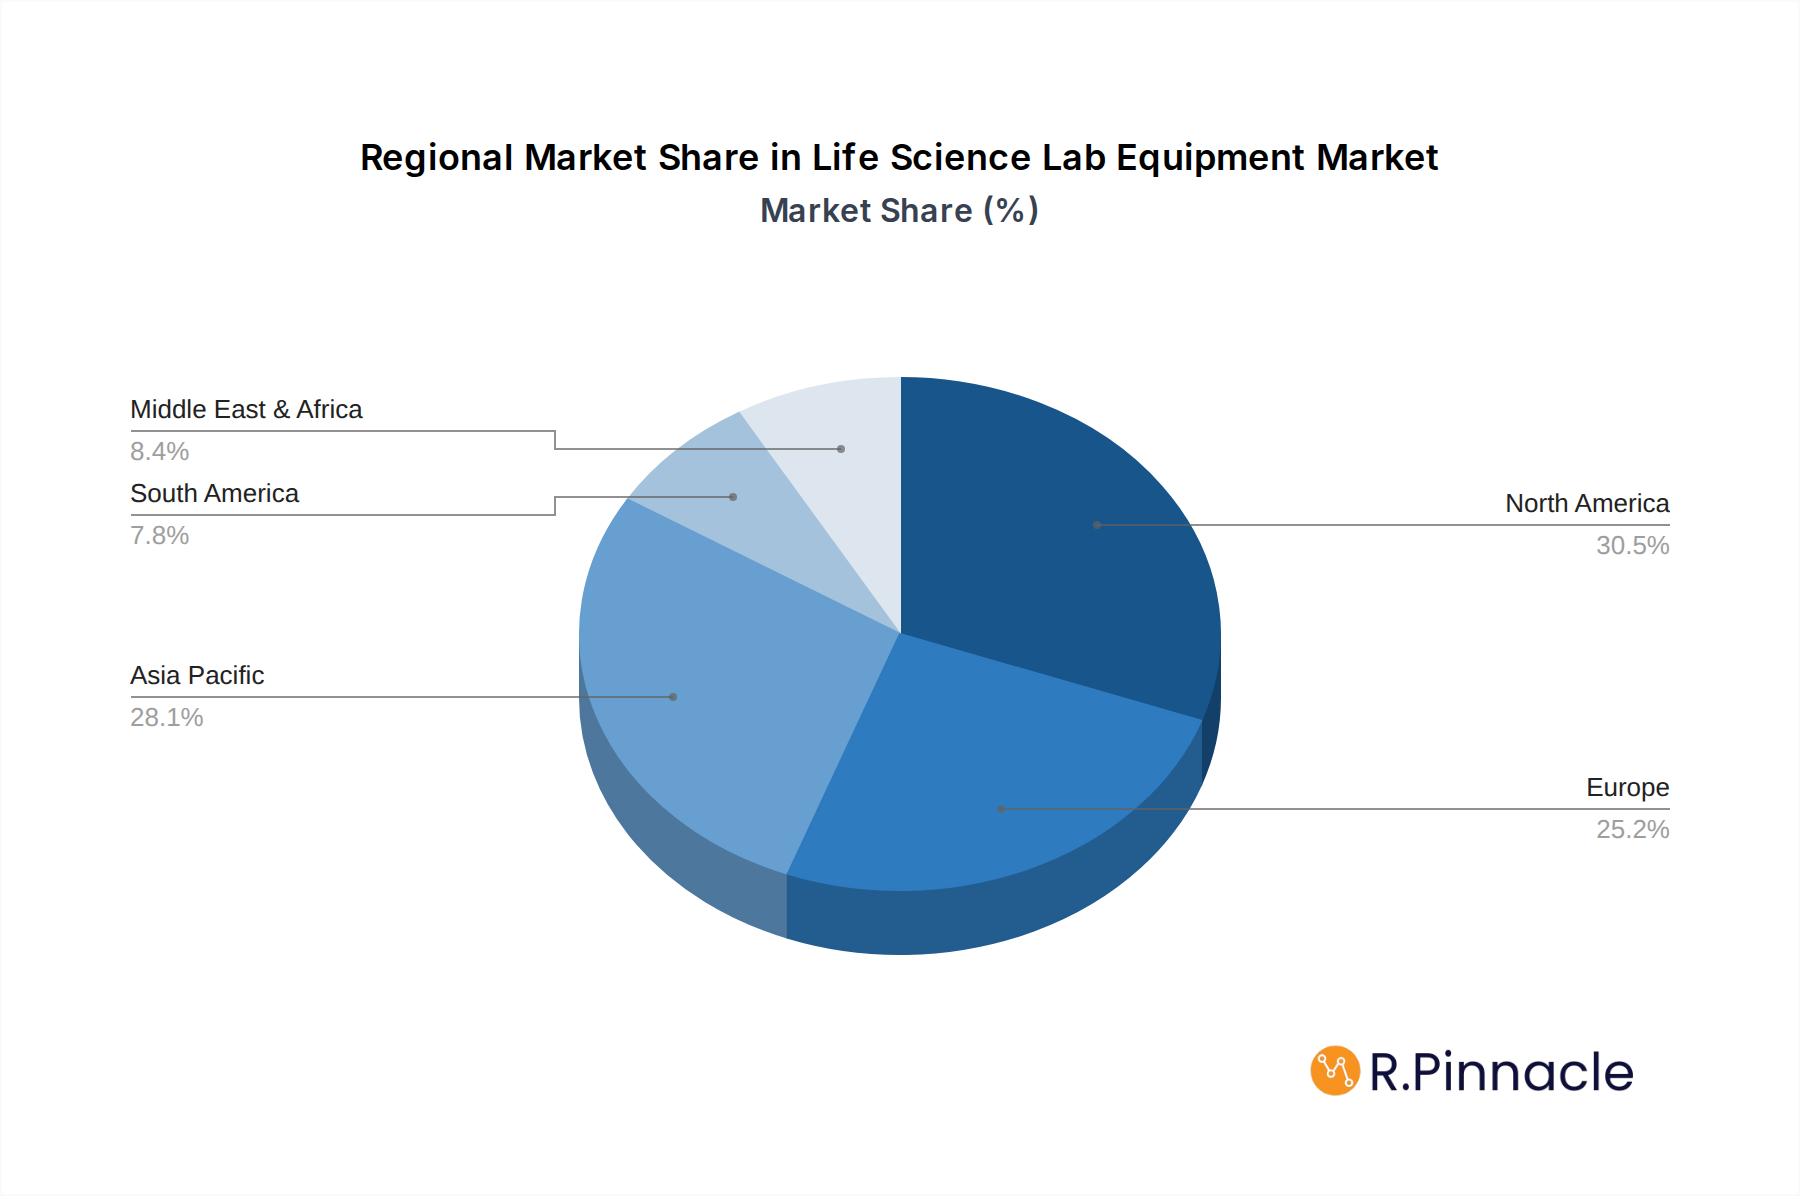
Dominant Regions & Segments in Life Science Lab Equipment
North America currently leads the Life Science Lab Equipment market, driven by substantial government funding for scientific research, a strong presence of leading pharmaceutical and biotechnology companies, and a highly developed academic research infrastructure. The United States, in particular, accounts for a significant portion of the regional market share. Economic policies in this region actively support R&D initiatives, further bolstering market growth. In terms of application, the Pharma & Bio segment is the largest and fastest-growing, fueled by extensive drug discovery, development, and manufacturing activities. Within product types, DNA/RNA Analysis and Imaging technologies are experiencing significant demand due to their critical roles in genomics, diagnostics, and preclinical research. Academic & Government research institutions represent a substantial and consistent market for a wide array of lab equipment, driven by fundamental research endeavors and the pursuit of scientific breakthroughs. The Industry segment, encompassing areas like food and beverage testing and environmental monitoring, also contributes to market diversification. The forecast period anticipates continued dominance of North America, with Asia Pacific showing rapid growth due to increasing R&D investments and a burgeoning biopharmaceutical industry.
Life Science Lab Equipment Product Innovations
Product innovations in the Life Science Lab Equipment sector are characterized by a focus on enhanced sensitivity, throughput, and automation. Companies are developing next-generation sequencing platforms offering higher accuracy and lower cost per genome, alongside advanced imaging systems providing unprecedented cellular resolution. The integration of AI and machine learning into analytical instruments is revolutionizing data interpretation, accelerating discovery timelines. Furthermore, the development of benchtop instruments for complex analyses previously requiring large, centralized facilities is democratizing access to cutting-edge technologies. These innovations provide significant competitive advantages by enabling faster, more precise research outcomes and streamlining laboratory workflows.
Report Scope & Segmentation Analysis
This report meticulously segments the Life Science Lab Equipment market across key applications: Pharma & Bio, Academic & Government, Industry, and Others. The Pharma & Bio segment, expected to reach a market size of billions by 2033 with a CAGR of xx%, is driven by drug discovery and development. The Academic & Government segment, with a projected market size of billions, caters to fundamental research and is characterized by steady growth. The Industry segment, encompassing diverse applications like environmental testing and food safety, is also anticipated to expand. Within product types, the market is analyzed by DNA/RNA Analysis, Protein Sequencer, Imaging, Cell Research, and Others. DNA/RNA Analysis is projected to be a leading segment, followed closely by Imaging technologies, both experiencing robust growth due to their indispensable roles in modern life science research.
Key Drivers of Life Science Lab Equipment Growth
The growth of the Life Science Lab Equipment market is propelled by several key factors. Technological advancements, including automation, AI integration, and miniaturization, are driving innovation and improving laboratory efficiency. The increasing global burden of diseases and the subsequent demand for novel diagnostics and therapeutics are significant market accelerators. Robust government funding for scientific research and development, particularly in genomics, proteomics, and personalized medicine, plays a crucial role. Furthermore, the growing biopharmaceutical industry, with its continuous need for sophisticated analytical tools for drug discovery and manufacturing, is a primary growth engine.
Challenges in the Life Science Lab Equipment Sector
Despite its strong growth trajectory, the Life Science Lab Equipment sector faces several challenges. Stringent regulatory approval processes for new instruments, especially those impacting healthcare, can lead to prolonged market entry timelines and increased development costs. Supply chain disruptions, as witnessed in recent global events, can impact the availability of critical components and raw materials, leading to production delays and increased costs. Intense competition among established players and emerging innovators necessitates continuous investment in R&D to maintain market share, posing a financial strain. High initial capital investment for advanced instrumentation also presents a barrier for smaller research institutions and developing markets.
Emerging Opportunities in Life Science Lab Equipment
The Life Science Lab Equipment market is ripe with emerging opportunities. The burgeoning field of personalized medicine, requiring highly specific and sensitive diagnostic and analytical tools, presents a significant growth avenue. The increasing focus on synthetic biology and gene editing technologies is driving demand for specialized equipment for cellular manipulation and analysis. The expansion of the biopharmaceutical sector in emerging economies, particularly in Asia Pacific and Latin America, offers new market penetration opportunities. Furthermore, the growing adoption of cloud-based data management and AI-driven analytics for life science research creates opportunities for integrated software and hardware solutions.
Leading Players in the Life Science Lab Equipment Market
- Danaher
- Thermo Fisher Scientific
- Shimadzu
- Roche
- Agilent
- Bruker
- Waters
- PerkinElmer
- Bio-Rad Laboratories
- Mettler Toledo
- Illumina
- Sartorius
- HORIBA
- MGI Tech
- JEOL
- Eppendorf
Key Developments in Life Science Lab Equipment Industry
- 2023: Launch of next-generation ultra-high-performance liquid chromatography (UHPLC) systems with enhanced sensitivity and speed.
- 2023: Introduction of AI-powered imaging platforms for faster and more accurate cell analysis.
- 2022: Acquisition of a leading proteomics company by a major instrument manufacturer to expand its portfolio.
- 2022: Development of portable DNA sequencers for field applications in infectious disease surveillance.
- 2021: Significant investment in the expansion of manufacturing facilities for single-cell analysis technologies.
- 2020: Introduction of automated high-throughput screening systems for drug discovery.
Future Outlook for Life Science Lab Equipment Market
The future outlook for the Life Science Lab Equipment market is exceptionally bright, driven by persistent innovation and expanding research frontiers. The convergence of AI, automation, and advanced analytics will continue to redefine laboratory capabilities, enabling unprecedented breakthroughs in areas like disease treatment and fundamental biological understanding. Growth accelerators include the increasing demand for personalized medicine, the rapid expansion of the global biopharmaceutical industry, and sustained investments in life sciences R&D. Strategic opportunities lie in catering to the evolving needs of emerging markets and developing integrated, data-driven solutions that streamline the entire research lifecycle. The market is poised for continued expansion, with market valuations projected to reach tens of billions in the coming decade.
Life Science Lab Equipment Segmentation
-
1. Application
- 1.1. Pharma & Bio
- 1.2. Academic & Government
- 1.3. Industry
- 1.4. Others
-
2. Types
- 2.1. DNA/RNA Analysis
- 2.2. Protein Sequencer
- 2.3. Imaging
- 2.4. Cell Research
- 2.5. Others
Life Science Lab Equipment Segmentation By Geography
-
1. North America
- 1.1. United States
- 1.2. Canada
- 1.3. Mexico
-
2. South America
- 2.1. Brazil
- 2.2. Argentina
- 2.3. Rest of South America
-
3. Europe
- 3.1. United Kingdom
- 3.2. Germany
- 3.3. France
- 3.4. Italy
- 3.5. Spain
- 3.6. Russia
- 3.7. Benelux
- 3.8. Nordics
- 3.9. Rest of Europe
-
4. Middle East & Africa
- 4.1. Turkey
- 4.2. Israel
- 4.3. GCC
- 4.4. North Africa
- 4.5. South Africa
- 4.6. Rest of Middle East & Africa
-
5. Asia Pacific
- 5.1. China
- 5.2. India
- 5.3. Japan
- 5.4. South Korea
- 5.5. ASEAN
- 5.6. Oceania
- 5.7. Rest of Asia Pacific
Life Science Lab Equipment Regional Market Share
Geographic Coverage of Life Science Lab Equipment
Life Science Lab Equipment REPORT HIGHLIGHTS
| Aspects | Details |
|---|---|
| Study Period | 2020-2034 |
| Base Year | 2025 |
| Estimated Year | 2026 |
| Forecast Period | 2026-2034 |
| Historical Period | 2020-2025 |
| Growth Rate | CAGR of 5.8% from 2020-2034 |
| Segmentation |
|
Table of Contents
- 1. Introduction
- 1.1. Research Scope
- 1.2. Market Segmentation
- 1.3. Research Methodology
- 1.4. Definitions and Assumptions
- 2. Executive Summary
- 2.1. Introduction
- 3. Market Dynamics
- 3.1. Introduction
- 3.2. Market Drivers
- 3.3. Market Restrains
- 3.4. Market Trends
- 4. Market Factor Analysis
- 4.1. Porters Five Forces
- 4.2. Supply/Value Chain
- 4.3. PESTEL analysis
- 4.4. Market Entropy
- 4.5. Patent/Trademark Analysis
- 5. Global Life Science Lab Equipment Analysis, Insights and Forecast, 2020-2032
- 5.1. Market Analysis, Insights and Forecast - by Application
- 5.1.1. Pharma & Bio
- 5.1.2. Academic & Government
- 5.1.3. Industry
- 5.1.4. Others
- 5.2. Market Analysis, Insights and Forecast - by Types
- 5.2.1. DNA/RNA Analysis
- 5.2.2. Protein Sequencer
- 5.2.3. Imaging
- 5.2.4. Cell Research
- 5.2.5. Others
- 5.3. Market Analysis, Insights and Forecast - by Region
- 5.3.1. North America
- 5.3.2. South America
- 5.3.3. Europe
- 5.3.4. Middle East & Africa
- 5.3.5. Asia Pacific
- 5.1. Market Analysis, Insights and Forecast - by Application
- 6. North America Life Science Lab Equipment Analysis, Insights and Forecast, 2020-2032
- 6.1. Market Analysis, Insights and Forecast - by Application
- 6.1.1. Pharma & Bio
- 6.1.2. Academic & Government
- 6.1.3. Industry
- 6.1.4. Others
- 6.2. Market Analysis, Insights and Forecast - by Types
- 6.2.1. DNA/RNA Analysis
- 6.2.2. Protein Sequencer
- 6.2.3. Imaging
- 6.2.4. Cell Research
- 6.2.5. Others
- 6.1. Market Analysis, Insights and Forecast - by Application
- 7. South America Life Science Lab Equipment Analysis, Insights and Forecast, 2020-2032
- 7.1. Market Analysis, Insights and Forecast - by Application
- 7.1.1. Pharma & Bio
- 7.1.2. Academic & Government
- 7.1.3. Industry
- 7.1.4. Others
- 7.2. Market Analysis, Insights and Forecast - by Types
- 7.2.1. DNA/RNA Analysis
- 7.2.2. Protein Sequencer
- 7.2.3. Imaging
- 7.2.4. Cell Research
- 7.2.5. Others
- 7.1. Market Analysis, Insights and Forecast - by Application
- 8. Europe Life Science Lab Equipment Analysis, Insights and Forecast, 2020-2032
- 8.1. Market Analysis, Insights and Forecast - by Application
- 8.1.1. Pharma & Bio
- 8.1.2. Academic & Government
- 8.1.3. Industry
- 8.1.4. Others
- 8.2. Market Analysis, Insights and Forecast - by Types
- 8.2.1. DNA/RNA Analysis
- 8.2.2. Protein Sequencer
- 8.2.3. Imaging
- 8.2.4. Cell Research
- 8.2.5. Others
- 8.1. Market Analysis, Insights and Forecast - by Application
- 9. Middle East & Africa Life Science Lab Equipment Analysis, Insights and Forecast, 2020-2032
- 9.1. Market Analysis, Insights and Forecast - by Application
- 9.1.1. Pharma & Bio
- 9.1.2. Academic & Government
- 9.1.3. Industry
- 9.1.4. Others
- 9.2. Market Analysis, Insights and Forecast - by Types
- 9.2.1. DNA/RNA Analysis
- 9.2.2. Protein Sequencer
- 9.2.3. Imaging
- 9.2.4. Cell Research
- 9.2.5. Others
- 9.1. Market Analysis, Insights and Forecast - by Application
- 10. Asia Pacific Life Science Lab Equipment Analysis, Insights and Forecast, 2020-2032
- 10.1. Market Analysis, Insights and Forecast - by Application
- 10.1.1. Pharma & Bio
- 10.1.2. Academic & Government
- 10.1.3. Industry
- 10.1.4. Others
- 10.2. Market Analysis, Insights and Forecast - by Types
- 10.2.1. DNA/RNA Analysis
- 10.2.2. Protein Sequencer
- 10.2.3. Imaging
- 10.2.4. Cell Research
- 10.2.5. Others
- 10.1. Market Analysis, Insights and Forecast - by Application
- 11. Competitive Analysis
- 11.1. Global Market Share Analysis 2025
- 11.2. Company Profiles
- 11.2.1 Danaher
- 11.2.1.1. Overview
- 11.2.1.2. Products
- 11.2.1.3. SWOT Analysis
- 11.2.1.4. Recent Developments
- 11.2.1.5. Financials (Based on Availability)
- 11.2.2 Thermo Fisher
- 11.2.2.1. Overview
- 11.2.2.2. Products
- 11.2.2.3. SWOT Analysis
- 11.2.2.4. Recent Developments
- 11.2.2.5. Financials (Based on Availability)
- 11.2.3 Shimadzu
- 11.2.3.1. Overview
- 11.2.3.2. Products
- 11.2.3.3. SWOT Analysis
- 11.2.3.4. Recent Developments
- 11.2.3.5. Financials (Based on Availability)
- 11.2.4 Roche
- 11.2.4.1. Overview
- 11.2.4.2. Products
- 11.2.4.3. SWOT Analysis
- 11.2.4.4. Recent Developments
- 11.2.4.5. Financials (Based on Availability)
- 11.2.5 Agilent
- 11.2.5.1. Overview
- 11.2.5.2. Products
- 11.2.5.3. SWOT Analysis
- 11.2.5.4. Recent Developments
- 11.2.5.5. Financials (Based on Availability)
- 11.2.6 Bruker
- 11.2.6.1. Overview
- 11.2.6.2. Products
- 11.2.6.3. SWOT Analysis
- 11.2.6.4. Recent Developments
- 11.2.6.5. Financials (Based on Availability)
- 11.2.7 Waters
- 11.2.7.1. Overview
- 11.2.7.2. Products
- 11.2.7.3. SWOT Analysis
- 11.2.7.4. Recent Developments
- 11.2.7.5. Financials (Based on Availability)
- 11.2.8 PerkinElmer
- 11.2.8.1. Overview
- 11.2.8.2. Products
- 11.2.8.3. SWOT Analysis
- 11.2.8.4. Recent Developments
- 11.2.8.5. Financials (Based on Availability)
- 11.2.9 Bio-Rad Laboratories
- 11.2.9.1. Overview
- 11.2.9.2. Products
- 11.2.9.3. SWOT Analysis
- 11.2.9.4. Recent Developments
- 11.2.9.5. Financials (Based on Availability)
- 11.2.10 Mettler Toledo
- 11.2.10.1. Overview
- 11.2.10.2. Products
- 11.2.10.3. SWOT Analysis
- 11.2.10.4. Recent Developments
- 11.2.10.5. Financials (Based on Availability)
- 11.2.11 Illumina
- 11.2.11.1. Overview
- 11.2.11.2. Products
- 11.2.11.3. SWOT Analysis
- 11.2.11.4. Recent Developments
- 11.2.11.5. Financials (Based on Availability)
- 11.2.12 Sartorius
- 11.2.12.1. Overview
- 11.2.12.2. Products
- 11.2.12.3. SWOT Analysis
- 11.2.12.4. Recent Developments
- 11.2.12.5. Financials (Based on Availability)
- 11.2.13 HORIBA
- 11.2.13.1. Overview
- 11.2.13.2. Products
- 11.2.13.3. SWOT Analysis
- 11.2.13.4. Recent Developments
- 11.2.13.5. Financials (Based on Availability)
- 11.2.14 MGI Tech
- 11.2.14.1. Overview
- 11.2.14.2. Products
- 11.2.14.3. SWOT Analysis
- 11.2.14.4. Recent Developments
- 11.2.14.5. Financials (Based on Availability)
- 11.2.15 JEOL
- 11.2.15.1. Overview
- 11.2.15.2. Products
- 11.2.15.3. SWOT Analysis
- 11.2.15.4. Recent Developments
- 11.2.15.5. Financials (Based on Availability)
- 11.2.16 Eppendorf
- 11.2.16.1. Overview
- 11.2.16.2. Products
- 11.2.16.3. SWOT Analysis
- 11.2.16.4. Recent Developments
- 11.2.16.5. Financials (Based on Availability)
- 11.2.1 Danaher
List of Figures
- Figure 1: Global Life Science Lab Equipment Revenue Breakdown (undefined, %) by Region 2025 & 2033
- Figure 2: North America Life Science Lab Equipment Revenue (undefined), by Application 2025 & 2033
- Figure 3: North America Life Science Lab Equipment Revenue Share (%), by Application 2025 & 2033
- Figure 4: North America Life Science Lab Equipment Revenue (undefined), by Types 2025 & 2033
- Figure 5: North America Life Science Lab Equipment Revenue Share (%), by Types 2025 & 2033
- Figure 6: North America Life Science Lab Equipment Revenue (undefined), by Country 2025 & 2033
- Figure 7: North America Life Science Lab Equipment Revenue Share (%), by Country 2025 & 2033
- Figure 8: South America Life Science Lab Equipment Revenue (undefined), by Application 2025 & 2033
- Figure 9: South America Life Science Lab Equipment Revenue Share (%), by Application 2025 & 2033
- Figure 10: South America Life Science Lab Equipment Revenue (undefined), by Types 2025 & 2033
- Figure 11: South America Life Science Lab Equipment Revenue Share (%), by Types 2025 & 2033
- Figure 12: South America Life Science Lab Equipment Revenue (undefined), by Country 2025 & 2033
- Figure 13: South America Life Science Lab Equipment Revenue Share (%), by Country 2025 & 2033
- Figure 14: Europe Life Science Lab Equipment Revenue (undefined), by Application 2025 & 2033
- Figure 15: Europe Life Science Lab Equipment Revenue Share (%), by Application 2025 & 2033
- Figure 16: Europe Life Science Lab Equipment Revenue (undefined), by Types 2025 & 2033
- Figure 17: Europe Life Science Lab Equipment Revenue Share (%), by Types 2025 & 2033
- Figure 18: Europe Life Science Lab Equipment Revenue (undefined), by Country 2025 & 2033
- Figure 19: Europe Life Science Lab Equipment Revenue Share (%), by Country 2025 & 2033
- Figure 20: Middle East & Africa Life Science Lab Equipment Revenue (undefined), by Application 2025 & 2033
- Figure 21: Middle East & Africa Life Science Lab Equipment Revenue Share (%), by Application 2025 & 2033
- Figure 22: Middle East & Africa Life Science Lab Equipment Revenue (undefined), by Types 2025 & 2033
- Figure 23: Middle East & Africa Life Science Lab Equipment Revenue Share (%), by Types 2025 & 2033
- Figure 24: Middle East & Africa Life Science Lab Equipment Revenue (undefined), by Country 2025 & 2033
- Figure 25: Middle East & Africa Life Science Lab Equipment Revenue Share (%), by Country 2025 & 2033
- Figure 26: Asia Pacific Life Science Lab Equipment Revenue (undefined), by Application 2025 & 2033
- Figure 27: Asia Pacific Life Science Lab Equipment Revenue Share (%), by Application 2025 & 2033
- Figure 28: Asia Pacific Life Science Lab Equipment Revenue (undefined), by Types 2025 & 2033
- Figure 29: Asia Pacific Life Science Lab Equipment Revenue Share (%), by Types 2025 & 2033
- Figure 30: Asia Pacific Life Science Lab Equipment Revenue (undefined), by Country 2025 & 2033
- Figure 31: Asia Pacific Life Science Lab Equipment Revenue Share (%), by Country 2025 & 2033
List of Tables
- Table 1: Global Life Science Lab Equipment Revenue undefined Forecast, by Application 2020 & 2033
- Table 2: Global Life Science Lab Equipment Revenue undefined Forecast, by Types 2020 & 2033
- Table 3: Global Life Science Lab Equipment Revenue undefined Forecast, by Region 2020 & 2033
- Table 4: Global Life Science Lab Equipment Revenue undefined Forecast, by Application 2020 & 2033
- Table 5: Global Life Science Lab Equipment Revenue undefined Forecast, by Types 2020 & 2033
- Table 6: Global Life Science Lab Equipment Revenue undefined Forecast, by Country 2020 & 2033
- Table 7: United States Life Science Lab Equipment Revenue (undefined) Forecast, by Application 2020 & 2033
- Table 8: Canada Life Science Lab Equipment Revenue (undefined) Forecast, by Application 2020 & 2033
- Table 9: Mexico Life Science Lab Equipment Revenue (undefined) Forecast, by Application 2020 & 2033
- Table 10: Global Life Science Lab Equipment Revenue undefined Forecast, by Application 2020 & 2033
- Table 11: Global Life Science Lab Equipment Revenue undefined Forecast, by Types 2020 & 2033
- Table 12: Global Life Science Lab Equipment Revenue undefined Forecast, by Country 2020 & 2033
- Table 13: Brazil Life Science Lab Equipment Revenue (undefined) Forecast, by Application 2020 & 2033
- Table 14: Argentina Life Science Lab Equipment Revenue (undefined) Forecast, by Application 2020 & 2033
- Table 15: Rest of South America Life Science Lab Equipment Revenue (undefined) Forecast, by Application 2020 & 2033
- Table 16: Global Life Science Lab Equipment Revenue undefined Forecast, by Application 2020 & 2033
- Table 17: Global Life Science Lab Equipment Revenue undefined Forecast, by Types 2020 & 2033
- Table 18: Global Life Science Lab Equipment Revenue undefined Forecast, by Country 2020 & 2033
- Table 19: United Kingdom Life Science Lab Equipment Revenue (undefined) Forecast, by Application 2020 & 2033
- Table 20: Germany Life Science Lab Equipment Revenue (undefined) Forecast, by Application 2020 & 2033
- Table 21: France Life Science Lab Equipment Revenue (undefined) Forecast, by Application 2020 & 2033
- Table 22: Italy Life Science Lab Equipment Revenue (undefined) Forecast, by Application 2020 & 2033
- Table 23: Spain Life Science Lab Equipment Revenue (undefined) Forecast, by Application 2020 & 2033
- Table 24: Russia Life Science Lab Equipment Revenue (undefined) Forecast, by Application 2020 & 2033
- Table 25: Benelux Life Science Lab Equipment Revenue (undefined) Forecast, by Application 2020 & 2033
- Table 26: Nordics Life Science Lab Equipment Revenue (undefined) Forecast, by Application 2020 & 2033
- Table 27: Rest of Europe Life Science Lab Equipment Revenue (undefined) Forecast, by Application 2020 & 2033
- Table 28: Global Life Science Lab Equipment Revenue undefined Forecast, by Application 2020 & 2033
- Table 29: Global Life Science Lab Equipment Revenue undefined Forecast, by Types 2020 & 2033
- Table 30: Global Life Science Lab Equipment Revenue undefined Forecast, by Country 2020 & 2033
- Table 31: Turkey Life Science Lab Equipment Revenue (undefined) Forecast, by Application 2020 & 2033
- Table 32: Israel Life Science Lab Equipment Revenue (undefined) Forecast, by Application 2020 & 2033
- Table 33: GCC Life Science Lab Equipment Revenue (undefined) Forecast, by Application 2020 & 2033
- Table 34: North Africa Life Science Lab Equipment Revenue (undefined) Forecast, by Application 2020 & 2033
- Table 35: South Africa Life Science Lab Equipment Revenue (undefined) Forecast, by Application 2020 & 2033
- Table 36: Rest of Middle East & Africa Life Science Lab Equipment Revenue (undefined) Forecast, by Application 2020 & 2033
- Table 37: Global Life Science Lab Equipment Revenue undefined Forecast, by Application 2020 & 2033
- Table 38: Global Life Science Lab Equipment Revenue undefined Forecast, by Types 2020 & 2033
- Table 39: Global Life Science Lab Equipment Revenue undefined Forecast, by Country 2020 & 2033
- Table 40: China Life Science Lab Equipment Revenue (undefined) Forecast, by Application 2020 & 2033
- Table 41: India Life Science Lab Equipment Revenue (undefined) Forecast, by Application 2020 & 2033
- Table 42: Japan Life Science Lab Equipment Revenue (undefined) Forecast, by Application 2020 & 2033
- Table 43: South Korea Life Science Lab Equipment Revenue (undefined) Forecast, by Application 2020 & 2033
- Table 44: ASEAN Life Science Lab Equipment Revenue (undefined) Forecast, by Application 2020 & 2033
- Table 45: Oceania Life Science Lab Equipment Revenue (undefined) Forecast, by Application 2020 & 2033
- Table 46: Rest of Asia Pacific Life Science Lab Equipment Revenue (undefined) Forecast, by Application 2020 & 2033
Frequently Asked Questions
1. What is the projected Compound Annual Growth Rate (CAGR) of the Life Science Lab Equipment?
The projected CAGR is approximately 5.8%.
2. Which companies are prominent players in the Life Science Lab Equipment?
Key companies in the market include Danaher, Thermo Fisher, Shimadzu, Roche, Agilent, Bruker, Waters, PerkinElmer, Bio-Rad Laboratories, Mettler Toledo, Illumina, Sartorius, HORIBA, MGI Tech, JEOL, Eppendorf.
3. What are the main segments of the Life Science Lab Equipment?
The market segments include Application, Types.
4. Can you provide details about the market size?
The market size is estimated to be USD XXX N/A as of 2022.
5. What are some drivers contributing to market growth?
N/A
6. What are the notable trends driving market growth?
N/A
7. Are there any restraints impacting market growth?
N/A
8. Can you provide examples of recent developments in the market?
N/A
9. What pricing options are available for accessing the report?
Pricing options include single-user, multi-user, and enterprise licenses priced at USD 4350.00, USD 6525.00, and USD 8700.00 respectively.
10. Is the market size provided in terms of value or volume?
The market size is provided in terms of value, measured in N/A.
11. Are there any specific market keywords associated with the report?
Yes, the market keyword associated with the report is "Life Science Lab Equipment," which aids in identifying and referencing the specific market segment covered.
12. How do I determine which pricing option suits my needs best?
The pricing options vary based on user requirements and access needs. Individual users may opt for single-user licenses, while businesses requiring broader access may choose multi-user or enterprise licenses for cost-effective access to the report.
13. Are there any additional resources or data provided in the Life Science Lab Equipment report?
While the report offers comprehensive insights, it's advisable to review the specific contents or supplementary materials provided to ascertain if additional resources or data are available.
14. How can I stay updated on further developments or reports in the Life Science Lab Equipment?
To stay informed about further developments, trends, and reports in the Life Science Lab Equipment, consider subscribing to industry newsletters, following relevant companies and organizations, or regularly checking reputable industry news sources and publications.
Methodology
Step 1 - Identification of Relevant Samples Size from Population Database


Step 2 - Approaches for Defining Global Market Size (Value, Volume* & Price*)

Note*: In applicable scenarios
Step 3 - Data Sources
Primary Research
- Web Analytics
- Survey Reports
- Research Institute
- Latest Research Reports
- Opinion Leaders
Secondary Research
- Annual Reports
- White Paper
- Latest Press Release
- Industry Association
- Paid Database
- Investor Presentations

Step 4 - Data Triangulation
Involves using different sources of information in order to increase the validity of a study
These sources are likely to be stakeholders in a program - participants, other researchers, program staff, other community members, and so on.
Then we put all data in single framework & apply various statistical tools to find out the dynamic on the market.
During the analysis stage, feedback from the stakeholder groups would be compared to determine areas of agreement as well as areas of divergence