


Key Insights
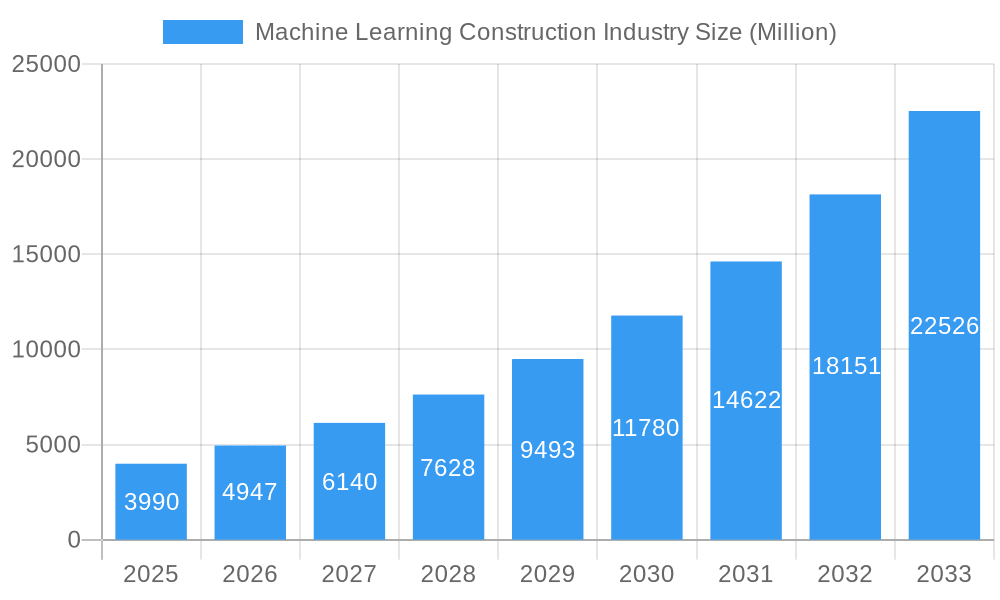
The Machine Learning (ML) in Construction market is experiencing robust growth, projected to reach $3.99 billion in 2025 and exhibiting a Compound Annual Growth Rate (CAGR) of 24.31%. This expansion is fueled by several key drivers. The increasing need for enhanced safety protocols on construction sites is a major factor, with ML-powered solutions improving risk assessment and accident prevention. Furthermore, the rising adoption of autonomous equipment and the demand for improved project planning and design efficiency are significantly contributing to market growth. The ability of ML to optimize resource allocation, predict potential delays, and enhance overall project management is attracting significant investment. Finally, the integration of ML into monitoring and maintenance processes allows for proactive identification of potential issues, reducing downtime and costs. This market is segmented by application, with planning and design, safety, autonomous equipment, and monitoring and maintenance segments all experiencing substantial growth. North America currently holds a significant market share, driven by early adoption and technological advancements, but the Asia-Pacific region is poised for rapid expansion due to increasing infrastructure development and investment in technological solutions within the construction industry. Leading players like Autodesk, Bentley Systems, IBM, and others are driving innovation through continuous product development and strategic partnerships.

Machine Learning Construction Industry Market Size (In Billion)

The market's growth trajectory is expected to continue throughout the forecast period (2025-2033). However, certain restraints might influence the pace of adoption. These include the initial high investment costs associated with implementing ML solutions, the need for skilled professionals to operate and maintain these systems, and concerns regarding data security and privacy. Despite these challenges, the long-term benefits of increased efficiency, safety, and cost reduction are expected to outweigh the initial hurdles, leading to sustained growth in the ML in Construction market. The continuous development of more user-friendly interfaces and the integration of ML with other technologies, such as Building Information Modeling (BIM), will further accelerate market adoption and solidify its position as a transformative force within the construction industry.
Machine Learning Construction Industry Company Market Share
Machine Learning Construction Industry Market Report: 2019-2033
This comprehensive report provides a detailed analysis of the Machine Learning Construction Industry, projecting a market value exceeding $XX Million by 2033. It offers actionable insights for industry professionals, investors, and stakeholders seeking to navigate this rapidly evolving landscape. The report covers market structure, dynamics, key players, and future trends, utilizing data from 2019-2024 (Historical Period), with estimations for 2025 (Base Year and Estimated Year) and a forecast spanning 2025-2033 (Forecast Period).
Machine Learning Construction Industry Market Structure & Innovation Trends
This section analyzes the market's competitive landscape, identifying key players and their market share, while also exploring the drivers of innovation, regulatory aspects, and market dynamics. The study period covers 2019-2033.
Market Concentration: The market exhibits a moderately concentrated structure, with several major players like IBM Corporation, Microsoft Corporation, Autodesk Inc, and Bentley Systems Inc holding significant shares. However, a number of smaller, specialized companies are also contributing to innovation. Precise market share data will be detailed within the full report.
Innovation Drivers: Key drivers include advancements in AI algorithms, the increasing availability of sensor data from construction sites, and growing demand for improved efficiency and safety.
Regulatory Frameworks: Government regulations related to safety, data privacy, and sustainability are influencing technology adoption and market growth. Specific regional regulations are analyzed within the report.
Product Substitutes: Traditional methods of construction project management pose competition but are being gradually replaced due to ML's efficiency advantages.
End-User Demographics: The report segments end-users by company size, project type, and geographic location, providing detailed insights into adoption rates.
M&A Activities: The report tracks significant mergers and acquisitions (M&A) in the sector, including deal values and their strategic implications. For example, the acquisition of Swipez by Briq in September 2022 demonstrates the consolidation trend. The total value of M&A activities in the period 2019-2024 is estimated at $XX Million.
Machine Learning Construction Industry Market Dynamics & Trends
This section delves into the market's growth trajectory, technological shifts, and evolving consumer preferences. The compound annual growth rate (CAGR) and market penetration rates are analyzed for each segment within the forecast period (2025-2033). Key growth drivers, such as increased investment in infrastructure projects and the demand for improved project predictability, will be explored. Technological disruptions, primarily AI-driven innovations, will also be examined, alongside competitive dynamics, including strategic partnerships, product differentiation, and pricing strategies. The analysis will cover all aspects of market evolution from 2019-2033, using data to support all conclusions. The anticipated CAGR for the period 2025-2033 is estimated at xx%.
Dominant Regions & Segments in Machine Learning Construction Industry
This section identifies the leading regions and application segments within the Machine Learning Construction Industry. The market is expected to be dominated by North America and Europe initially, but Asia-Pacific will show robust growth.
Dominant Segments (By Application):
Planning and Design: This segment is expected to be a major driver of market growth due to the ability of ML to optimize design processes, reduce material waste, and enhance project planning accuracy.
Safety: Increasing focus on worker safety drives adoption of ML-powered solutions for hazard detection and risk assessment.
Autonomous Equipment: The adoption of autonomous equipment is growing albeit slowly due to high upfront costs and technological complexities.
Monitoring and Maintenance: Predictive maintenance capabilities offered by ML are proving invaluable for reducing downtime and operational costs.
Key Drivers (Regional Variation):
- Economic Policies: Government incentives and infrastructure investments significantly impact regional growth. Specific examples from key regions are included in the full report.
- Infrastructure Development: Regions with extensive infrastructure projects will experience faster adoption.
The full report provides a detailed analysis of regional and segmental dominance, factoring in economic indicators and infrastructure development.
Machine Learning Construction Industry Product Innovations
Recent product innovations include AI-powered platforms for project management, 360° site scanning solutions (like Disperse.io's Impulse), and automated billing software (Swipez). These innovations enhance efficiency, improve safety, and provide real-time insights for better decision-making. The integration of AI and machine learning is continuously improving product offerings, making them more efficient and capable of handling large and complex datasets.
Report Scope & Segmentation Analysis
This report segments the Machine Learning Construction Industry primarily by application: Planning and Design, Safety, Autonomous Equipment, and Monitoring and Maintenance. Each segment's market size, growth projections, and competitive landscape are analyzed in detail within the full report. For example, the Planning and Design segment is expected to grow at a significant rate due to increased demand for efficient and cost-effective project planning.
Key Drivers of Machine Learning Construction Industry Growth
Several factors drive market growth, including technological advancements in AI and machine learning, increasing government investments in infrastructure projects, and a growing focus on improving safety and efficiency in construction. The need for data-driven decision-making and the development of user-friendly software solutions are also significant drivers of market expansion.
Challenges in the Machine Learning Construction Industry Sector
Despite the growth potential, challenges remain. High initial investment costs for ML-based technologies, concerns around data privacy and security, and the need for skilled professionals to implement and manage these systems pose significant hurdles. The complexity of integrating ML solutions with existing infrastructure can also slow adoption. Resistance to change within traditionally conservative construction companies also presents a challenge.
Emerging Opportunities in Machine Learning Construction Industry
Emerging opportunities include the expansion of ML applications into new construction sub-sectors, the development of more sophisticated AI algorithms, and increased use of IoT devices to collect data from construction sites. Further integration with BIM (Building Information Modeling) systems presents significant potential for enhancing productivity and optimizing project delivery. The increasing accessibility of cloud-based ML solutions also opens opportunities for smaller companies.
Leading Players in the Machine Learning Construction Industry Market
- Smartvid.io Inc
- Lurtis Rules S L
- IBM Corporation
- eSUB Inc
- NVIDIA Corporation
- Alice Technologies Inc
- Microsoft Corporation
- Building System Planning Inc
- Dassault Systèmes SE
- PTC Inc
- Autodesk Inc
- Oracle Corporation
- Bentley Systems Inc
- Doxel Inc
Key Developments in Machine Learning Construction Industry
- November 2022: Disperse.io launched Impulse, integrating 360° site scan analysis for improved project management.
- September 2022: Briq acquired Swipez, enhancing its platform's financial automation capabilities.
- June 2022: Agile Business Technology (ABT) partnered with OpenSpace, introducing a 360° capture and AI platform to South Africa.
Future Outlook for Machine Learning Construction Industry Market
The Machine Learning Construction Industry is poised for significant growth, driven by continuous technological advancements, increasing demand for efficiency and safety, and expanding government investments. The market's future potential is substantial, presenting significant strategic opportunities for companies that can effectively develop and deploy innovative ML-based solutions. The integration of new technologies like the metaverse and extended reality are likely to further enhance opportunities within the sector.
Machine Learning Construction Industry Segmentation
-
1. Application
- 1.1. Planning and Design
- 1.2. Safety
- 1.3. Autonomous Equipment
- 1.4. Monitoring and Maintenance
Machine Learning Construction Industry Segmentation By Geography
- 1. North America
- 2. Europe
- 3. Asia
- 4. Australia and New Zealand
- 5. Latin America

Machine Learning Construction Industry Regional Market Share
Geographic Coverage of Machine Learning Construction Industry
Machine Learning Construction Industry REPORT HIGHLIGHTS
| Aspects | Details |
|---|---|
| Study Period | 2020-2034 |
| Base Year | 2025 |
| Estimated Year | 2026 |
| Forecast Period | 2026-2034 |
| Historical Period | 2020-2025 |
| Growth Rate | CAGR of 24.31% from 2020-2034 |
| Segmentation |
|
Table of Contents
- 1. Introduction
- 1.1. Research Scope
- 1.2. Market Segmentation
- 1.3. Research Methodology
- 1.4. Definitions and Assumptions
- 2. Executive Summary
- 2.1. Introduction
- 3. Market Dynamics
- 3.1. Introduction
- 3.2. Market Drivers
- 3.2.1. Increasing Need to Reduce Production Costs; Demand for More Safety Measures at Construction Sites
- 3.3. Market Restrains
- 3.3.1. Cost and Implementation Issues
- 3.4. Market Trends
- 3.4.1. Planning and Design Application Segment is Expected to Hold Significant Market Share
- 4. Market Factor Analysis
- 4.1. Porters Five Forces
- 4.2. Supply/Value Chain
- 4.3. PESTEL analysis
- 4.4. Market Entropy
- 4.5. Patent/Trademark Analysis
- 5. Global Machine Learning Construction Industry Analysis, Insights and Forecast, 2020-2032
- 5.1. Market Analysis, Insights and Forecast - by Application
- 5.1.1. Planning and Design
- 5.1.2. Safety
- 5.1.3. Autonomous Equipment
- 5.1.4. Monitoring and Maintenance
- 5.2. Market Analysis, Insights and Forecast - by Region
- 5.2.1. North America
- 5.2.2. Europe
- 5.2.3. Asia
- 5.2.4. Australia and New Zealand
- 5.2.5. Latin America
- 5.1. Market Analysis, Insights and Forecast - by Application
- 6. North America Machine Learning Construction Industry Analysis, Insights and Forecast, 2020-2032
- 6.1. Market Analysis, Insights and Forecast - by Application
- 6.1.1. Planning and Design
- 6.1.2. Safety
- 6.1.3. Autonomous Equipment
- 6.1.4. Monitoring and Maintenance
- 6.1. Market Analysis, Insights and Forecast - by Application
- 7. Europe Machine Learning Construction Industry Analysis, Insights and Forecast, 2020-2032
- 7.1. Market Analysis, Insights and Forecast - by Application
- 7.1.1. Planning and Design
- 7.1.2. Safety
- 7.1.3. Autonomous Equipment
- 7.1.4. Monitoring and Maintenance
- 7.1. Market Analysis, Insights and Forecast - by Application
- 8. Asia Machine Learning Construction Industry Analysis, Insights and Forecast, 2020-2032
- 8.1. Market Analysis, Insights and Forecast - by Application
- 8.1.1. Planning and Design
- 8.1.2. Safety
- 8.1.3. Autonomous Equipment
- 8.1.4. Monitoring and Maintenance
- 8.1. Market Analysis, Insights and Forecast - by Application
- 9. Australia and New Zealand Machine Learning Construction Industry Analysis, Insights and Forecast, 2020-2032
- 9.1. Market Analysis, Insights and Forecast - by Application
- 9.1.1. Planning and Design
- 9.1.2. Safety
- 9.1.3. Autonomous Equipment
- 9.1.4. Monitoring and Maintenance
- 9.1. Market Analysis, Insights and Forecast - by Application
- 10. Latin America Machine Learning Construction Industry Analysis, Insights and Forecast, 2020-2032
- 10.1. Market Analysis, Insights and Forecast - by Application
- 10.1.1. Planning and Design
- 10.1.2. Safety
- 10.1.3. Autonomous Equipment
- 10.1.4. Monitoring and Maintenance
- 10.1. Market Analysis, Insights and Forecast - by Application
- 11. Competitive Analysis
- 11.1. Global Market Share Analysis 2025
- 11.2. Company Profiles
- 11.2.1 Smartvid io Inc
- 11.2.1.1. Overview
- 11.2.1.2. Products
- 11.2.1.3. SWOT Analysis
- 11.2.1.4. Recent Developments
- 11.2.1.5. Financials (Based on Availability)
- 11.2.2 Lurtis Rules S L
- 11.2.2.1. Overview
- 11.2.2.2. Products
- 11.2.2.3. SWOT Analysis
- 11.2.2.4. Recent Developments
- 11.2.2.5. Financials (Based on Availability)
- 11.2.3 IBM Corporation
- 11.2.3.1. Overview
- 11.2.3.2. Products
- 11.2.3.3. SWOT Analysis
- 11.2.3.4. Recent Developments
- 11.2.3.5. Financials (Based on Availability)
- 11.2.4 eSUB Inc
- 11.2.4.1. Overview
- 11.2.4.2. Products
- 11.2.4.3. SWOT Analysis
- 11.2.4.4. Recent Developments
- 11.2.4.5. Financials (Based on Availability)
- 11.2.5 NVIDIA Corporation
- 11.2.5.1. Overview
- 11.2.5.2. Products
- 11.2.5.3. SWOT Analysis
- 11.2.5.4. Recent Developments
- 11.2.5.5. Financials (Based on Availability)
- 11.2.6 Alice Technologies Inc
- 11.2.6.1. Overview
- 11.2.6.2. Products
- 11.2.6.3. SWOT Analysis
- 11.2.6.4. Recent Developments
- 11.2.6.5. Financials (Based on Availability)
- 11.2.7 Microsoft Corporation
- 11.2.7.1. Overview
- 11.2.7.2. Products
- 11.2.7.3. SWOT Analysis
- 11.2.7.4. Recent Developments
- 11.2.7.5. Financials (Based on Availability)
- 11.2.8 Building System Planning Inc
- 11.2.8.1. Overview
- 11.2.8.2. Products
- 11.2.8.3. SWOT Analysis
- 11.2.8.4. Recent Developments
- 11.2.8.5. Financials (Based on Availability)
- 11.2.9 Dassault Systems SE
- 11.2.9.1. Overview
- 11.2.9.2. Products
- 11.2.9.3. SWOT Analysis
- 11.2.9.4. Recent Developments
- 11.2.9.5. Financials (Based on Availability)
- 11.2.10 PTC Inc
- 11.2.10.1. Overview
- 11.2.10.2. Products
- 11.2.10.3. SWOT Analysis
- 11.2.10.4. Recent Developments
- 11.2.10.5. Financials (Based on Availability)
- 11.2.11 Autodesk Inc
- 11.2.11.1. Overview
- 11.2.11.2. Products
- 11.2.11.3. SWOT Analysis
- 11.2.11.4. Recent Developments
- 11.2.11.5. Financials (Based on Availability)
- 11.2.12 Oracle Corporation
- 11.2.12.1. Overview
- 11.2.12.2. Products
- 11.2.12.3. SWOT Analysis
- 11.2.12.4. Recent Developments
- 11.2.12.5. Financials (Based on Availability)
- 11.2.13 Bentley Systems Inc
- 11.2.13.1. Overview
- 11.2.13.2. Products
- 11.2.13.3. SWOT Analysis
- 11.2.13.4. Recent Developments
- 11.2.13.5. Financials (Based on Availability)
- 11.2.14 Doxel Inc
- 11.2.14.1. Overview
- 11.2.14.2. Products
- 11.2.14.3. SWOT Analysis
- 11.2.14.4. Recent Developments
- 11.2.14.5. Financials (Based on Availability)
- 11.2.1 Smartvid io Inc
List of Figures
- Figure 1: Global Machine Learning Construction Industry Revenue Breakdown (Million, %) by Region 2025 & 2033
- Figure 2: Global Machine Learning Construction Industry Volume Breakdown (K Unit, %) by Region 2025 & 2033
- Figure 3: North America Machine Learning Construction Industry Revenue (Million), by Application 2025 & 2033
- Figure 4: North America Machine Learning Construction Industry Volume (K Unit), by Application 2025 & 2033
- Figure 5: North America Machine Learning Construction Industry Revenue Share (%), by Application 2025 & 2033
- Figure 6: North America Machine Learning Construction Industry Volume Share (%), by Application 2025 & 2033
- Figure 7: North America Machine Learning Construction Industry Revenue (Million), by Country 2025 & 2033
- Figure 8: North America Machine Learning Construction Industry Volume (K Unit), by Country 2025 & 2033
- Figure 9: North America Machine Learning Construction Industry Revenue Share (%), by Country 2025 & 2033
- Figure 10: North America Machine Learning Construction Industry Volume Share (%), by Country 2025 & 2033
- Figure 11: Europe Machine Learning Construction Industry Revenue (Million), by Application 2025 & 2033
- Figure 12: Europe Machine Learning Construction Industry Volume (K Unit), by Application 2025 & 2033
- Figure 13: Europe Machine Learning Construction Industry Revenue Share (%), by Application 2025 & 2033
- Figure 14: Europe Machine Learning Construction Industry Volume Share (%), by Application 2025 & 2033
- Figure 15: Europe Machine Learning Construction Industry Revenue (Million), by Country 2025 & 2033
- Figure 16: Europe Machine Learning Construction Industry Volume (K Unit), by Country 2025 & 2033
- Figure 17: Europe Machine Learning Construction Industry Revenue Share (%), by Country 2025 & 2033
- Figure 18: Europe Machine Learning Construction Industry Volume Share (%), by Country 2025 & 2033
- Figure 19: Asia Machine Learning Construction Industry Revenue (Million), by Application 2025 & 2033
- Figure 20: Asia Machine Learning Construction Industry Volume (K Unit), by Application 2025 & 2033
- Figure 21: Asia Machine Learning Construction Industry Revenue Share (%), by Application 2025 & 2033
- Figure 22: Asia Machine Learning Construction Industry Volume Share (%), by Application 2025 & 2033
- Figure 23: Asia Machine Learning Construction Industry Revenue (Million), by Country 2025 & 2033
- Figure 24: Asia Machine Learning Construction Industry Volume (K Unit), by Country 2025 & 2033
- Figure 25: Asia Machine Learning Construction Industry Revenue Share (%), by Country 2025 & 2033
- Figure 26: Asia Machine Learning Construction Industry Volume Share (%), by Country 2025 & 2033
- Figure 27: Australia and New Zealand Machine Learning Construction Industry Revenue (Million), by Application 2025 & 2033
- Figure 28: Australia and New Zealand Machine Learning Construction Industry Volume (K Unit), by Application 2025 & 2033
- Figure 29: Australia and New Zealand Machine Learning Construction Industry Revenue Share (%), by Application 2025 & 2033
- Figure 30: Australia and New Zealand Machine Learning Construction Industry Volume Share (%), by Application 2025 & 2033
- Figure 31: Australia and New Zealand Machine Learning Construction Industry Revenue (Million), by Country 2025 & 2033
- Figure 32: Australia and New Zealand Machine Learning Construction Industry Volume (K Unit), by Country 2025 & 2033
- Figure 33: Australia and New Zealand Machine Learning Construction Industry Revenue Share (%), by Country 2025 & 2033
- Figure 34: Australia and New Zealand Machine Learning Construction Industry Volume Share (%), by Country 2025 & 2033
- Figure 35: Latin America Machine Learning Construction Industry Revenue (Million), by Application 2025 & 2033
- Figure 36: Latin America Machine Learning Construction Industry Volume (K Unit), by Application 2025 & 2033
- Figure 37: Latin America Machine Learning Construction Industry Revenue Share (%), by Application 2025 & 2033
- Figure 38: Latin America Machine Learning Construction Industry Volume Share (%), by Application 2025 & 2033
- Figure 39: Latin America Machine Learning Construction Industry Revenue (Million), by Country 2025 & 2033
- Figure 40: Latin America Machine Learning Construction Industry Volume (K Unit), by Country 2025 & 2033
- Figure 41: Latin America Machine Learning Construction Industry Revenue Share (%), by Country 2025 & 2033
- Figure 42: Latin America Machine Learning Construction Industry Volume Share (%), by Country 2025 & 2033
List of Tables
- Table 1: Global Machine Learning Construction Industry Revenue Million Forecast, by Application 2020 & 2033
- Table 2: Global Machine Learning Construction Industry Volume K Unit Forecast, by Application 2020 & 2033
- Table 3: Global Machine Learning Construction Industry Revenue Million Forecast, by Region 2020 & 2033
- Table 4: Global Machine Learning Construction Industry Volume K Unit Forecast, by Region 2020 & 2033
- Table 5: Global Machine Learning Construction Industry Revenue Million Forecast, by Application 2020 & 2033
- Table 6: Global Machine Learning Construction Industry Volume K Unit Forecast, by Application 2020 & 2033
- Table 7: Global Machine Learning Construction Industry Revenue Million Forecast, by Country 2020 & 2033
- Table 8: Global Machine Learning Construction Industry Volume K Unit Forecast, by Country 2020 & 2033
- Table 9: Global Machine Learning Construction Industry Revenue Million Forecast, by Application 2020 & 2033
- Table 10: Global Machine Learning Construction Industry Volume K Unit Forecast, by Application 2020 & 2033
- Table 11: Global Machine Learning Construction Industry Revenue Million Forecast, by Country 2020 & 2033
- Table 12: Global Machine Learning Construction Industry Volume K Unit Forecast, by Country 2020 & 2033
- Table 13: Global Machine Learning Construction Industry Revenue Million Forecast, by Application 2020 & 2033
- Table 14: Global Machine Learning Construction Industry Volume K Unit Forecast, by Application 2020 & 2033
- Table 15: Global Machine Learning Construction Industry Revenue Million Forecast, by Country 2020 & 2033
- Table 16: Global Machine Learning Construction Industry Volume K Unit Forecast, by Country 2020 & 2033
- Table 17: Global Machine Learning Construction Industry Revenue Million Forecast, by Application 2020 & 2033
- Table 18: Global Machine Learning Construction Industry Volume K Unit Forecast, by Application 2020 & 2033
- Table 19: Global Machine Learning Construction Industry Revenue Million Forecast, by Country 2020 & 2033
- Table 20: Global Machine Learning Construction Industry Volume K Unit Forecast, by Country 2020 & 2033
- Table 21: Global Machine Learning Construction Industry Revenue Million Forecast, by Application 2020 & 2033
- Table 22: Global Machine Learning Construction Industry Volume K Unit Forecast, by Application 2020 & 2033
- Table 23: Global Machine Learning Construction Industry Revenue Million Forecast, by Country 2020 & 2033
- Table 24: Global Machine Learning Construction Industry Volume K Unit Forecast, by Country 2020 & 2033
Frequently Asked Questions
1. What is the projected Compound Annual Growth Rate (CAGR) of the Machine Learning Construction Industry?
The projected CAGR is approximately 24.31%.
2. Which companies are prominent players in the Machine Learning Construction Industry?
Key companies in the market include Smartvid io Inc, Lurtis Rules S L, IBM Corporation, eSUB Inc , NVIDIA Corporation, Alice Technologies Inc, Microsoft Corporation, Building System Planning Inc, Dassault Systems SE, PTC Inc, Autodesk Inc, Oracle Corporation, Bentley Systems Inc, Doxel Inc.
3. What are the main segments of the Machine Learning Construction Industry?
The market segments include Application.
4. Can you provide details about the market size?
The market size is estimated to be USD 3.99 Million as of 2022.
5. What are some drivers contributing to market growth?
Increasing Need to Reduce Production Costs; Demand for More Safety Measures at Construction Sites.
6. What are the notable trends driving market growth?
Planning and Design Application Segment is Expected to Hold Significant Market Share.
7. Are there any restraints impacting market growth?
Cost and Implementation Issues.
8. Can you provide examples of recent developments in the market?
November 2022: Disperse.io, a UK-based construction technology company with a platform that used AI to help project managers track work, capture data from building sites, and make better project decisions, launched a new product, Impulse, that highlights issues gleaned from 360° site scans captured in its platform. This solution integrated performance insights into building elevations and presents problems to project managers.
9. What pricing options are available for accessing the report?
Pricing options include single-user, multi-user, and enterprise licenses priced at USD 4750, USD 5250, and USD 8750 respectively.
10. Is the market size provided in terms of value or volume?
The market size is provided in terms of value, measured in Million and volume, measured in K Unit.
11. Are there any specific market keywords associated with the report?
Yes, the market keyword associated with the report is "Machine Learning Construction Industry," which aids in identifying and referencing the specific market segment covered.
12. How do I determine which pricing option suits my needs best?
The pricing options vary based on user requirements and access needs. Individual users may opt for single-user licenses, while businesses requiring broader access may choose multi-user or enterprise licenses for cost-effective access to the report.
13. Are there any additional resources or data provided in the Machine Learning Construction Industry report?
While the report offers comprehensive insights, it's advisable to review the specific contents or supplementary materials provided to ascertain if additional resources or data are available.
14. How can I stay updated on further developments or reports in the Machine Learning Construction Industry?
To stay informed about further developments, trends, and reports in the Machine Learning Construction Industry, consider subscribing to industry newsletters, following relevant companies and organizations, or regularly checking reputable industry news sources and publications.
Methodology
Step 1 - Identification of Relevant Samples Size from Population Database


Step 2 - Approaches for Defining Global Market Size (Value, Volume* & Price*)

Note*: In applicable scenarios
Step 3 - Data Sources
Primary Research
- Web Analytics
- Survey Reports
- Research Institute
- Latest Research Reports
- Opinion Leaders
Secondary Research
- Annual Reports
- White Paper
- Latest Press Release
- Industry Association
- Paid Database
- Investor Presentations

Step 4 - Data Triangulation
Involves using different sources of information in order to increase the validity of a study
These sources are likely to be stakeholders in a program - participants, other researchers, program staff, other community members, and so on.
Then we put all data in single framework & apply various statistical tools to find out the dynamic on the market.
During the analysis stage, feedback from the stakeholder groups would be compared to determine areas of agreement as well as areas of divergence