

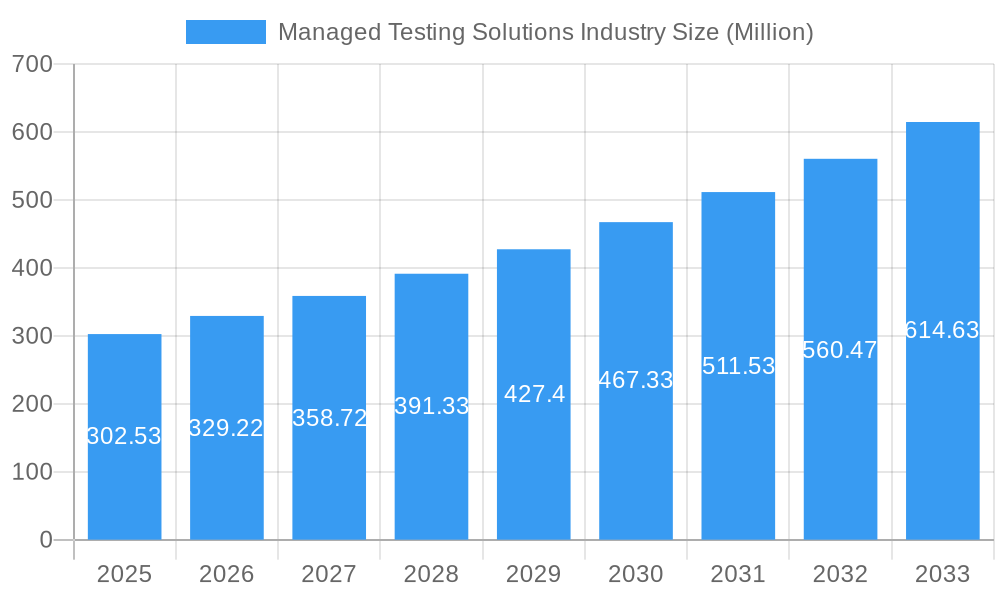
Key Insights
The Managed Testing Solutions market is experiencing robust growth, projected to reach \$302.53 million in 2025 and maintain a Compound Annual Growth Rate (CAGR) of 8.70% from 2025 to 2033. This expansion is driven by several key factors. The increasing complexity of software applications, coupled with the rising demand for high-quality software across various industries like Healthcare, BFSI (Banking, Financial Services, and Insurance), Telecom and IT, and Retail, necessitates the adoption of comprehensive managed testing services. Businesses are increasingly outsourcing testing activities to specialized providers to leverage their expertise, reduce operational costs, and ensure faster time-to-market. Furthermore, the global shift towards digital transformation and the growing adoption of cloud-based technologies are fueling the demand for reliable and scalable testing solutions. The market is segmented by organization size (SMEs and large enterprises), end-user vertical, and delivery model (onshore and offshore), each contributing uniquely to the overall growth trajectory. The competitive landscape comprises both established players like Infosys, Accenture, and IBM, and specialized testing firms, all vying for market share through innovation and strategic partnerships. The North American market currently holds a significant share due to early adoption and advanced technological infrastructure, but the Asia-Pacific region is poised for rapid growth, driven by increasing digitalization and a large pool of skilled professionals.
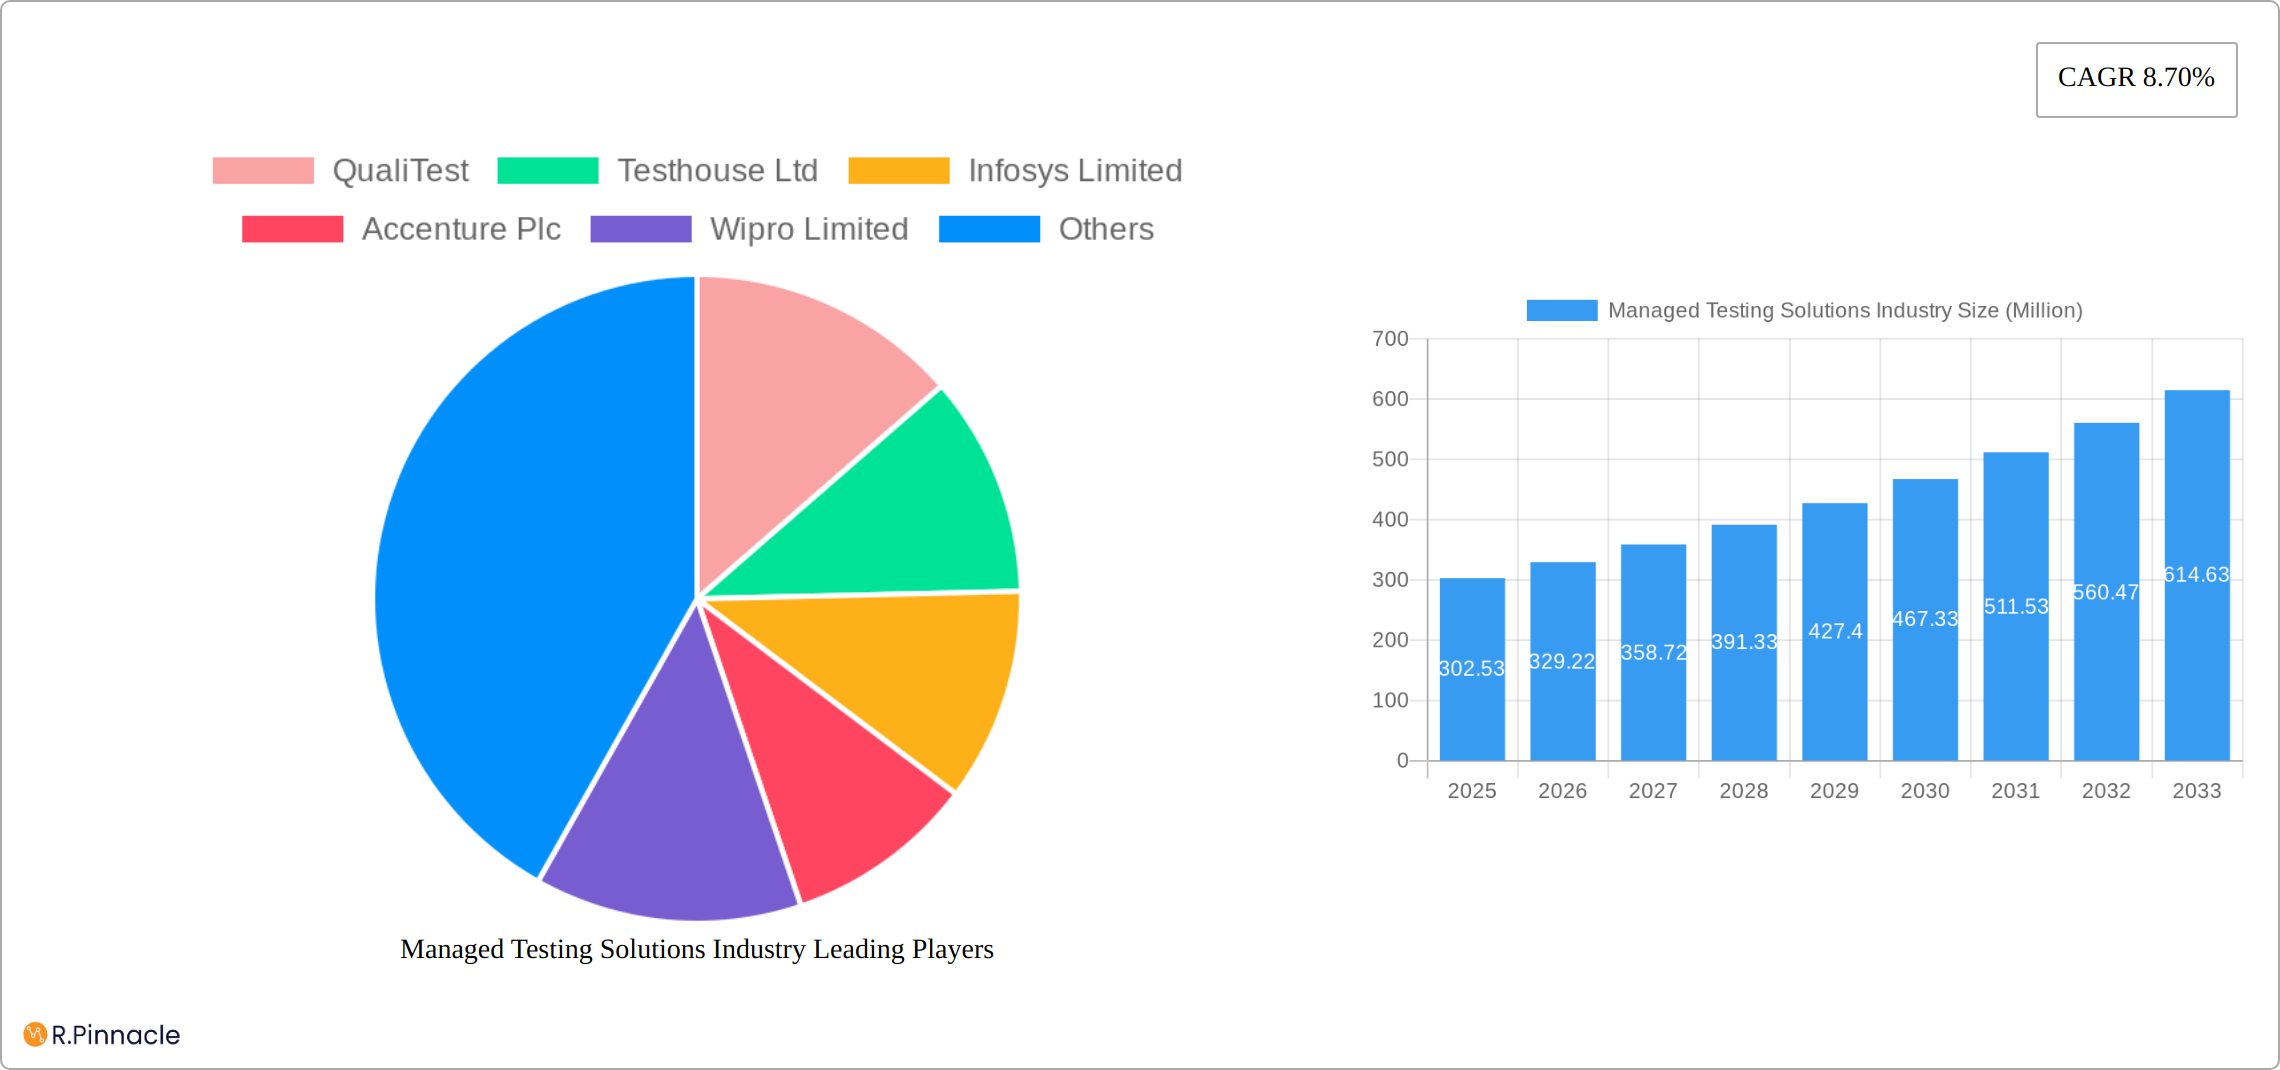
Managed Testing Solutions Industry Market Size (In Million)
The market's growth is expected to continue throughout the forecast period (2025-2033) due to sustained demand for quality assurance and increasing digital transformation across all sectors. While challenges like security concerns related to outsourcing and the need for continuous upskilling to adapt to evolving technologies exist, the overall market outlook remains positive. The diverse range of service offerings, including performance testing, security testing, and mobile app testing, ensures a wide application across multiple industries, contributing to a sustained growth trend. The market will likely see consolidation in the coming years, with larger players acquiring smaller firms to expand their service offerings and geographic reach. Furthermore, technological advancements in areas like AI and machine learning are anticipated to drive innovation within the managed testing solutions space, leading to further market expansion and improved testing efficiency.
Managed Testing Solutions Industry Company Market Share
Managed Testing Solutions Industry: A Comprehensive Market Report (2019-2033)
This in-depth report provides a comprehensive analysis of the Managed Testing Solutions industry, offering invaluable insights for industry professionals, investors, and strategic decision-makers. With a study period spanning 2019-2033, a base year of 2025, and a forecast period of 2025-2033, this report leverages extensive market research to deliver actionable intelligence on market size, growth drivers, competitive dynamics, and future opportunities. The global market is projected to reach $XX Million by 2033.
Managed Testing Solutions Industry Market Structure & Innovation Trends
This section analyzes the competitive landscape of the Managed Testing Solutions market, examining market concentration, innovation drivers, regulatory frameworks, and M&A activities. The market is characterized by a mix of large multinational corporations and specialized service providers. Key players such as QualiTest, Testhouse Ltd, Infosys Limited, Accenture Plc, Wipro Limited, Cognizant, TATA Consultancy Services Limited, Hexaware Technologies, Capgemini SE, and International Business Machines Corporation (IBM) hold significant market share, although the exact distribution is dynamic and subject to ongoing mergers and acquisitions.
- Market Concentration: The market exhibits moderate concentration, with the top 10 players accounting for an estimated XX% of the global revenue in 2025.
- Innovation Drivers: Demand for improved software quality, increasing adoption of Agile and DevOps methodologies, and the rise of AI-powered testing tools are driving innovation.
- Regulatory Frameworks: Compliance standards like GDPR and HIPAA influence testing requirements across various sectors, shaping the market's trajectory.
- Product Substitutes: Open-source testing tools and in-house development represent potential substitutes, though managed services offer scalability and expertise advantages.
- End-User Demographics: The industry serves a broad range of organizations, from small and medium enterprises (SMEs) to large enterprises across diverse verticals.
- M&A Activities: The Managed Testing Solutions sector has witnessed significant M&A activity in recent years, with deal values totaling $XX Million in 2024, primarily driven by consolidation and expansion into new markets.
Managed Testing Solutions Industry Market Dynamics & Trends
The Managed Testing Solutions market is experiencing robust growth, fueled by several key factors. The increasing complexity of software applications and the relentless pressure for faster time-to-market are driving a significant demand for specialized testing expertise. Digital transformation initiatives across diverse sectors are further accelerating this demand. The shift towards cloud-based testing, coupled with the integration of AI and automation, is fundamentally reshaping the market landscape. The market is projected to achieve a Compound Annual Growth Rate (CAGR) of XX% during the forecast period (2025-2033), with substantial market penetration anticipated in emerging economies. This rapid growth is being propelled by technological advancements, particularly in AI-powered test automation, which are streamlining testing processes, improving efficiency, and reducing costs. Furthermore, the ever-increasing consumer expectation for high-quality, reliable software products underscores the importance of robust testing and solidifies the market's growth trajectory. The competitive landscape is dynamic, with intense competition among established players and emerging niche providers driving continuous innovation and service differentiation, leading to a more sophisticated and comprehensive range of solutions.
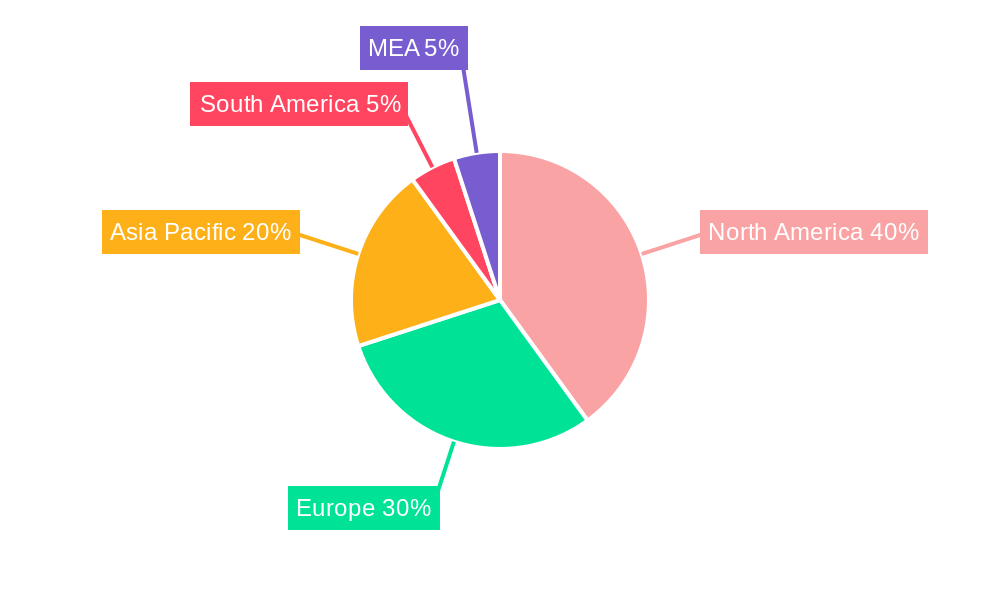
Dominant Regions & Segments in Managed Testing Solutions Industry
The Managed Testing Solutions market demonstrates significant regional variations in growth and adoption rates. North America and Europe currently hold the largest market share, driven by high technology adoption rates and well-established software industries. However, the Asia-Pacific region is poised for substantial growth, fueled by rapid digitalization and a rapidly expanding IT sector. This dynamic landscape reflects differing levels of technological maturity and digital transformation across global markets.
- Size of Organization: Large enterprises currently dominate the market, accounting for XX% of the revenue in 2025, due to their larger budgets and complex IT infrastructures requiring extensive testing. However, the SME segment is exhibiting promising growth, reflecting increasing awareness of the critical role of software quality and the benefits of outsourcing testing needs.
- End-user Verticals: The BFSI (Banking, Financial Services, and Insurance) sector remains a key driver of demand for managed testing solutions, followed by the Healthcare and Telecom & IT sectors. This strong demand stems from stringent regulatory requirements and the mission-critical nature of their applications, where software failures can have severe consequences.
- Type of Delivery Model: Offshore delivery models are gaining significant traction, driven by cost advantages and access to a vast talent pool, representing XX% of the market share in 2025. Nevertheless, onshore delivery models retain a substantial share due to factors such as enhanced data security, client preference for proximity, and the need for close collaboration.
Key Drivers (by Segment):
- Large Enterprises: The need for comprehensive risk mitigation strategies, substantial IT budgets, and the complexity of their software ecosystems are key drivers of demand.
- BFSI: Stringent regulatory compliance, the critical nature of financial transactions, and the potential for significant financial losses in case of failures are driving the sector's demand for robust managed testing solutions.
- Offshore Delivery: Cost optimization, access to a wider talent pool with specialized skills, and 24/7 availability are the primary drivers for the increasing adoption of offshore testing services.
Managed Testing Solutions Industry Product Innovations
Recent innovations in the Managed Testing Solutions industry include the increased adoption of AI-powered test automation, cloud-based testing platforms, and specialized testing solutions for emerging technologies like blockchain and IoT. These innovations enhance testing efficiency, reduce costs, and improve the overall quality of software applications. The market is witnessing a shift toward comprehensive, integrated testing solutions that cover the entire software development lifecycle (SDLC). This holistic approach addresses the evolving needs of organizations and supports their digital transformation initiatives.
Report Scope & Segmentation Analysis
This report offers a comprehensive segmentation of the Managed Testing Solutions market based on the size of the organization (Small & Medium Enterprises, Large Enterprises), end-user vertical (Healthcare, BFSI, Telecom & IT, Retail, Government, Other), and type of delivery model (Onshore, Offshore). Each segment is meticulously analyzed based on its current market size, future growth projections, and competitive dynamics. Growth projections exhibit considerable variation across segments, with the BFSI and Large Enterprise segments anticipated to witness the most substantial growth during the forecast period.
Key Drivers of Managed Testing Solutions Industry Growth
Several factors fuel the growth of the Managed Testing Solutions market. The increasing complexity of software applications, the growing adoption of Agile and DevOps methodologies, and the rising demand for higher software quality are key drivers. Furthermore, stringent regulatory compliance requirements and the need for faster time-to-market are pushing organizations towards outsourcing their testing needs. Technological advancements, such as AI-powered test automation and cloud-based testing platforms, also contribute to market growth by improving efficiency and reducing costs.
Challenges in the Managed Testing Solutions Industry Sector
The Managed Testing Solutions market faces several challenges. Maintaining data security and ensuring compliance with stringent regulatory requirements are significant concerns. Supply chain disruptions and the shortage of skilled testing professionals represent additional hurdles. Intense competition among service providers necessitates constant innovation and service differentiation to maintain a competitive edge. The need to adapt to rapidly evolving technologies and maintain a high level of expertise in diverse testing methodologies also presents a considerable challenge. These challenges can impact profitability and market share if not properly addressed.
Emerging Opportunities in Managed Testing Solutions Industry
The Managed Testing Solutions market presents significant opportunities for growth and innovation. The proliferation of cloud computing and the rise of disruptive technologies such as AI, IoT, and blockchain are creating new testing requirements and specialized market niches. The demand for specialized testing expertise in these areas represents a significant opportunity for companies capable of providing the necessary skills and technologies. Moreover, expanding into underserved markets and developing tailored solutions for specific industry verticals offer promising avenues for growth and market differentiation.
Leading Players in the Managed Testing Solutions Industry Market
Key Developments in Managed Testing Solutions Industry
- July 2023: TestingXperts expands into Canada, strengthening its North American presence.
- June 2023: TestingXperts partners with an AI-based candidate screening services provider, adopting an offshore delivery model.
Future Outlook for Managed Testing Solutions Industry Market
The Managed Testing Solutions market is poised for continued growth, driven by ongoing digital transformation, increasing software complexity, and the adoption of new technologies. Strategic partnerships, acquisitions, and continuous investment in research and development will be crucial for maintaining a competitive edge. The market's future potential is significant, with opportunities for expansion into emerging markets and the development of specialized testing services for emerging technologies. The focus on AI-powered automation and cloud-based solutions will further drive market growth and efficiency gains.
Managed Testing Solutions Industry Segmentation
-
1. Type of Delivery Model
- 1.1. Onshore
- 1.2. Offshore
-
2. Size of Organization
- 2.1. Small & Medium Enterprises
- 2.2. Large Enterprises
-
3. End-user Vertical
- 3.1. Healthcare
- 3.2. BFSI
- 3.3. Telecom and IT
- 3.4. Retail
- 3.5. Government
- 3.6. Other End-user Verticals
Managed Testing Solutions Industry Segmentation By Geography
- 1. North America
- 2. Europe
- 3. Asia Pacific
- 4. South America
- 5. Middle East
Managed Testing Solutions Industry Regional Market Share
Geographic Coverage of Managed Testing Solutions Industry
Managed Testing Solutions Industry REPORT HIGHLIGHTS
| Aspects | Details |
|---|---|
| Study Period | 2020-2034 |
| Base Year | 2025 |
| Estimated Year | 2026 |
| Forecast Period | 2026-2034 |
| Historical Period | 2020-2025 |
| Growth Rate | CAGR of 8.70% from 2020-2034 |
| Segmentation |
|
Table of Contents
- 1. Introduction
- 1.1. Research Scope
- 1.2. Market Segmentation
- 1.3. Research Objective
- 1.4. Definitions and Assumptions
- 2. Executive Summary
- 2.1. Market Snapshot
- 3. Market Dynamics
- 3.1. Market Drivers
- 3.2. Market Restrains
- 3.3. Market Trends
- 3.4. Market Opportunities
- 4. Market Factor Analysis
- 4.1. Porters Five Forces
- 4.1.1. Bargaining Power of Suppliers
- 4.1.2. Bargaining Power of Buyers
- 4.1.3. Threat of New Entrants
- 4.1.4. Threat of Substitutes
- 4.1.5. Competitive Rivalry
- 4.2. PESTEL analysis
- 4.3. BCG Analysis
- 4.3.1. Stars (High Growth, High Market Share)
- 4.3.2. Cash Cows (Low Growth, High Market Share)
- 4.3.3. Question Mark (High Growth, Low Market Share)
- 4.3.4. Dogs (Low Growth, Low Market Share)
- 4.4. Ansoff Matrix Analysis
- 4.5. Supply Chain Analysis
- 4.6. Regulatory Landscape
- 4.7. Current Market Potential and Opportunity Assessment (TAM–SAM–SOM Framework)
- 4.8. PRI Analyst Note
- 4.1. Porters Five Forces
- 5. Market Analysis, Insights and Forecast 2021-2033
- 5.1. Market Analysis, Insights and Forecast - by Type of Delivery Model
- 5.1.1. Onshore
- 5.1.2. Offshore
- 5.2. Market Analysis, Insights and Forecast - by Size of Organization
- 5.2.1. Small & Medium Enterprises
- 5.2.2. Large Enterprises
- 5.3. Market Analysis, Insights and Forecast - by End-user Vertical
- 5.3.1. Healthcare
- 5.3.2. BFSI
- 5.3.3. Telecom and IT
- 5.3.4. Retail
- 5.3.5. Government
- 5.3.6. Other End-user Verticals
- 5.4. Market Analysis, Insights and Forecast - by Region
- 5.4.1. North America
- 5.4.2. Europe
- 5.4.3. Asia Pacific
- 5.4.4. South America
- 5.4.5. Middle East
- 5.1. Market Analysis, Insights and Forecast - by Type of Delivery Model
- 6. Global Managed Testing Solutions Industry Analysis, Insights and Forecast, 2021-2033
- 6.1. Market Analysis, Insights and Forecast - by Type of Delivery Model
- 6.1.1. Onshore
- 6.1.2. Offshore
- 6.2. Market Analysis, Insights and Forecast - by Size of Organization
- 6.2.1. Small & Medium Enterprises
- 6.2.2. Large Enterprises
- 6.3. Market Analysis, Insights and Forecast - by End-user Vertical
- 6.3.1. Healthcare
- 6.3.2. BFSI
- 6.3.3. Telecom and IT
- 6.3.4. Retail
- 6.3.5. Government
- 6.3.6. Other End-user Verticals
- 6.1. Market Analysis, Insights and Forecast - by Type of Delivery Model
- 7. North America Managed Testing Solutions Industry Analysis, Insights and Forecast, 2020-2032
- 7.1. Market Analysis, Insights and Forecast - by Type of Delivery Model
- 7.1.1. Onshore
- 7.1.2. Offshore
- 7.2. Market Analysis, Insights and Forecast - by Size of Organization
- 7.2.1. Small & Medium Enterprises
- 7.2.2. Large Enterprises
- 7.3. Market Analysis, Insights and Forecast - by End-user Vertical
- 7.3.1. Healthcare
- 7.3.2. BFSI
- 7.3.3. Telecom and IT
- 7.3.4. Retail
- 7.3.5. Government
- 7.3.6. Other End-user Verticals
- 7.1. Market Analysis, Insights and Forecast - by Type of Delivery Model
- 8. Europe Managed Testing Solutions Industry Analysis, Insights and Forecast, 2020-2032
- 8.1. Market Analysis, Insights and Forecast - by Type of Delivery Model
- 8.1.1. Onshore
- 8.1.2. Offshore
- 8.2. Market Analysis, Insights and Forecast - by Size of Organization
- 8.2.1. Small & Medium Enterprises
- 8.2.2. Large Enterprises
- 8.3. Market Analysis, Insights and Forecast - by End-user Vertical
- 8.3.1. Healthcare
- 8.3.2. BFSI
- 8.3.3. Telecom and IT
- 8.3.4. Retail
- 8.3.5. Government
- 8.3.6. Other End-user Verticals
- 8.1. Market Analysis, Insights and Forecast - by Type of Delivery Model
- 9. Asia Pacific Managed Testing Solutions Industry Analysis, Insights and Forecast, 2020-2032
- 9.1. Market Analysis, Insights and Forecast - by Type of Delivery Model
- 9.1.1. Onshore
- 9.1.2. Offshore
- 9.2. Market Analysis, Insights and Forecast - by Size of Organization
- 9.2.1. Small & Medium Enterprises
- 9.2.2. Large Enterprises
- 9.3. Market Analysis, Insights and Forecast - by End-user Vertical
- 9.3.1. Healthcare
- 9.3.2. BFSI
- 9.3.3. Telecom and IT
- 9.3.4. Retail
- 9.3.5. Government
- 9.3.6. Other End-user Verticals
- 9.1. Market Analysis, Insights and Forecast - by Type of Delivery Model
- 10. South America Managed Testing Solutions Industry Analysis, Insights and Forecast, 2020-2032
- 10.1. Market Analysis, Insights and Forecast - by Type of Delivery Model
- 10.1.1. Onshore
- 10.1.2. Offshore
- 10.2. Market Analysis, Insights and Forecast - by Size of Organization
- 10.2.1. Small & Medium Enterprises
- 10.2.2. Large Enterprises
- 10.3. Market Analysis, Insights and Forecast - by End-user Vertical
- 10.3.1. Healthcare
- 10.3.2. BFSI
- 10.3.3. Telecom and IT
- 10.3.4. Retail
- 10.3.5. Government
- 10.3.6. Other End-user Verticals
- 10.1. Market Analysis, Insights and Forecast - by Type of Delivery Model
- 11. Middle East Managed Testing Solutions Industry Analysis, Insights and Forecast, 2020-2032
- 11.1. Market Analysis, Insights and Forecast - by Type of Delivery Model
- 11.1.1. Onshore
- 11.1.2. Offshore
- 11.2. Market Analysis, Insights and Forecast - by Size of Organization
- 11.2.1. Small & Medium Enterprises
- 11.2.2. Large Enterprises
- 11.3. Market Analysis, Insights and Forecast - by End-user Vertical
- 11.3.1. Healthcare
- 11.3.2. BFSI
- 11.3.3. Telecom and IT
- 11.3.4. Retail
- 11.3.5. Government
- 11.3.6. Other End-user Verticals
- 11.1. Market Analysis, Insights and Forecast - by Type of Delivery Model
- 12. Competitive Analysis
- 12.1. Company Profiles
- 12.1.1 QualiTest
- 12.1.1.1. Company Overview
- 12.1.1.2. Products
- 12.1.1.3. Company Financials
- 12.1.1.4. SWOT Analysis
- 12.1.2 Testhouse Ltd
- 12.1.2.1. Company Overview
- 12.1.2.2. Products
- 12.1.2.3. Company Financials
- 12.1.2.4. SWOT Analysis
- 12.1.3 Infosys Limited
- 12.1.3.1. Company Overview
- 12.1.3.2. Products
- 12.1.3.3. Company Financials
- 12.1.3.4. SWOT Analysis
- 12.1.4 Accenture Plc
- 12.1.4.1. Company Overview
- 12.1.4.2. Products
- 12.1.4.3. Company Financials
- 12.1.4.4. SWOT Analysis
- 12.1.5 Wipro Limited
- 12.1.5.1. Company Overview
- 12.1.5.2. Products
- 12.1.5.3. Company Financials
- 12.1.5.4. SWOT Analysis
- 12.1.6 Cognizant
- 12.1.6.1. Company Overview
- 12.1.6.2. Products
- 12.1.6.3. Company Financials
- 12.1.6.4. SWOT Analysis
- 12.1.7 TATA Consultancy Services Limited
- 12.1.7.1. Company Overview
- 12.1.7.2. Products
- 12.1.7.3. Company Financials
- 12.1.7.4. SWOT Analysis
- 12.1.8 Hexaware Technologies
- 12.1.8.1. Company Overview
- 12.1.8.2. Products
- 12.1.8.3. Company Financials
- 12.1.8.4. SWOT Analysis
- 12.1.9 Capgemini SE
- 12.1.9.1. Company Overview
- 12.1.9.2. Products
- 12.1.9.3. Company Financials
- 12.1.9.4. SWOT Analysis
- 12.1.10 International Business Machines Corporation (IBM)
- 12.1.10.1. Company Overview
- 12.1.10.2. Products
- 12.1.10.3. Company Financials
- 12.1.10.4. SWOT Analysis
- 12.1.1 QualiTest
- 12.2. Market Entropy
- 12.2.1 Company's Key Areas Served
- 12.2.2 Recent Developments
- 12.3. Company Market Share Analysis 2025
- 12.3.1 Top 5 Companies Market Share Analysis
- 12.3.2 Top 3 Companies Market Share Analysis
- 12.4. List of Potential Customers
- 13. Research Methodology
List of Figures
- Figure 1: Global Managed Testing Solutions Industry Revenue Breakdown (Million, %) by Region 2025 & 2033
- Figure 2: North America Managed Testing Solutions Industry Revenue (Million), by Type of Delivery Model 2025 & 2033
- Figure 3: North America Managed Testing Solutions Industry Revenue Share (%), by Type of Delivery Model 2025 & 2033
- Figure 4: North America Managed Testing Solutions Industry Revenue (Million), by Size of Organization 2025 & 2033
- Figure 5: North America Managed Testing Solutions Industry Revenue Share (%), by Size of Organization 2025 & 2033
- Figure 6: North America Managed Testing Solutions Industry Revenue (Million), by End-user Vertical 2025 & 2033
- Figure 7: North America Managed Testing Solutions Industry Revenue Share (%), by End-user Vertical 2025 & 2033
- Figure 8: North America Managed Testing Solutions Industry Revenue (Million), by Country 2025 & 2033
- Figure 9: North America Managed Testing Solutions Industry Revenue Share (%), by Country 2025 & 2033
- Figure 10: Europe Managed Testing Solutions Industry Revenue (Million), by Type of Delivery Model 2025 & 2033
- Figure 11: Europe Managed Testing Solutions Industry Revenue Share (%), by Type of Delivery Model 2025 & 2033
- Figure 12: Europe Managed Testing Solutions Industry Revenue (Million), by Size of Organization 2025 & 2033
- Figure 13: Europe Managed Testing Solutions Industry Revenue Share (%), by Size of Organization 2025 & 2033
- Figure 14: Europe Managed Testing Solutions Industry Revenue (Million), by End-user Vertical 2025 & 2033
- Figure 15: Europe Managed Testing Solutions Industry Revenue Share (%), by End-user Vertical 2025 & 2033
- Figure 16: Europe Managed Testing Solutions Industry Revenue (Million), by Country 2025 & 2033
- Figure 17: Europe Managed Testing Solutions Industry Revenue Share (%), by Country 2025 & 2033
- Figure 18: Asia Pacific Managed Testing Solutions Industry Revenue (Million), by Type of Delivery Model 2025 & 2033
- Figure 19: Asia Pacific Managed Testing Solutions Industry Revenue Share (%), by Type of Delivery Model 2025 & 2033
- Figure 20: Asia Pacific Managed Testing Solutions Industry Revenue (Million), by Size of Organization 2025 & 2033
- Figure 21: Asia Pacific Managed Testing Solutions Industry Revenue Share (%), by Size of Organization 2025 & 2033
- Figure 22: Asia Pacific Managed Testing Solutions Industry Revenue (Million), by End-user Vertical 2025 & 2033
- Figure 23: Asia Pacific Managed Testing Solutions Industry Revenue Share (%), by End-user Vertical 2025 & 2033
- Figure 24: Asia Pacific Managed Testing Solutions Industry Revenue (Million), by Country 2025 & 2033
- Figure 25: Asia Pacific Managed Testing Solutions Industry Revenue Share (%), by Country 2025 & 2033
- Figure 26: South America Managed Testing Solutions Industry Revenue (Million), by Type of Delivery Model 2025 & 2033
- Figure 27: South America Managed Testing Solutions Industry Revenue Share (%), by Type of Delivery Model 2025 & 2033
- Figure 28: South America Managed Testing Solutions Industry Revenue (Million), by Size of Organization 2025 & 2033
- Figure 29: South America Managed Testing Solutions Industry Revenue Share (%), by Size of Organization 2025 & 2033
- Figure 30: South America Managed Testing Solutions Industry Revenue (Million), by End-user Vertical 2025 & 2033
- Figure 31: South America Managed Testing Solutions Industry Revenue Share (%), by End-user Vertical 2025 & 2033
- Figure 32: South America Managed Testing Solutions Industry Revenue (Million), by Country 2025 & 2033
- Figure 33: South America Managed Testing Solutions Industry Revenue Share (%), by Country 2025 & 2033
- Figure 34: Middle East Managed Testing Solutions Industry Revenue (Million), by Type of Delivery Model 2025 & 2033
- Figure 35: Middle East Managed Testing Solutions Industry Revenue Share (%), by Type of Delivery Model 2025 & 2033
- Figure 36: Middle East Managed Testing Solutions Industry Revenue (Million), by Size of Organization 2025 & 2033
- Figure 37: Middle East Managed Testing Solutions Industry Revenue Share (%), by Size of Organization 2025 & 2033
- Figure 38: Middle East Managed Testing Solutions Industry Revenue (Million), by End-user Vertical 2025 & 2033
- Figure 39: Middle East Managed Testing Solutions Industry Revenue Share (%), by End-user Vertical 2025 & 2033
- Figure 40: Middle East Managed Testing Solutions Industry Revenue (Million), by Country 2025 & 2033
- Figure 41: Middle East Managed Testing Solutions Industry Revenue Share (%), by Country 2025 & 2033
List of Tables
- Table 1: Global Managed Testing Solutions Industry Revenue Million Forecast, by Type of Delivery Model 2020 & 2033
- Table 2: Global Managed Testing Solutions Industry Revenue Million Forecast, by Size of Organization 2020 & 2033
- Table 3: Global Managed Testing Solutions Industry Revenue Million Forecast, by End-user Vertical 2020 & 2033
- Table 4: Global Managed Testing Solutions Industry Revenue Million Forecast, by Region 2020 & 2033
- Table 5: Global Managed Testing Solutions Industry Revenue Million Forecast, by Type of Delivery Model 2020 & 2033
- Table 6: Global Managed Testing Solutions Industry Revenue Million Forecast, by Size of Organization 2020 & 2033
- Table 7: Global Managed Testing Solutions Industry Revenue Million Forecast, by End-user Vertical 2020 & 2033
- Table 8: Global Managed Testing Solutions Industry Revenue Million Forecast, by Country 2020 & 2033
- Table 9: Global Managed Testing Solutions Industry Revenue Million Forecast, by Type of Delivery Model 2020 & 2033
- Table 10: Global Managed Testing Solutions Industry Revenue Million Forecast, by Size of Organization 2020 & 2033
- Table 11: Global Managed Testing Solutions Industry Revenue Million Forecast, by End-user Vertical 2020 & 2033
- Table 12: Global Managed Testing Solutions Industry Revenue Million Forecast, by Country 2020 & 2033
- Table 13: Global Managed Testing Solutions Industry Revenue Million Forecast, by Type of Delivery Model 2020 & 2033
- Table 14: Global Managed Testing Solutions Industry Revenue Million Forecast, by Size of Organization 2020 & 2033
- Table 15: Global Managed Testing Solutions Industry Revenue Million Forecast, by End-user Vertical 2020 & 2033
- Table 16: Global Managed Testing Solutions Industry Revenue Million Forecast, by Country 2020 & 2033
- Table 17: Global Managed Testing Solutions Industry Revenue Million Forecast, by Type of Delivery Model 2020 & 2033
- Table 18: Global Managed Testing Solutions Industry Revenue Million Forecast, by Size of Organization 2020 & 2033
- Table 19: Global Managed Testing Solutions Industry Revenue Million Forecast, by End-user Vertical 2020 & 2033
- Table 20: Global Managed Testing Solutions Industry Revenue Million Forecast, by Country 2020 & 2033
- Table 21: Global Managed Testing Solutions Industry Revenue Million Forecast, by Type of Delivery Model 2020 & 2033
- Table 22: Global Managed Testing Solutions Industry Revenue Million Forecast, by Size of Organization 2020 & 2033
- Table 23: Global Managed Testing Solutions Industry Revenue Million Forecast, by End-user Vertical 2020 & 2033
- Table 24: Global Managed Testing Solutions Industry Revenue Million Forecast, by Country 2020 & 2033
Frequently Asked Questions
1. What is the projected Compound Annual Growth Rate (CAGR) of the Managed Testing Solutions Industry?
The projected CAGR is approximately 8.70%.
2. Which companies are prominent players in the Managed Testing Solutions Industry?
Key companies in the market include QualiTest, Testhouse Ltd, Infosys Limited, Accenture Plc, Wipro Limited, Cognizant, TATA Consultancy Services Limited, Hexaware Technologies, Capgemini SE, International Business Machines Corporation (IBM).
3. What are the main segments of the Managed Testing Solutions Industry?
The market segments include Type of Delivery Model, Size of Organization, End-user Vertical.
4. Can you provide details about the market size?
The market size is estimated to be USD 302.53 Million as of 2022.
5. What are some drivers contributing to market growth?
Adopting artificial intelligence (AI) and cloud management is eventually helping organizations meet various functional business requirements while driving business process optimization.; The growing preference for outsourcing management functions to cloud service providers and managed service providers is expected to drive market growth..
6. What are the notable trends driving market growth?
Healthcare to Witness the Highest Growth.
7. Are there any restraints impacting market growth?
The market's need for more skilled labor is a significant challenge. Understanding customer requirements and selecting the best testing method required specialized knowledge..
8. Can you provide examples of recent developments in the market?
July 2023 - TestingXperts, a software testing and quality assurance company, is pleased to announce its further expansion into Canada, strengthening its presence in the North American market. The decision to expand into Canada aligns with the company's strategic vision to cater to the region's growing demand for Quality Engineering and software testing services.
9. What pricing options are available for accessing the report?
Pricing options include single-user, multi-user, and enterprise licenses priced at USD 4750, USD 5250, and USD 8750 respectively.
10. Is the market size provided in terms of value or volume?
The market size is provided in terms of value, measured in Million.
11. Are there any specific market keywords associated with the report?
Yes, the market keyword associated with the report is "Managed Testing Solutions Industry," which aids in identifying and referencing the specific market segment covered.
12. How do I determine which pricing option suits my needs best?
The pricing options vary based on user requirements and access needs. Individual users may opt for single-user licenses, while businesses requiring broader access may choose multi-user or enterprise licenses for cost-effective access to the report.
13. Are there any additional resources or data provided in the Managed Testing Solutions Industry report?
While the report offers comprehensive insights, it's advisable to review the specific contents or supplementary materials provided to ascertain if additional resources or data are available.
14. How can I stay updated on further developments or reports in the Managed Testing Solutions Industry?
To stay informed about further developments, trends, and reports in the Managed Testing Solutions Industry, consider subscribing to industry newsletters, following relevant companies and organizations, or regularly checking reputable industry news sources and publications.
Methodology
Step 1 - Identification of Relevant Samples Size from Population Database


Step 2 - Approaches for Defining Global Market Size (Value, Volume* & Price*)

Note*: In applicable scenarios
Step 3 - Data Sources
Primary Research
- Web Analytics
- Survey Reports
- Research Institute
- Latest Research Reports
- Opinion Leaders
Secondary Research
- Annual Reports
- White Paper
- Latest Press Release
- Industry Association
- Paid Database
- Investor Presentations

Step 4 - Data Triangulation
Involves using different sources of information in order to increase the validity of a study
These sources are likely to be stakeholders in a program - participants, other researchers, program staff, other community members, and so on.
Then we put all data in single framework & apply various statistical tools to find out the dynamic on the market.
During the analysis stage, feedback from the stakeholder groups would be compared to determine areas of agreement as well as areas of divergence