

Key Insights
The global Manual Operating Table market is poised for steady growth, with a projected market size of approximately $896.8 million in 2018, expanding at a Compound Annual Growth Rate (CAGR) of 4.1%. This consistent upward trajectory is driven by several key factors, including the increasing prevalence of surgical procedures worldwide and the ongoing need for reliable, cost-effective surgical equipment in healthcare facilities. Hospitals and clinics, the primary consumers of manual operating tables, continue to invest in these essential tools to support a wide range of surgical specialties. The demand is further bolstered by the universal appeal of these tables, which are designed for versatility, alongside the specific requirements met by specialized models catering to niche surgical applications. Emerging economies, with their expanding healthcare infrastructure and growing patient populations, represent significant growth opportunities, often favoring the robust and budget-friendly nature of manual operating tables.
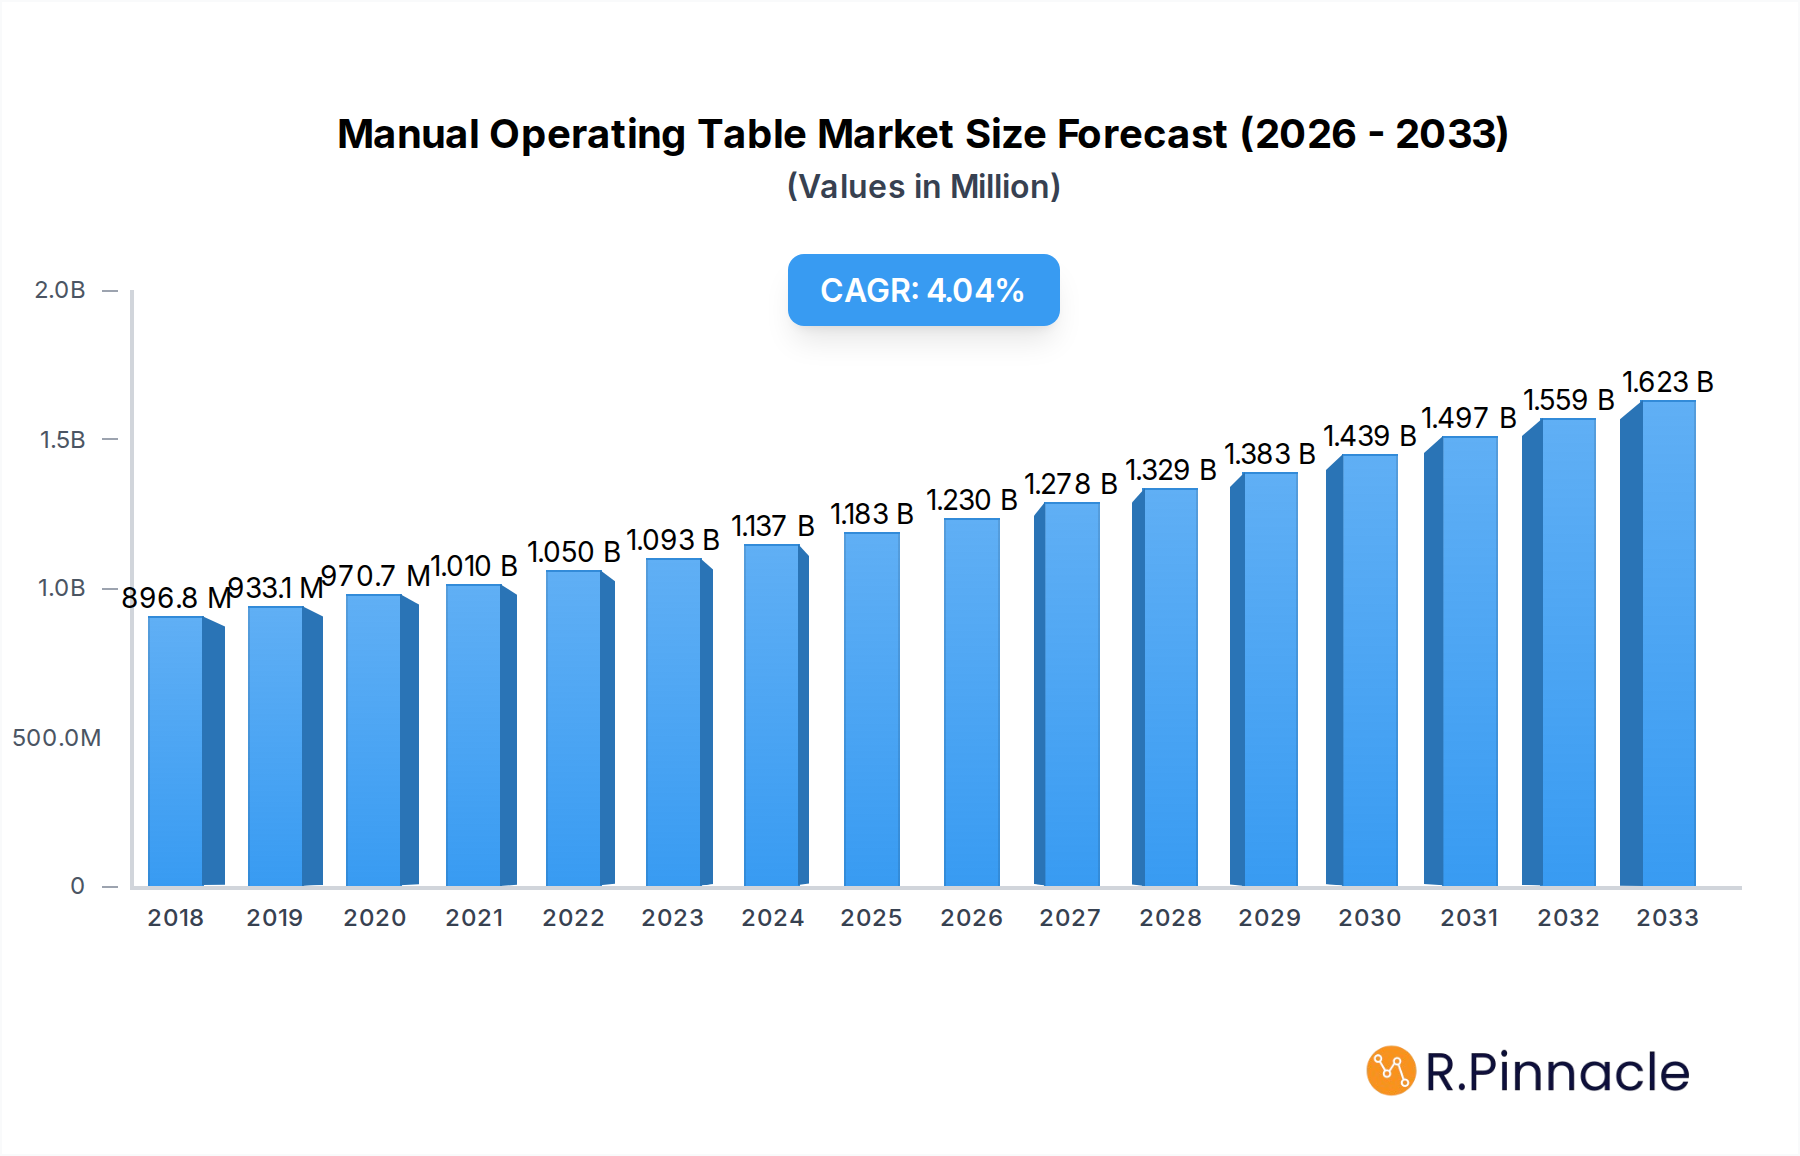
Manual Operating Table Market Size (In Million)
While the market demonstrates resilience, certain factors influence its trajectory. The increasing adoption of advanced, motorized operating tables in high-end surgical centers and the substantial upfront investment required for sophisticated medical equipment can present as restraining influences. However, the inherent durability, ease of maintenance, and lower operational costs associated with manual operating tables ensure their continued relevance, particularly in resource-constrained settings and for routine surgical interventions. Key players like Steris, UFSK-International OSYS, and Hillrom are instrumental in shaping the market through product innovation, strategic partnerships, and expanding distribution networks. The focus on improving patient safety and surgical efficiency through ergonomic designs and enhanced stability further fuels market development. The Asia Pacific region, fueled by rapid healthcare advancements and a large patient base, is expected to emerge as a significant contributor to market expansion.

Manual Operating Table Company Market Share
Report Title: Global Manual Operating Table Market: Comprehensive Analysis, Innovations, and Future Projections (2019-2033)
Report Description:
Dive deep into the global Manual Operating Table market with this indispensable industry report. Spanning a comprehensive study period from 2019 to 2033, with a base and estimated year of 2025, this analysis offers unparalleled insights into market structure, dynamics, and future trajectory. We meticulously dissect market concentration, innovation drivers, regulatory landscapes, and M&A activities, providing actionable intelligence for stakeholders. Explore dominant regions and segments, understanding the key factors propelling growth in Hospitals, Clinics, and Other applications, alongside Universal and Specialized table types. With a focus on product innovations, technological advancements, and emerging opportunities, this report equips you with the knowledge to navigate the evolving market. Featuring in-depth analysis of leading players like Steris, UFSK-International OSYS, Hillrom, Lojer, Schmitz, Brumaba, Nuova BN, Fazzini, AGA Sanitatsartikel, ALVO Medical, BiHealthcare, CI Healthcare, Medifa, and Mizuho OSI, along with a detailed timeline of key industry developments, this report is your definitive guide to the manual operating table sector.
Manual Operating Table Market Structure & Innovation Trends
The manual operating table market exhibits a moderate to high level of market concentration, with several key players holding significant shares. Innovation trends are primarily driven by the demand for enhanced patient safety, improved surgeon ergonomics, and greater versatility in surgical procedures. Regulatory frameworks, such as those from the FDA and EMA, play a crucial role in shaping product development and market entry, emphasizing quality, safety, and efficacy. Product substitutes, including advanced electric operating tables, present a competitive challenge, pushing manual table manufacturers to focus on cost-effectiveness, reliability, and specialized applications where manual control remains advantageous. End-user demographics are shifting towards an aging global population requiring more surgical interventions, and a growing demand for specialized surgical procedures in both established and emerging economies. Mergers and acquisition (M&A) activities are observed as companies seek to expand their product portfolios, gain market access, and consolidate their positions, with estimated M&A deal values in the hundreds of million range over the forecast period.
Manual Operating Table Market Dynamics & Trends
The global manual operating table market is poised for steady growth, driven by a confluence of compelling factors. The primary growth driver remains the increasing volume of surgical procedures worldwide, fueled by an aging global population, rising prevalence of chronic diseases, and advancements in medical technology that enable more complex and life-saving operations. This sustained demand for surgical interventions directly translates into a continuous need for reliable and cost-effective operating tables. While electric operating tables are gaining traction due to their advanced features and automation, manual operating tables maintain a significant market presence due to their inherent advantages in specific surgical scenarios, particularly where precise, tactile control is paramount, and in settings with limited access to electricity or where budget constraints are a primary concern.
Technological disruptions in the broader medical device industry, while more pronounced in the electric segment, also influence the manual operating table market. Manufacturers are increasingly integrating lightweight, durable materials and refining ergonomic designs to enhance user experience and patient comfort. Innovations focus on improving the ease of adjustment, stability, and compatibility with a wide array of surgical accessories, thereby expanding the functional scope of manual tables.
Consumer preferences are evolving, with a heightened emphasis on patient safety, infection control, and cost-efficiency. Hospitals and clinics are seeking operating tables that not only facilitate successful surgical outcomes but also contribute to a streamlined workflow and reduced operational costs. The cost-effectiveness of manual operating tables, coupled with their robust construction and lower maintenance requirements compared to their electric counterparts, continues to make them an attractive option, especially in developing regions and smaller healthcare facilities.
The competitive landscape is characterized by a mix of established global manufacturers and niche players. Competition is intensifying, not only among manual table providers but also from manufacturers of electric and hybrid operating table systems. This competitive pressure encourages continuous product improvement, focusing on enhanced features, superior build quality, and competitive pricing strategies. Market penetration of manual operating tables is expected to remain strong, particularly in applications where their specific advantages are most pronounced. The projected Compound Annual Growth Rate (CAGR) for the manual operating table market is estimated to be in the range of 3-5% over the forecast period, reflecting a mature yet consistent growth trajectory.
Dominant Regions & Segments in Manual Operating Table
The global manual operating table market is characterized by distinct regional dominance and segment preferences. North America and Europe currently represent the largest markets, driven by well-established healthcare infrastructures, high disposable incomes, and a strong demand for advanced surgical care. However, the Asia Pacific region is emerging as the fastest-growing market, propelled by increasing healthcare expenditure, a rising number of surgical procedures due to population growth and disease prevalence, and expanding access to modern medical facilities. Government initiatives aimed at improving healthcare access and quality are significant economic policies supporting this growth.
Within the Application segmentation, Hospitals represent the dominant segment. This is attributed to the high volume and complexity of surgical procedures performed in hospital settings, necessitating reliable and versatile operating tables. The need for a wide range of table functionalities to cater to diverse surgical specialties further solidifies the hospital segment's lead. Clinics form a significant secondary segment, particularly for less complex procedures and in outpatient surgical centers, where cost-effectiveness and ease of use are prioritized. The Other application segment, encompassing specialized surgical units, mobile surgical teams, and veterinary clinics, also contributes to market demand, albeit to a lesser extent.
In terms of Type, the Universal operating table segment holds a commanding market share. Universal tables are designed to accommodate a broad spectrum of surgical procedures, offering flexibility and adaptability for various specialties, which is a key advantage for healthcare facilities with diverse surgical needs. These tables often feature adjustable height, tilt, and backrest functions, along with a wide range of accessories. The Specialized operating table segment, while smaller, is experiencing robust growth. This is driven by the increasing demand for highly customized tables tailored for specific surgical disciplines, such as orthopedic, neurosurgery, or cardiovascular surgery. These specialized tables offer enhanced features and configurations to optimize surgical access and patient positioning for intricate procedures. Key drivers for dominance in this segment include advanced infrastructure, a high concentration of specialized medical professionals, and significant investment in medical technology. Economic policies supporting healthcare modernization and infrastructure development are crucial in shaping the growth and dominance of these regions and segments.
Manual Operating Table Product Innovations
Product innovations in the manual operating table market are centered on enhancing user ergonomics, patient safety, and overall surgical efficiency. Manufacturers are focusing on lightweight yet robust materials, improved locking mechanisms for enhanced stability, and intuitive manual adjustment controls that allow for precise positioning with minimal effort. Developments include integrated accessory rails for versatile equipment integration and specialized tabletop designs that cater to specific surgical needs, such as enhanced radiolucency for imaging. These innovations aim to provide competitive advantages by offering cost-effective, reliable solutions that meet the evolving demands of modern surgical practices, particularly in budget-conscious environments.
Report Scope & Segmentation Analysis
This report provides a comprehensive analysis of the global manual operating table market, segmented by application and type.
Application Segmentation:
- Hospital: This segment is projected to exhibit consistent growth, driven by the high volume of surgical procedures and the demand for versatile tables across various departments.
- Clinic: Clinics represent a growing segment, particularly for outpatient surgeries and specialized procedures, where cost-effectiveness and ease of use are key considerations.
- Other: This segment includes specialized surgical facilities, mobile units, and veterinary applications, offering niche growth opportunities.
Type Segmentation:
- Universal: The largest segment, characterized by its adaptability to a wide range of surgical procedures, offering flexibility for diverse healthcare settings.
- Specialized: This segment is experiencing rapid growth, driven by the demand for tables tailored for specific surgical disciplines, offering advanced functionalities for complex operations.
Key Drivers of Manual Operating Table Growth
The sustained growth of the manual operating table market is propelled by several key factors. Firstly, the increasing global demand for surgical procedures due to an aging population and rising prevalence of chronic diseases is a primary driver. Secondly, the cost-effectiveness of manual operating tables makes them an attractive option for healthcare facilities in developing economies and smaller institutions with limited budgets, ensuring widespread accessibility. Thirdly, specific surgical requirements where precise manual control is paramount, such as in certain orthopedic or delicate microsurgeries, continue to favor manual table designs. Lastly, advancements in material science and engineering are leading to lighter, more durable, and ergonomically improved manual tables, enhancing their appeal and functionality in various healthcare settings.
Challenges in the Manual Operating Table Sector
Despite its steady growth, the manual operating table sector faces several challenges. Intensifying competition from electric and hybrid operating tables, which offer advanced automation and features, poses a significant threat. Stringent regulatory approval processes for medical devices can lead to extended time-to-market and increased development costs. Supply chain disruptions, as witnessed in recent global events, can impact raw material availability and manufacturing timelines. Furthermore, perceived limitations in terms of advanced functionalities compared to electric counterparts might hinder adoption in highly specialized and technologically advanced surgical centers.
Emerging Opportunities in Manual Operating Table
Emerging opportunities in the manual operating table market lie in several key areas. The expanding healthcare infrastructure in emerging economies presents a significant untapped market for cost-effective and reliable surgical equipment. Development of lighter, more portable manual tables can cater to the growing demand for mobile surgical units and disaster relief efforts. Additionally, focusing on niche applications within specialized surgical fields that still benefit from manual precision and control offers avenues for targeted innovation. Partnerships with distributors and training programs in underserved regions can further enhance market penetration and brand loyalty.
Leading Players in the Manual Operating Table Market
- Steris
- UFSK-International OSYS
- Hillrom
- Lojer
- Schmitz
- Brumaba
- Nuova BN
- Fazzini
- AGA Sanitatsartikel
- ALVO Medical
- BiHealthcare
- CI Healthcare
- Medifa
- Mizuho OSI
Key Developments in Manual Operating Table Industry
- 2023/XX: Launch of new ergonomic designs for improved surgeon comfort and precise positioning, enhancing versatility.
- 2022/XX: Increased adoption of advanced, lightweight composite materials for enhanced durability and portability.
- 2021/XX: Strategic collaborations to expand distribution networks in emerging markets, focusing on accessibility and affordability.
- 2020/XX: Introduction of enhanced safety features, including improved locking mechanisms and anti-rollback systems.
- 2019/XX: Focus on modular designs allowing for easy customization and integration of various surgical accessories.
Future Outlook for Manual Operating Table Market
The future outlook for the manual operating table market remains positive, driven by a persistent global demand for surgical interventions and the inherent advantages of these tables in terms of cost-effectiveness and reliability. Growth accelerators include the expanding healthcare sector in emerging economies, continued advancements in materials and design leading to more user-friendly and versatile products, and the enduring need for precise manual control in specific surgical specialties. Strategic focus on product innovation, market penetration in underserved regions, and addressing the specific needs of diverse healthcare settings will be crucial for sustained success in the coming years.
Manual Operating Table Segmentation
-
1. Application
- 1.1. Hospital
- 1.2. Clinic
- 1.3. Other
-
2. Type
- 2.1. Universal
- 2.2. Specialized
Manual Operating Table Segmentation By Geography
-
1. North America
- 1.1. United States
- 1.2. Canada
- 1.3. Mexico
-
2. South America
- 2.1. Brazil
- 2.2. Argentina
- 2.3. Rest of South America
-
3. Europe
- 3.1. United Kingdom
- 3.2. Germany
- 3.3. France
- 3.4. Italy
- 3.5. Spain
- 3.6. Russia
- 3.7. Benelux
- 3.8. Nordics
- 3.9. Rest of Europe
-
4. Middle East & Africa
- 4.1. Turkey
- 4.2. Israel
- 4.3. GCC
- 4.4. North Africa
- 4.5. South Africa
- 4.6. Rest of Middle East & Africa
-
5. Asia Pacific
- 5.1. China
- 5.2. India
- 5.3. Japan
- 5.4. South Korea
- 5.5. ASEAN
- 5.6. Oceania
- 5.7. Rest of Asia Pacific
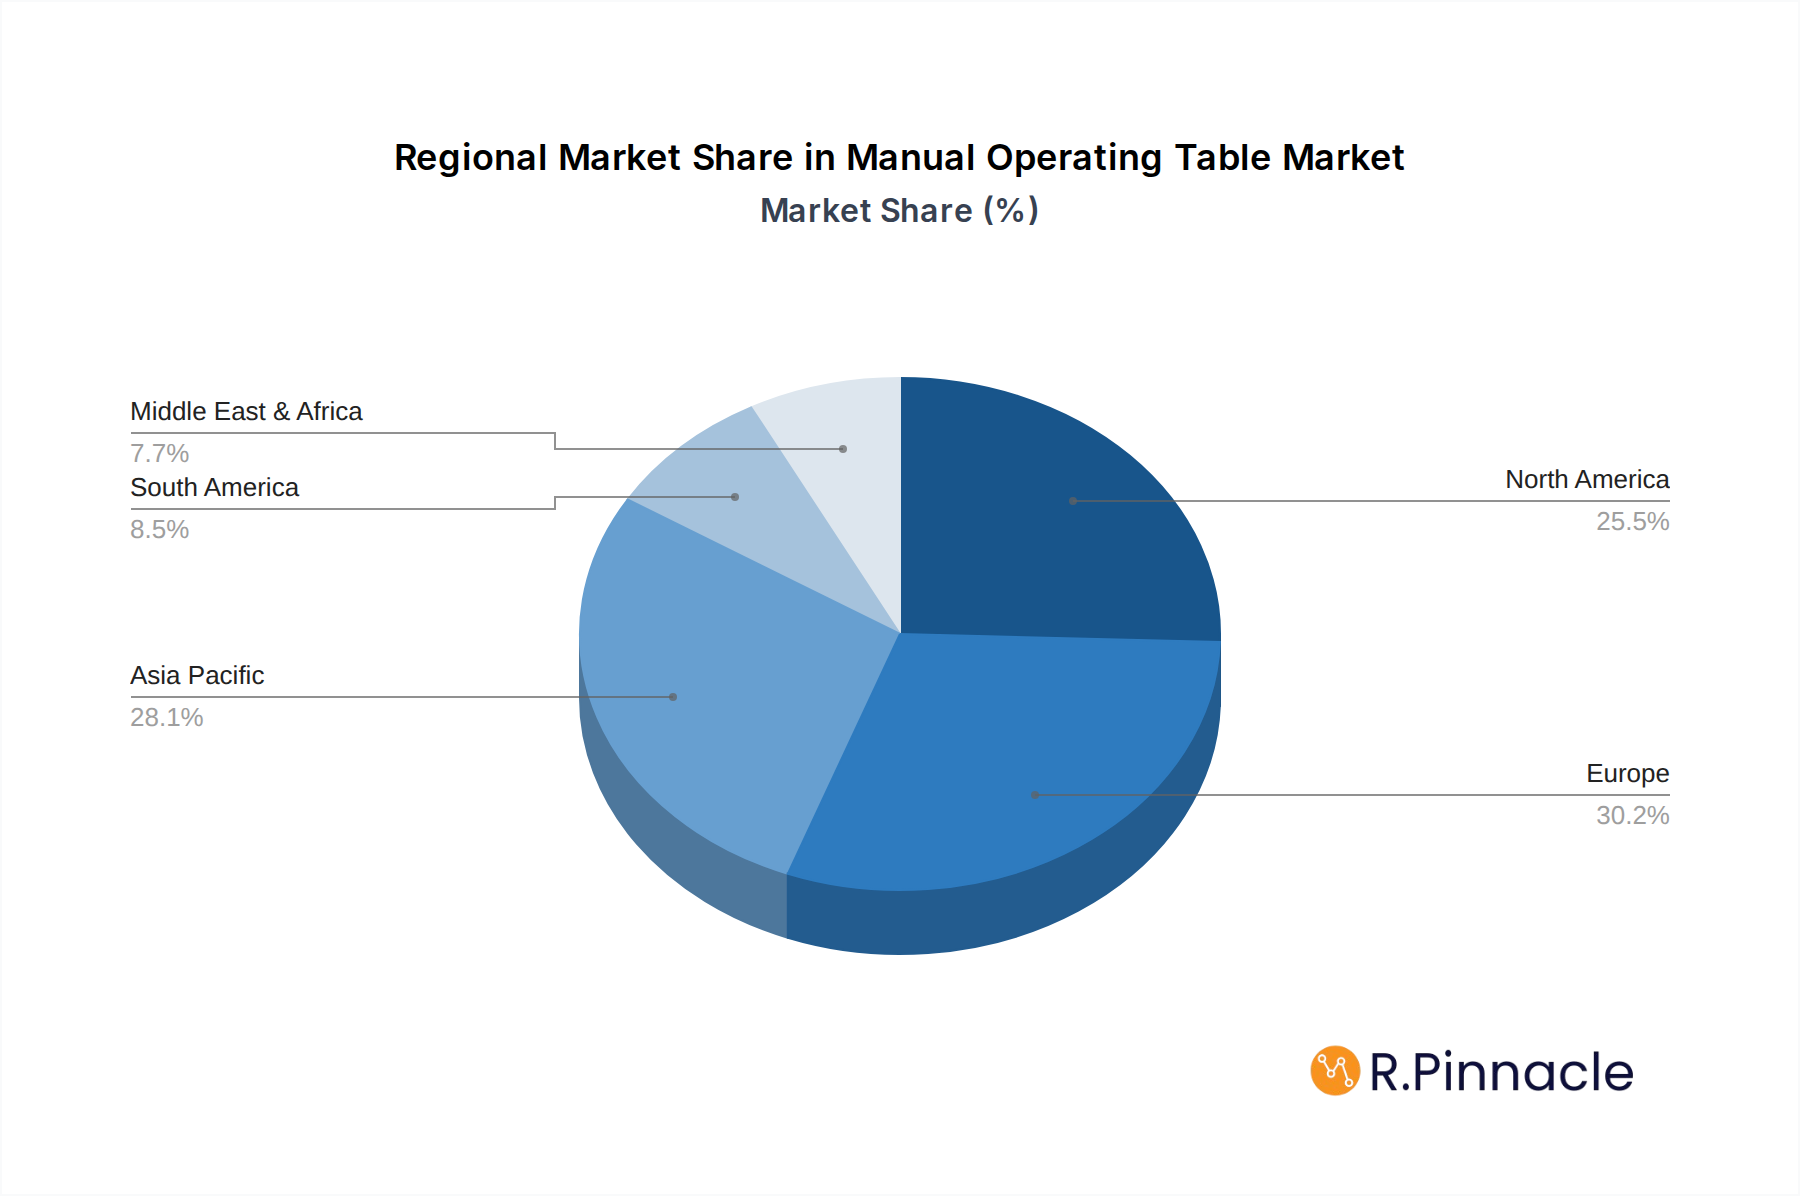
Manual Operating Table Regional Market Share
Geographic Coverage of Manual Operating Table
Manual Operating Table REPORT HIGHLIGHTS
| Aspects | Details |
|---|---|
| Study Period | 2020-2034 |
| Base Year | 2025 |
| Estimated Year | 2026 |
| Forecast Period | 2026-2034 |
| Historical Period | 2020-2025 |
| Growth Rate | CAGR of 4.1% from 2020-2034 |
| Segmentation |
|
Table of Contents
- 1. Introduction
- 1.1. Research Scope
- 1.2. Market Segmentation
- 1.3. Research Methodology
- 1.4. Definitions and Assumptions
- 2. Executive Summary
- 2.1. Introduction
- 3. Market Dynamics
- 3.1. Introduction
- 3.2. Market Drivers
- 3.3. Market Restrains
- 3.4. Market Trends
- 4. Market Factor Analysis
- 4.1. Porters Five Forces
- 4.2. Supply/Value Chain
- 4.3. PESTEL analysis
- 4.4. Market Entropy
- 4.5. Patent/Trademark Analysis
- 5. Global Manual Operating Table Analysis, Insights and Forecast, 2020-2032
- 5.1. Market Analysis, Insights and Forecast - by Application
- 5.1.1. Hospital
- 5.1.2. Clinic
- 5.1.3. Other
- 5.2. Market Analysis, Insights and Forecast - by Type
- 5.2.1. Universal
- 5.2.2. Specialized
- 5.3. Market Analysis, Insights and Forecast - by Region
- 5.3.1. North America
- 5.3.2. South America
- 5.3.3. Europe
- 5.3.4. Middle East & Africa
- 5.3.5. Asia Pacific
- 5.1. Market Analysis, Insights and Forecast - by Application
- 6. North America Manual Operating Table Analysis, Insights and Forecast, 2020-2032
- 6.1. Market Analysis, Insights and Forecast - by Application
- 6.1.1. Hospital
- 6.1.2. Clinic
- 6.1.3. Other
- 6.2. Market Analysis, Insights and Forecast - by Type
- 6.2.1. Universal
- 6.2.2. Specialized
- 6.1. Market Analysis, Insights and Forecast - by Application
- 7. South America Manual Operating Table Analysis, Insights and Forecast, 2020-2032
- 7.1. Market Analysis, Insights and Forecast - by Application
- 7.1.1. Hospital
- 7.1.2. Clinic
- 7.1.3. Other
- 7.2. Market Analysis, Insights and Forecast - by Type
- 7.2.1. Universal
- 7.2.2. Specialized
- 7.1. Market Analysis, Insights and Forecast - by Application
- 8. Europe Manual Operating Table Analysis, Insights and Forecast, 2020-2032
- 8.1. Market Analysis, Insights and Forecast - by Application
- 8.1.1. Hospital
- 8.1.2. Clinic
- 8.1.3. Other
- 8.2. Market Analysis, Insights and Forecast - by Type
- 8.2.1. Universal
- 8.2.2. Specialized
- 8.1. Market Analysis, Insights and Forecast - by Application
- 9. Middle East & Africa Manual Operating Table Analysis, Insights and Forecast, 2020-2032
- 9.1. Market Analysis, Insights and Forecast - by Application
- 9.1.1. Hospital
- 9.1.2. Clinic
- 9.1.3. Other
- 9.2. Market Analysis, Insights and Forecast - by Type
- 9.2.1. Universal
- 9.2.2. Specialized
- 9.1. Market Analysis, Insights and Forecast - by Application
- 10. Asia Pacific Manual Operating Table Analysis, Insights and Forecast, 2020-2032
- 10.1. Market Analysis, Insights and Forecast - by Application
- 10.1.1. Hospital
- 10.1.2. Clinic
- 10.1.3. Other
- 10.2. Market Analysis, Insights and Forecast - by Type
- 10.2.1. Universal
- 10.2.2. Specialized
- 10.1. Market Analysis, Insights and Forecast - by Application
- 11. Competitive Analysis
- 11.1. Global Market Share Analysis 2025
- 11.2. Company Profiles
- 11.2.1 Steris
- 11.2.1.1. Overview
- 11.2.1.2. Products
- 11.2.1.3. SWOT Analysis
- 11.2.1.4. Recent Developments
- 11.2.1.5. Financials (Based on Availability)
- 11.2.2 UFSK-International OSYS
- 11.2.2.1. Overview
- 11.2.2.2. Products
- 11.2.2.3. SWOT Analysis
- 11.2.2.4. Recent Developments
- 11.2.2.5. Financials (Based on Availability)
- 11.2.3 Hillrom
- 11.2.3.1. Overview
- 11.2.3.2. Products
- 11.2.3.3. SWOT Analysis
- 11.2.3.4. Recent Developments
- 11.2.3.5. Financials (Based on Availability)
- 11.2.4 Lojer
- 11.2.4.1. Overview
- 11.2.4.2. Products
- 11.2.4.3. SWOT Analysis
- 11.2.4.4. Recent Developments
- 11.2.4.5. Financials (Based on Availability)
- 11.2.5 Schmitz
- 11.2.5.1. Overview
- 11.2.5.2. Products
- 11.2.5.3. SWOT Analysis
- 11.2.5.4. Recent Developments
- 11.2.5.5. Financials (Based on Availability)
- 11.2.6 Brumaba
- 11.2.6.1. Overview
- 11.2.6.2. Products
- 11.2.6.3. SWOT Analysis
- 11.2.6.4. Recent Developments
- 11.2.6.5. Financials (Based on Availability)
- 11.2.7 Nuova BN
- 11.2.7.1. Overview
- 11.2.7.2. Products
- 11.2.7.3. SWOT Analysis
- 11.2.7.4. Recent Developments
- 11.2.7.5. Financials (Based on Availability)
- 11.2.8 Fazzini
- 11.2.8.1. Overview
- 11.2.8.2. Products
- 11.2.8.3. SWOT Analysis
- 11.2.8.4. Recent Developments
- 11.2.8.5. Financials (Based on Availability)
- 11.2.9 AGA Sanitatsartikel
- 11.2.9.1. Overview
- 11.2.9.2. Products
- 11.2.9.3. SWOT Analysis
- 11.2.9.4. Recent Developments
- 11.2.9.5. Financials (Based on Availability)
- 11.2.10 ALVO Medical
- 11.2.10.1. Overview
- 11.2.10.2. Products
- 11.2.10.3. SWOT Analysis
- 11.2.10.4. Recent Developments
- 11.2.10.5. Financials (Based on Availability)
- 11.2.11 BiHealthcare
- 11.2.11.1. Overview
- 11.2.11.2. Products
- 11.2.11.3. SWOT Analysis
- 11.2.11.4. Recent Developments
- 11.2.11.5. Financials (Based on Availability)
- 11.2.12 CI Healthcare
- 11.2.12.1. Overview
- 11.2.12.2. Products
- 11.2.12.3. SWOT Analysis
- 11.2.12.4. Recent Developments
- 11.2.12.5. Financials (Based on Availability)
- 11.2.13 Medifa
- 11.2.13.1. Overview
- 11.2.13.2. Products
- 11.2.13.3. SWOT Analysis
- 11.2.13.4. Recent Developments
- 11.2.13.5. Financials (Based on Availability)
- 11.2.14 Mizuho OSI
- 11.2.14.1. Overview
- 11.2.14.2. Products
- 11.2.14.3. SWOT Analysis
- 11.2.14.4. Recent Developments
- 11.2.14.5. Financials (Based on Availability)
- 11.2.1 Steris
List of Figures
- Figure 1: Global Manual Operating Table Revenue Breakdown (undefined, %) by Region 2025 & 2033
- Figure 2: North America Manual Operating Table Revenue (undefined), by Application 2025 & 2033
- Figure 3: North America Manual Operating Table Revenue Share (%), by Application 2025 & 2033
- Figure 4: North America Manual Operating Table Revenue (undefined), by Type 2025 & 2033
- Figure 5: North America Manual Operating Table Revenue Share (%), by Type 2025 & 2033
- Figure 6: North America Manual Operating Table Revenue (undefined), by Country 2025 & 2033
- Figure 7: North America Manual Operating Table Revenue Share (%), by Country 2025 & 2033
- Figure 8: South America Manual Operating Table Revenue (undefined), by Application 2025 & 2033
- Figure 9: South America Manual Operating Table Revenue Share (%), by Application 2025 & 2033
- Figure 10: South America Manual Operating Table Revenue (undefined), by Type 2025 & 2033
- Figure 11: South America Manual Operating Table Revenue Share (%), by Type 2025 & 2033
- Figure 12: South America Manual Operating Table Revenue (undefined), by Country 2025 & 2033
- Figure 13: South America Manual Operating Table Revenue Share (%), by Country 2025 & 2033
- Figure 14: Europe Manual Operating Table Revenue (undefined), by Application 2025 & 2033
- Figure 15: Europe Manual Operating Table Revenue Share (%), by Application 2025 & 2033
- Figure 16: Europe Manual Operating Table Revenue (undefined), by Type 2025 & 2033
- Figure 17: Europe Manual Operating Table Revenue Share (%), by Type 2025 & 2033
- Figure 18: Europe Manual Operating Table Revenue (undefined), by Country 2025 & 2033
- Figure 19: Europe Manual Operating Table Revenue Share (%), by Country 2025 & 2033
- Figure 20: Middle East & Africa Manual Operating Table Revenue (undefined), by Application 2025 & 2033
- Figure 21: Middle East & Africa Manual Operating Table Revenue Share (%), by Application 2025 & 2033
- Figure 22: Middle East & Africa Manual Operating Table Revenue (undefined), by Type 2025 & 2033
- Figure 23: Middle East & Africa Manual Operating Table Revenue Share (%), by Type 2025 & 2033
- Figure 24: Middle East & Africa Manual Operating Table Revenue (undefined), by Country 2025 & 2033
- Figure 25: Middle East & Africa Manual Operating Table Revenue Share (%), by Country 2025 & 2033
- Figure 26: Asia Pacific Manual Operating Table Revenue (undefined), by Application 2025 & 2033
- Figure 27: Asia Pacific Manual Operating Table Revenue Share (%), by Application 2025 & 2033
- Figure 28: Asia Pacific Manual Operating Table Revenue (undefined), by Type 2025 & 2033
- Figure 29: Asia Pacific Manual Operating Table Revenue Share (%), by Type 2025 & 2033
- Figure 30: Asia Pacific Manual Operating Table Revenue (undefined), by Country 2025 & 2033
- Figure 31: Asia Pacific Manual Operating Table Revenue Share (%), by Country 2025 & 2033
List of Tables
- Table 1: Global Manual Operating Table Revenue undefined Forecast, by Application 2020 & 2033
- Table 2: Global Manual Operating Table Revenue undefined Forecast, by Type 2020 & 2033
- Table 3: Global Manual Operating Table Revenue undefined Forecast, by Region 2020 & 2033
- Table 4: Global Manual Operating Table Revenue undefined Forecast, by Application 2020 & 2033
- Table 5: Global Manual Operating Table Revenue undefined Forecast, by Type 2020 & 2033
- Table 6: Global Manual Operating Table Revenue undefined Forecast, by Country 2020 & 2033
- Table 7: United States Manual Operating Table Revenue (undefined) Forecast, by Application 2020 & 2033
- Table 8: Canada Manual Operating Table Revenue (undefined) Forecast, by Application 2020 & 2033
- Table 9: Mexico Manual Operating Table Revenue (undefined) Forecast, by Application 2020 & 2033
- Table 10: Global Manual Operating Table Revenue undefined Forecast, by Application 2020 & 2033
- Table 11: Global Manual Operating Table Revenue undefined Forecast, by Type 2020 & 2033
- Table 12: Global Manual Operating Table Revenue undefined Forecast, by Country 2020 & 2033
- Table 13: Brazil Manual Operating Table Revenue (undefined) Forecast, by Application 2020 & 2033
- Table 14: Argentina Manual Operating Table Revenue (undefined) Forecast, by Application 2020 & 2033
- Table 15: Rest of South America Manual Operating Table Revenue (undefined) Forecast, by Application 2020 & 2033
- Table 16: Global Manual Operating Table Revenue undefined Forecast, by Application 2020 & 2033
- Table 17: Global Manual Operating Table Revenue undefined Forecast, by Type 2020 & 2033
- Table 18: Global Manual Operating Table Revenue undefined Forecast, by Country 2020 & 2033
- Table 19: United Kingdom Manual Operating Table Revenue (undefined) Forecast, by Application 2020 & 2033
- Table 20: Germany Manual Operating Table Revenue (undefined) Forecast, by Application 2020 & 2033
- Table 21: France Manual Operating Table Revenue (undefined) Forecast, by Application 2020 & 2033
- Table 22: Italy Manual Operating Table Revenue (undefined) Forecast, by Application 2020 & 2033
- Table 23: Spain Manual Operating Table Revenue (undefined) Forecast, by Application 2020 & 2033
- Table 24: Russia Manual Operating Table Revenue (undefined) Forecast, by Application 2020 & 2033
- Table 25: Benelux Manual Operating Table Revenue (undefined) Forecast, by Application 2020 & 2033
- Table 26: Nordics Manual Operating Table Revenue (undefined) Forecast, by Application 2020 & 2033
- Table 27: Rest of Europe Manual Operating Table Revenue (undefined) Forecast, by Application 2020 & 2033
- Table 28: Global Manual Operating Table Revenue undefined Forecast, by Application 2020 & 2033
- Table 29: Global Manual Operating Table Revenue undefined Forecast, by Type 2020 & 2033
- Table 30: Global Manual Operating Table Revenue undefined Forecast, by Country 2020 & 2033
- Table 31: Turkey Manual Operating Table Revenue (undefined) Forecast, by Application 2020 & 2033
- Table 32: Israel Manual Operating Table Revenue (undefined) Forecast, by Application 2020 & 2033
- Table 33: GCC Manual Operating Table Revenue (undefined) Forecast, by Application 2020 & 2033
- Table 34: North Africa Manual Operating Table Revenue (undefined) Forecast, by Application 2020 & 2033
- Table 35: South Africa Manual Operating Table Revenue (undefined) Forecast, by Application 2020 & 2033
- Table 36: Rest of Middle East & Africa Manual Operating Table Revenue (undefined) Forecast, by Application 2020 & 2033
- Table 37: Global Manual Operating Table Revenue undefined Forecast, by Application 2020 & 2033
- Table 38: Global Manual Operating Table Revenue undefined Forecast, by Type 2020 & 2033
- Table 39: Global Manual Operating Table Revenue undefined Forecast, by Country 2020 & 2033
- Table 40: China Manual Operating Table Revenue (undefined) Forecast, by Application 2020 & 2033
- Table 41: India Manual Operating Table Revenue (undefined) Forecast, by Application 2020 & 2033
- Table 42: Japan Manual Operating Table Revenue (undefined) Forecast, by Application 2020 & 2033
- Table 43: South Korea Manual Operating Table Revenue (undefined) Forecast, by Application 2020 & 2033
- Table 44: ASEAN Manual Operating Table Revenue (undefined) Forecast, by Application 2020 & 2033
- Table 45: Oceania Manual Operating Table Revenue (undefined) Forecast, by Application 2020 & 2033
- Table 46: Rest of Asia Pacific Manual Operating Table Revenue (undefined) Forecast, by Application 2020 & 2033
Frequently Asked Questions
1. What is the projected Compound Annual Growth Rate (CAGR) of the Manual Operating Table?
The projected CAGR is approximately 4.1%.
2. Which companies are prominent players in the Manual Operating Table?
Key companies in the market include Steris, UFSK-International OSYS, Hillrom, Lojer, Schmitz, Brumaba, Nuova BN, Fazzini, AGA Sanitatsartikel, ALVO Medical, BiHealthcare, CI Healthcare, Medifa, Mizuho OSI.
3. What are the main segments of the Manual Operating Table?
The market segments include Application, Type.
4. Can you provide details about the market size?
The market size is estimated to be USD XXX N/A as of 2022.
5. What are some drivers contributing to market growth?
N/A
6. What are the notable trends driving market growth?
N/A
7. Are there any restraints impacting market growth?
N/A
8. Can you provide examples of recent developments in the market?
N/A
9. What pricing options are available for accessing the report?
Pricing options include single-user, multi-user, and enterprise licenses priced at USD 2900.00, USD 4350.00, and USD 5800.00 respectively.
10. Is the market size provided in terms of value or volume?
The market size is provided in terms of value, measured in N/A.
11. Are there any specific market keywords associated with the report?
Yes, the market keyword associated with the report is "Manual Operating Table," which aids in identifying and referencing the specific market segment covered.
12. How do I determine which pricing option suits my needs best?
The pricing options vary based on user requirements and access needs. Individual users may opt for single-user licenses, while businesses requiring broader access may choose multi-user or enterprise licenses for cost-effective access to the report.
13. Are there any additional resources or data provided in the Manual Operating Table report?
While the report offers comprehensive insights, it's advisable to review the specific contents or supplementary materials provided to ascertain if additional resources or data are available.
14. How can I stay updated on further developments or reports in the Manual Operating Table?
To stay informed about further developments, trends, and reports in the Manual Operating Table, consider subscribing to industry newsletters, following relevant companies and organizations, or regularly checking reputable industry news sources and publications.
Methodology
Step 1 - Identification of Relevant Samples Size from Population Database


Step 2 - Approaches for Defining Global Market Size (Value, Volume* & Price*)

Note*: In applicable scenarios
Step 3 - Data Sources
Primary Research
- Web Analytics
- Survey Reports
- Research Institute
- Latest Research Reports
- Opinion Leaders
Secondary Research
- Annual Reports
- White Paper
- Latest Press Release
- Industry Association
- Paid Database
- Investor Presentations

Step 4 - Data Triangulation
Involves using different sources of information in order to increase the validity of a study
These sources are likely to be stakeholders in a program - participants, other researchers, program staff, other community members, and so on.
Then we put all data in single framework & apply various statistical tools to find out the dynamic on the market.
During the analysis stage, feedback from the stakeholder groups would be compared to determine areas of agreement as well as areas of divergence