Key Insights
The marine joystick market, offering advanced control systems for vessels, is poised for significant expansion. Key growth drivers include escalating demand for superior maneuverability and simplified operation across recreational and commercial boating sectors. Technological advancements, integrating sophisticated sensors and autopilot capabilities into joystick controls, are accelerating market adoption. The increasing prevalence of larger, complex vessels, such as luxury yachts and commercial fishing fleets, necessitates advanced control solutions, thereby stimulating market demand. Furthermore, the broader trend towards automation within the maritime industry is a considerable contributor to the rising integration of joystick technology.
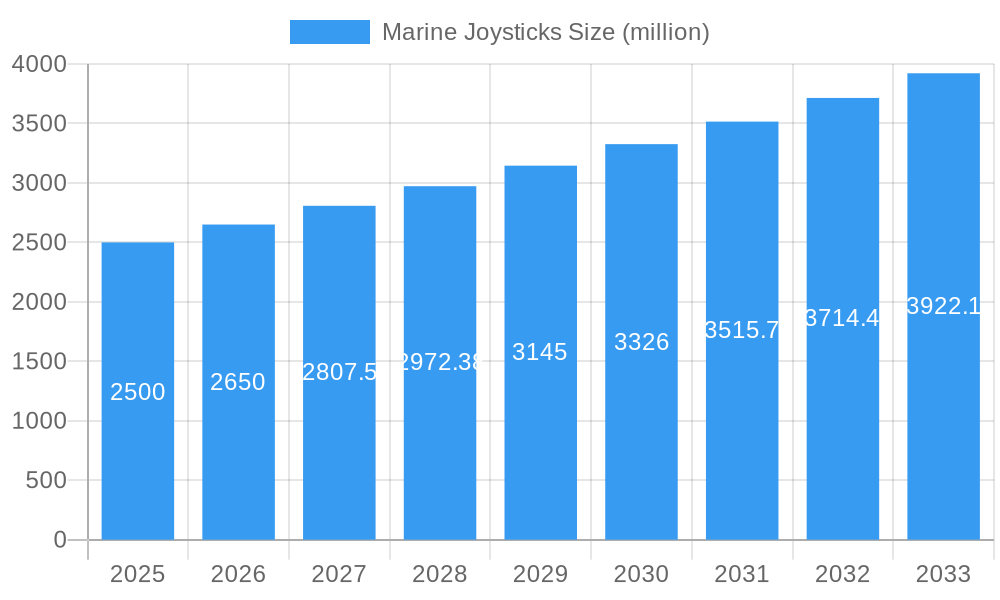
Marine Joysticks Market Size (In Billion)
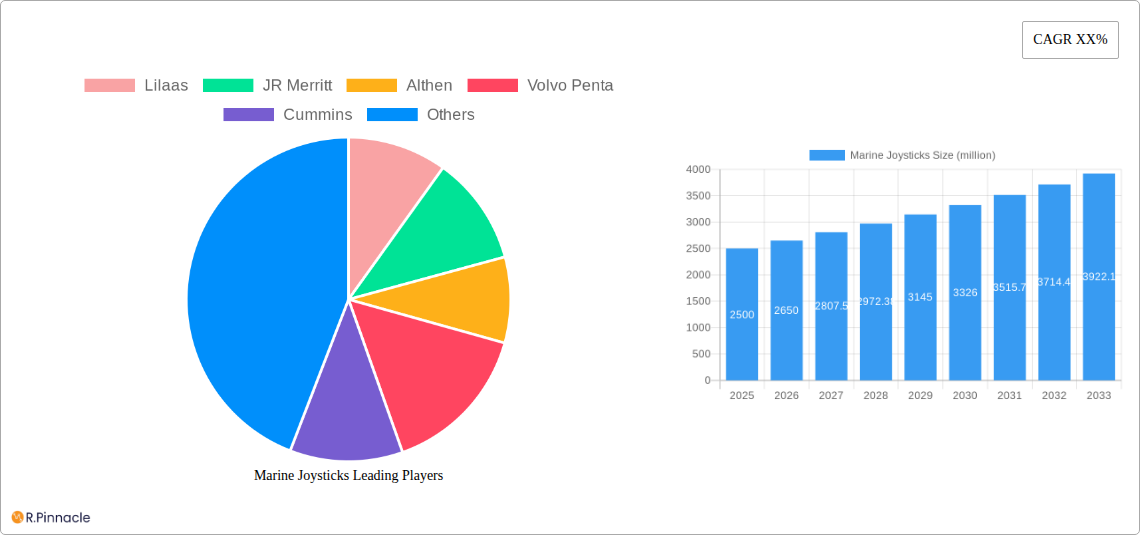
The market is segmented by control type (hydraulic, electronic), vessel size, and application (recreational, commercial). Leading industry players, including Volvo Penta, Mercury Marine, and ZF, are actively driving competition through innovation and strategic alliances to secure market dominance.
Marine Joysticks Company Market Share
Projected to achieve a compound annual growth rate (CAGR) of 14.6%, the market size is estimated to reach $8.01 billion by 2025. While the substantial initial investment and specialized installation requirements for joystick systems present potential challenges, the inherent convenience and enhanced safety benefits are anticipated to drive sustained market growth.
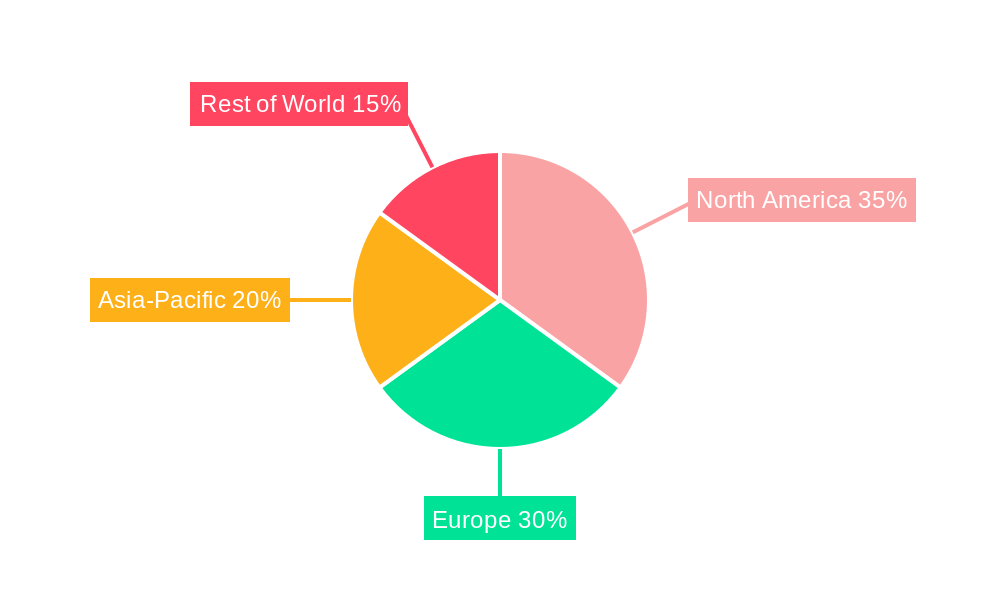
Geographically, North America and Europe demonstrate robust market penetration due to established recreational boating infrastructure. However, the Asia-Pacific region, particularly Southeast Asia, is emerging as a critical growth hub, fueled by rising disposable incomes and a burgeoning demand for recreational activities. The competitive environment features both established leaders and innovative new entrants, fostering continuous product development and market diversification.
Marine Joysticks Market Report: A Comprehensive Analysis (2019-2033)
This in-depth report provides a comprehensive analysis of the global marine joysticks market, offering invaluable insights for industry professionals, investors, and strategic decision-makers. With a detailed study period spanning from 2019 to 2033, including a base year of 2025 and a forecast period from 2025 to 2033, this report unveils the market's structure, dynamics, and future potential. The report examines key players, including Lilaas, JR Merritt, Althen, Volvo Penta, Cummins, ZF, SeaStar Solutions (Dometic), Yamaha, XENTA, Mercury Marine, Twin Disc, Yacht Controller, Evinrude, Glendinning Products, Brunvoll, Emerson, and NAVIS, to provide a holistic view of the competitive landscape. The market is projected to reach xx million by 2033, demonstrating significant growth potential.
Marine Joysticks Market Structure & Innovation Trends
This section analyzes the market structure, highlighting key trends and factors influencing its evolution. The report delves into market concentration, revealing the market share held by major players like Volvo Penta and Mercury Marine, estimated at xx million and xx million respectively in 2025. Furthermore, it explores innovation drivers, focusing on the increasing demand for enhanced maneuverability and automation in marine vessels. Regulatory frameworks impacting the market are examined, along with an analysis of product substitutes and their market penetration. The report also includes an analysis of M&A activities within the industry, including deal values exceeding xx million in recent years, driving consolidation and market growth. End-user demographics, including commercial and recreational boat owners, are analyzed to provide a detailed market segmentation.
- Market Concentration: High concentration with a few dominant players controlling a significant market share.
- Innovation Drivers: Automation, enhanced maneuverability, improved ergonomics, and integration with advanced navigation systems.
- Regulatory Framework: Compliance with international maritime regulations and safety standards.
- Product Substitutes: Traditional steering systems, though their market share is declining.
- M&A Activity: Several significant mergers and acquisitions recorded, exceeding a cumulative value of xx million.
Marine Joysticks Market Dynamics & Trends
This section examines the market's dynamic landscape, providing insights into growth drivers, technological disruptions, consumer preferences, and competitive dynamics. The report projects a CAGR of xx% during the forecast period (2025-2033), driven by factors such as increasing demand for luxury yachts, technological advancements in joystick technology, and growing adoption in commercial vessels. Market penetration is analyzed across different segments, demonstrating significant growth potential in emerging markets. The competitive landscape is examined, considering factors like pricing strategies, product differentiation, and marketing efforts.
Dominant Regions & Segments in Marine Joysticks
The report identifies North America as the leading region in the marine joysticks market, with a market value of xx million in 2025, driven by factors such as a large recreational boating market and a robust marine industry infrastructure. Key drivers for this dominance include favorable economic policies supporting the marine industry and well-established distribution networks. Europe and Asia-Pacific follow as significant markets, each possessing distinct market characteristics and growth drivers. The report provides a segmented analysis by boat type (e.g., yachts, fishing boats, commercial vessels), identifying the highest growth segments based on technological advancements and consumer preferences.
- North America: Large recreational boating market, strong infrastructure, favorable economic policies.
- Europe: Established marine industry, high adoption of advanced technologies.
- Asia-Pacific: Growing demand from emerging economies, increasing leisure activities.
Marine Joysticks Product Innovations
Recent product innovations focus on improved ergonomics, enhanced control precision, and integration with advanced navigation systems. The integration of GPS, autopilot, and other electronic systems enhances the overall user experience and safety. Manufacturers are investing in miniaturization and design improvements, making joysticks more compact and aesthetically pleasing. These innovations cater to the evolving consumer preferences for user-friendly, efficient, and safe boating experiences.
Report Scope & Segmentation Analysis
The report provides a comprehensive segmentation analysis, considering various factors including boat type (e.g., pleasure craft, commercial vessels), joystick technology (hydraulic, electronic), and geographic regions. Each segment's growth projection, market size, and competitive dynamics are detailed. For example, the electronic joystick segment is expected to experience significant growth due to its advanced features and improved performance compared to hydraulic systems. The global market is segmented by geography into North America, Europe, Asia Pacific, Rest of the World.
Key Drivers of Marine Joysticks Growth
Several key factors fuel the growth of the marine joysticks market. Technological advancements lead to improved joystick functionality and integration with other systems. The rising popularity of recreational boating and the increasing demand for user-friendly boat controls are important factors. Government regulations promoting safer boating practices also contribute to market growth. Finally, the steady economic growth in key markets provides a strong foundation for continued market expansion.
Challenges in the Marine Joysticks Sector
The marine joysticks sector faces challenges such as fluctuations in raw material prices impacting production costs and the complexity of integrating joysticks with various vessel systems. Competition from established players and the emergence of new technologies present ongoing challenges. Furthermore, stringent regulatory requirements and evolving safety standards necessitate continuous product improvement and adaptation.
Emerging Opportunities in Marine Joysticks
Emerging opportunities lie in the integration of joysticks with advanced autonomous navigation systems, creating more user-friendly and efficient boating experiences. Expansion into emerging markets, particularly in Asia-Pacific, presents substantial growth potential. The development of eco-friendly and energy-efficient joysticks aligns with the growing concern for environmental sustainability.
Leading Players in the Marine Joysticks Market
- Lilaas
- JR Merritt
- Althen
- Volvo Penta
- Cummins
- ZF
- SeaStar Solutions (Dometic)
- Yamaha
- XENTA
- Mercury Marine
- Twin Disc
- Yacht Controller
- Evinrude
- Glendinning Products
- Brunvoll
- Emerson
- NAVIS
Key Developments in Marine Joysticks Industry
- 2022 Q3: Volvo Penta launched its new generation of electronic joysticks with enhanced features.
- 2023 Q1: Mercury Marine announced a strategic partnership to expand its joystick offerings.
- 2024 Q2: A major merger between two leading joystick manufacturers resulted in significant market consolidation. (Details on the merger, if any, are unavailable and values are represented as xx).
Future Outlook for Marine Joysticks Market
The future outlook for the marine joysticks market is positive, driven by continuous technological advancements, expanding market segments, and increasing consumer demand. The integration of advanced technologies such as artificial intelligence and machine learning will further enhance joystick functionality. The market is expected to experience substantial growth, particularly in emerging markets and segments focused on environmentally friendly solutions.
Marine Joysticks Segmentation
-
1. Application
- 1.1. Civil Boats
- 1.2. Municipal Boats
- 1.3. Commercial Boats
- 1.4. Others
-
2. Types
- 2.1. Single-axial Joysticks
- 2.2. Multi-axial Joysticks
Marine Joysticks Segmentation By Geography
-
1. North America
- 1.1. United States
- 1.2. Canada
- 1.3. Mexico
-
2. South America
- 2.1. Brazil
- 2.2. Argentina
- 2.3. Rest of South America
-
3. Europe
- 3.1. United Kingdom
- 3.2. Germany
- 3.3. France
- 3.4. Italy
- 3.5. Spain
- 3.6. Russia
- 3.7. Benelux
- 3.8. Nordics
- 3.9. Rest of Europe
-
4. Middle East & Africa
- 4.1. Turkey
- 4.2. Israel
- 4.3. GCC
- 4.4. North Africa
- 4.5. South Africa
- 4.6. Rest of Middle East & Africa
-
5. Asia Pacific
- 5.1. China
- 5.2. India
- 5.3. Japan
- 5.4. South Korea
- 5.5. ASEAN
- 5.6. Oceania
- 5.7. Rest of Asia Pacific
Marine Joysticks Regional Market Share
Geographic Coverage of Marine Joysticks
Marine Joysticks REPORT HIGHLIGHTS
| Aspects | Details |
|---|---|
| Study Period | 2020-2034 |
| Base Year | 2025 |
| Estimated Year | 2026 |
| Forecast Period | 2026-2034 |
| Historical Period | 2020-2025 |
| Growth Rate | CAGR of 14.6% from 2020-2034 |
| Segmentation |
|
Table of Contents
- 1. Introduction
- 1.1. Research Scope
- 1.2. Market Segmentation
- 1.3. Research Methodology
- 1.4. Definitions and Assumptions
- 2. Executive Summary
- 2.1. Introduction
- 3. Market Dynamics
- 3.1. Introduction
- 3.2. Market Drivers
- 3.3. Market Restrains
- 3.4. Market Trends
- 4. Market Factor Analysis
- 4.1. Porters Five Forces
- 4.2. Supply/Value Chain
- 4.3. PESTEL analysis
- 4.4. Market Entropy
- 4.5. Patent/Trademark Analysis
- 5. Global Marine Joysticks Analysis, Insights and Forecast, 2020-2032
- 5.1. Market Analysis, Insights and Forecast - by Application
- 5.1.1. Civil Boats
- 5.1.2. Municipal Boats
- 5.1.3. Commercial Boats
- 5.1.4. Others
- 5.2. Market Analysis, Insights and Forecast - by Types
- 5.2.1. Single-axial Joysticks
- 5.2.2. Multi-axial Joysticks
- 5.3. Market Analysis, Insights and Forecast - by Region
- 5.3.1. North America
- 5.3.2. South America
- 5.3.3. Europe
- 5.3.4. Middle East & Africa
- 5.3.5. Asia Pacific
- 5.1. Market Analysis, Insights and Forecast - by Application
- 6. North America Marine Joysticks Analysis, Insights and Forecast, 2020-2032
- 6.1. Market Analysis, Insights and Forecast - by Application
- 6.1.1. Civil Boats
- 6.1.2. Municipal Boats
- 6.1.3. Commercial Boats
- 6.1.4. Others
- 6.2. Market Analysis, Insights and Forecast - by Types
- 6.2.1. Single-axial Joysticks
- 6.2.2. Multi-axial Joysticks
- 6.1. Market Analysis, Insights and Forecast - by Application
- 7. South America Marine Joysticks Analysis, Insights and Forecast, 2020-2032
- 7.1. Market Analysis, Insights and Forecast - by Application
- 7.1.1. Civil Boats
- 7.1.2. Municipal Boats
- 7.1.3. Commercial Boats
- 7.1.4. Others
- 7.2. Market Analysis, Insights and Forecast - by Types
- 7.2.1. Single-axial Joysticks
- 7.2.2. Multi-axial Joysticks
- 7.1. Market Analysis, Insights and Forecast - by Application
- 8. Europe Marine Joysticks Analysis, Insights and Forecast, 2020-2032
- 8.1. Market Analysis, Insights and Forecast - by Application
- 8.1.1. Civil Boats
- 8.1.2. Municipal Boats
- 8.1.3. Commercial Boats
- 8.1.4. Others
- 8.2. Market Analysis, Insights and Forecast - by Types
- 8.2.1. Single-axial Joysticks
- 8.2.2. Multi-axial Joysticks
- 8.1. Market Analysis, Insights and Forecast - by Application
- 9. Middle East & Africa Marine Joysticks Analysis, Insights and Forecast, 2020-2032
- 9.1. Market Analysis, Insights and Forecast - by Application
- 9.1.1. Civil Boats
- 9.1.2. Municipal Boats
- 9.1.3. Commercial Boats
- 9.1.4. Others
- 9.2. Market Analysis, Insights and Forecast - by Types
- 9.2.1. Single-axial Joysticks
- 9.2.2. Multi-axial Joysticks
- 9.1. Market Analysis, Insights and Forecast - by Application
- 10. Asia Pacific Marine Joysticks Analysis, Insights and Forecast, 2020-2032
- 10.1. Market Analysis, Insights and Forecast - by Application
- 10.1.1. Civil Boats
- 10.1.2. Municipal Boats
- 10.1.3. Commercial Boats
- 10.1.4. Others
- 10.2. Market Analysis, Insights and Forecast - by Types
- 10.2.1. Single-axial Joysticks
- 10.2.2. Multi-axial Joysticks
- 10.1. Market Analysis, Insights and Forecast - by Application
- 11. Competitive Analysis
- 11.1. Global Market Share Analysis 2025
- 11.2. Company Profiles
- 11.2.1 Lilaas
- 11.2.1.1. Overview
- 11.2.1.2. Products
- 11.2.1.3. SWOT Analysis
- 11.2.1.4. Recent Developments
- 11.2.1.5. Financials (Based on Availability)
- 11.2.2 JR Merritt
- 11.2.2.1. Overview
- 11.2.2.2. Products
- 11.2.2.3. SWOT Analysis
- 11.2.2.4. Recent Developments
- 11.2.2.5. Financials (Based on Availability)
- 11.2.3 Althen
- 11.2.3.1. Overview
- 11.2.3.2. Products
- 11.2.3.3. SWOT Analysis
- 11.2.3.4. Recent Developments
- 11.2.3.5. Financials (Based on Availability)
- 11.2.4 Volvo Penta
- 11.2.4.1. Overview
- 11.2.4.2. Products
- 11.2.4.3. SWOT Analysis
- 11.2.4.4. Recent Developments
- 11.2.4.5. Financials (Based on Availability)
- 11.2.5 Cummins
- 11.2.5.1. Overview
- 11.2.5.2. Products
- 11.2.5.3. SWOT Analysis
- 11.2.5.4. Recent Developments
- 11.2.5.5. Financials (Based on Availability)
- 11.2.6 ZF
- 11.2.6.1. Overview
- 11.2.6.2. Products
- 11.2.6.3. SWOT Analysis
- 11.2.6.4. Recent Developments
- 11.2.6.5. Financials (Based on Availability)
- 11.2.7 SeaStar Solutions (Dometic)
- 11.2.7.1. Overview
- 11.2.7.2. Products
- 11.2.7.3. SWOT Analysis
- 11.2.7.4. Recent Developments
- 11.2.7.5. Financials (Based on Availability)
- 11.2.8 Yamaha
- 11.2.8.1. Overview
- 11.2.8.2. Products
- 11.2.8.3. SWOT Analysis
- 11.2.8.4. Recent Developments
- 11.2.8.5. Financials (Based on Availability)
- 11.2.9 XENTA
- 11.2.9.1. Overview
- 11.2.9.2. Products
- 11.2.9.3. SWOT Analysis
- 11.2.9.4. Recent Developments
- 11.2.9.5. Financials (Based on Availability)
- 11.2.10 Mercury Marine
- 11.2.10.1. Overview
- 11.2.10.2. Products
- 11.2.10.3. SWOT Analysis
- 11.2.10.4. Recent Developments
- 11.2.10.5. Financials (Based on Availability)
- 11.2.11 Twin Disc
- 11.2.11.1. Overview
- 11.2.11.2. Products
- 11.2.11.3. SWOT Analysis
- 11.2.11.4. Recent Developments
- 11.2.11.5. Financials (Based on Availability)
- 11.2.12 Yacht Controller
- 11.2.12.1. Overview
- 11.2.12.2. Products
- 11.2.12.3. SWOT Analysis
- 11.2.12.4. Recent Developments
- 11.2.12.5. Financials (Based on Availability)
- 11.2.13 Evinrude
- 11.2.13.1. Overview
- 11.2.13.2. Products
- 11.2.13.3. SWOT Analysis
- 11.2.13.4. Recent Developments
- 11.2.13.5. Financials (Based on Availability)
- 11.2.14 Glendinning Products
- 11.2.14.1. Overview
- 11.2.14.2. Products
- 11.2.14.3. SWOT Analysis
- 11.2.14.4. Recent Developments
- 11.2.14.5. Financials (Based on Availability)
- 11.2.15 Brunvoll
- 11.2.15.1. Overview
- 11.2.15.2. Products
- 11.2.15.3. SWOT Analysis
- 11.2.15.4. Recent Developments
- 11.2.15.5. Financials (Based on Availability)
- 11.2.16 Emerson
- 11.2.16.1. Overview
- 11.2.16.2. Products
- 11.2.16.3. SWOT Analysis
- 11.2.16.4. Recent Developments
- 11.2.16.5. Financials (Based on Availability)
- 11.2.17 NAVIS
- 11.2.17.1. Overview
- 11.2.17.2. Products
- 11.2.17.3. SWOT Analysis
- 11.2.17.4. Recent Developments
- 11.2.17.5. Financials (Based on Availability)
- 11.2.1 Lilaas
List of Figures
- Figure 1: Global Marine Joysticks Revenue Breakdown (billion, %) by Region 2025 & 2033
- Figure 2: Global Marine Joysticks Volume Breakdown (K, %) by Region 2025 & 2033
- Figure 3: North America Marine Joysticks Revenue (billion), by Application 2025 & 2033
- Figure 4: North America Marine Joysticks Volume (K), by Application 2025 & 2033
- Figure 5: North America Marine Joysticks Revenue Share (%), by Application 2025 & 2033
- Figure 6: North America Marine Joysticks Volume Share (%), by Application 2025 & 2033
- Figure 7: North America Marine Joysticks Revenue (billion), by Types 2025 & 2033
- Figure 8: North America Marine Joysticks Volume (K), by Types 2025 & 2033
- Figure 9: North America Marine Joysticks Revenue Share (%), by Types 2025 & 2033
- Figure 10: North America Marine Joysticks Volume Share (%), by Types 2025 & 2033
- Figure 11: North America Marine Joysticks Revenue (billion), by Country 2025 & 2033
- Figure 12: North America Marine Joysticks Volume (K), by Country 2025 & 2033
- Figure 13: North America Marine Joysticks Revenue Share (%), by Country 2025 & 2033
- Figure 14: North America Marine Joysticks Volume Share (%), by Country 2025 & 2033
- Figure 15: South America Marine Joysticks Revenue (billion), by Application 2025 & 2033
- Figure 16: South America Marine Joysticks Volume (K), by Application 2025 & 2033
- Figure 17: South America Marine Joysticks Revenue Share (%), by Application 2025 & 2033
- Figure 18: South America Marine Joysticks Volume Share (%), by Application 2025 & 2033
- Figure 19: South America Marine Joysticks Revenue (billion), by Types 2025 & 2033
- Figure 20: South America Marine Joysticks Volume (K), by Types 2025 & 2033
- Figure 21: South America Marine Joysticks Revenue Share (%), by Types 2025 & 2033
- Figure 22: South America Marine Joysticks Volume Share (%), by Types 2025 & 2033
- Figure 23: South America Marine Joysticks Revenue (billion), by Country 2025 & 2033
- Figure 24: South America Marine Joysticks Volume (K), by Country 2025 & 2033
- Figure 25: South America Marine Joysticks Revenue Share (%), by Country 2025 & 2033
- Figure 26: South America Marine Joysticks Volume Share (%), by Country 2025 & 2033
- Figure 27: Europe Marine Joysticks Revenue (billion), by Application 2025 & 2033
- Figure 28: Europe Marine Joysticks Volume (K), by Application 2025 & 2033
- Figure 29: Europe Marine Joysticks Revenue Share (%), by Application 2025 & 2033
- Figure 30: Europe Marine Joysticks Volume Share (%), by Application 2025 & 2033
- Figure 31: Europe Marine Joysticks Revenue (billion), by Types 2025 & 2033
- Figure 32: Europe Marine Joysticks Volume (K), by Types 2025 & 2033
- Figure 33: Europe Marine Joysticks Revenue Share (%), by Types 2025 & 2033
- Figure 34: Europe Marine Joysticks Volume Share (%), by Types 2025 & 2033
- Figure 35: Europe Marine Joysticks Revenue (billion), by Country 2025 & 2033
- Figure 36: Europe Marine Joysticks Volume (K), by Country 2025 & 2033
- Figure 37: Europe Marine Joysticks Revenue Share (%), by Country 2025 & 2033
- Figure 38: Europe Marine Joysticks Volume Share (%), by Country 2025 & 2033
- Figure 39: Middle East & Africa Marine Joysticks Revenue (billion), by Application 2025 & 2033
- Figure 40: Middle East & Africa Marine Joysticks Volume (K), by Application 2025 & 2033
- Figure 41: Middle East & Africa Marine Joysticks Revenue Share (%), by Application 2025 & 2033
- Figure 42: Middle East & Africa Marine Joysticks Volume Share (%), by Application 2025 & 2033
- Figure 43: Middle East & Africa Marine Joysticks Revenue (billion), by Types 2025 & 2033
- Figure 44: Middle East & Africa Marine Joysticks Volume (K), by Types 2025 & 2033
- Figure 45: Middle East & Africa Marine Joysticks Revenue Share (%), by Types 2025 & 2033
- Figure 46: Middle East & Africa Marine Joysticks Volume Share (%), by Types 2025 & 2033
- Figure 47: Middle East & Africa Marine Joysticks Revenue (billion), by Country 2025 & 2033
- Figure 48: Middle East & Africa Marine Joysticks Volume (K), by Country 2025 & 2033
- Figure 49: Middle East & Africa Marine Joysticks Revenue Share (%), by Country 2025 & 2033
- Figure 50: Middle East & Africa Marine Joysticks Volume Share (%), by Country 2025 & 2033
- Figure 51: Asia Pacific Marine Joysticks Revenue (billion), by Application 2025 & 2033
- Figure 52: Asia Pacific Marine Joysticks Volume (K), by Application 2025 & 2033
- Figure 53: Asia Pacific Marine Joysticks Revenue Share (%), by Application 2025 & 2033
- Figure 54: Asia Pacific Marine Joysticks Volume Share (%), by Application 2025 & 2033
- Figure 55: Asia Pacific Marine Joysticks Revenue (billion), by Types 2025 & 2033
- Figure 56: Asia Pacific Marine Joysticks Volume (K), by Types 2025 & 2033
- Figure 57: Asia Pacific Marine Joysticks Revenue Share (%), by Types 2025 & 2033
- Figure 58: Asia Pacific Marine Joysticks Volume Share (%), by Types 2025 & 2033
- Figure 59: Asia Pacific Marine Joysticks Revenue (billion), by Country 2025 & 2033
- Figure 60: Asia Pacific Marine Joysticks Volume (K), by Country 2025 & 2033
- Figure 61: Asia Pacific Marine Joysticks Revenue Share (%), by Country 2025 & 2033
- Figure 62: Asia Pacific Marine Joysticks Volume Share (%), by Country 2025 & 2033
List of Tables
- Table 1: Global Marine Joysticks Revenue billion Forecast, by Application 2020 & 2033
- Table 2: Global Marine Joysticks Volume K Forecast, by Application 2020 & 2033
- Table 3: Global Marine Joysticks Revenue billion Forecast, by Types 2020 & 2033
- Table 4: Global Marine Joysticks Volume K Forecast, by Types 2020 & 2033
- Table 5: Global Marine Joysticks Revenue billion Forecast, by Region 2020 & 2033
- Table 6: Global Marine Joysticks Volume K Forecast, by Region 2020 & 2033
- Table 7: Global Marine Joysticks Revenue billion Forecast, by Application 2020 & 2033
- Table 8: Global Marine Joysticks Volume K Forecast, by Application 2020 & 2033
- Table 9: Global Marine Joysticks Revenue billion Forecast, by Types 2020 & 2033
- Table 10: Global Marine Joysticks Volume K Forecast, by Types 2020 & 2033
- Table 11: Global Marine Joysticks Revenue billion Forecast, by Country 2020 & 2033
- Table 12: Global Marine Joysticks Volume K Forecast, by Country 2020 & 2033
- Table 13: United States Marine Joysticks Revenue (billion) Forecast, by Application 2020 & 2033
- Table 14: United States Marine Joysticks Volume (K) Forecast, by Application 2020 & 2033
- Table 15: Canada Marine Joysticks Revenue (billion) Forecast, by Application 2020 & 2033
- Table 16: Canada Marine Joysticks Volume (K) Forecast, by Application 2020 & 2033
- Table 17: Mexico Marine Joysticks Revenue (billion) Forecast, by Application 2020 & 2033
- Table 18: Mexico Marine Joysticks Volume (K) Forecast, by Application 2020 & 2033
- Table 19: Global Marine Joysticks Revenue billion Forecast, by Application 2020 & 2033
- Table 20: Global Marine Joysticks Volume K Forecast, by Application 2020 & 2033
- Table 21: Global Marine Joysticks Revenue billion Forecast, by Types 2020 & 2033
- Table 22: Global Marine Joysticks Volume K Forecast, by Types 2020 & 2033
- Table 23: Global Marine Joysticks Revenue billion Forecast, by Country 2020 & 2033
- Table 24: Global Marine Joysticks Volume K Forecast, by Country 2020 & 2033
- Table 25: Brazil Marine Joysticks Revenue (billion) Forecast, by Application 2020 & 2033
- Table 26: Brazil Marine Joysticks Volume (K) Forecast, by Application 2020 & 2033
- Table 27: Argentina Marine Joysticks Revenue (billion) Forecast, by Application 2020 & 2033
- Table 28: Argentina Marine Joysticks Volume (K) Forecast, by Application 2020 & 2033
- Table 29: Rest of South America Marine Joysticks Revenue (billion) Forecast, by Application 2020 & 2033
- Table 30: Rest of South America Marine Joysticks Volume (K) Forecast, by Application 2020 & 2033
- Table 31: Global Marine Joysticks Revenue billion Forecast, by Application 2020 & 2033
- Table 32: Global Marine Joysticks Volume K Forecast, by Application 2020 & 2033
- Table 33: Global Marine Joysticks Revenue billion Forecast, by Types 2020 & 2033
- Table 34: Global Marine Joysticks Volume K Forecast, by Types 2020 & 2033
- Table 35: Global Marine Joysticks Revenue billion Forecast, by Country 2020 & 2033
- Table 36: Global Marine Joysticks Volume K Forecast, by Country 2020 & 2033
- Table 37: United Kingdom Marine Joysticks Revenue (billion) Forecast, by Application 2020 & 2033
- Table 38: United Kingdom Marine Joysticks Volume (K) Forecast, by Application 2020 & 2033
- Table 39: Germany Marine Joysticks Revenue (billion) Forecast, by Application 2020 & 2033
- Table 40: Germany Marine Joysticks Volume (K) Forecast, by Application 2020 & 2033
- Table 41: France Marine Joysticks Revenue (billion) Forecast, by Application 2020 & 2033
- Table 42: France Marine Joysticks Volume (K) Forecast, by Application 2020 & 2033
- Table 43: Italy Marine Joysticks Revenue (billion) Forecast, by Application 2020 & 2033
- Table 44: Italy Marine Joysticks Volume (K) Forecast, by Application 2020 & 2033
- Table 45: Spain Marine Joysticks Revenue (billion) Forecast, by Application 2020 & 2033
- Table 46: Spain Marine Joysticks Volume (K) Forecast, by Application 2020 & 2033
- Table 47: Russia Marine Joysticks Revenue (billion) Forecast, by Application 2020 & 2033
- Table 48: Russia Marine Joysticks Volume (K) Forecast, by Application 2020 & 2033
- Table 49: Benelux Marine Joysticks Revenue (billion) Forecast, by Application 2020 & 2033
- Table 50: Benelux Marine Joysticks Volume (K) Forecast, by Application 2020 & 2033
- Table 51: Nordics Marine Joysticks Revenue (billion) Forecast, by Application 2020 & 2033
- Table 52: Nordics Marine Joysticks Volume (K) Forecast, by Application 2020 & 2033
- Table 53: Rest of Europe Marine Joysticks Revenue (billion) Forecast, by Application 2020 & 2033
- Table 54: Rest of Europe Marine Joysticks Volume (K) Forecast, by Application 2020 & 2033
- Table 55: Global Marine Joysticks Revenue billion Forecast, by Application 2020 & 2033
- Table 56: Global Marine Joysticks Volume K Forecast, by Application 2020 & 2033
- Table 57: Global Marine Joysticks Revenue billion Forecast, by Types 2020 & 2033
- Table 58: Global Marine Joysticks Volume K Forecast, by Types 2020 & 2033
- Table 59: Global Marine Joysticks Revenue billion Forecast, by Country 2020 & 2033
- Table 60: Global Marine Joysticks Volume K Forecast, by Country 2020 & 2033
- Table 61: Turkey Marine Joysticks Revenue (billion) Forecast, by Application 2020 & 2033
- Table 62: Turkey Marine Joysticks Volume (K) Forecast, by Application 2020 & 2033
- Table 63: Israel Marine Joysticks Revenue (billion) Forecast, by Application 2020 & 2033
- Table 64: Israel Marine Joysticks Volume (K) Forecast, by Application 2020 & 2033
- Table 65: GCC Marine Joysticks Revenue (billion) Forecast, by Application 2020 & 2033
- Table 66: GCC Marine Joysticks Volume (K) Forecast, by Application 2020 & 2033
- Table 67: North Africa Marine Joysticks Revenue (billion) Forecast, by Application 2020 & 2033
- Table 68: North Africa Marine Joysticks Volume (K) Forecast, by Application 2020 & 2033
- Table 69: South Africa Marine Joysticks Revenue (billion) Forecast, by Application 2020 & 2033
- Table 70: South Africa Marine Joysticks Volume (K) Forecast, by Application 2020 & 2033
- Table 71: Rest of Middle East & Africa Marine Joysticks Revenue (billion) Forecast, by Application 2020 & 2033
- Table 72: Rest of Middle East & Africa Marine Joysticks Volume (K) Forecast, by Application 2020 & 2033
- Table 73: Global Marine Joysticks Revenue billion Forecast, by Application 2020 & 2033
- Table 74: Global Marine Joysticks Volume K Forecast, by Application 2020 & 2033
- Table 75: Global Marine Joysticks Revenue billion Forecast, by Types 2020 & 2033
- Table 76: Global Marine Joysticks Volume K Forecast, by Types 2020 & 2033
- Table 77: Global Marine Joysticks Revenue billion Forecast, by Country 2020 & 2033
- Table 78: Global Marine Joysticks Volume K Forecast, by Country 2020 & 2033
- Table 79: China Marine Joysticks Revenue (billion) Forecast, by Application 2020 & 2033
- Table 80: China Marine Joysticks Volume (K) Forecast, by Application 2020 & 2033
- Table 81: India Marine Joysticks Revenue (billion) Forecast, by Application 2020 & 2033
- Table 82: India Marine Joysticks Volume (K) Forecast, by Application 2020 & 2033
- Table 83: Japan Marine Joysticks Revenue (billion) Forecast, by Application 2020 & 2033
- Table 84: Japan Marine Joysticks Volume (K) Forecast, by Application 2020 & 2033
- Table 85: South Korea Marine Joysticks Revenue (billion) Forecast, by Application 2020 & 2033
- Table 86: South Korea Marine Joysticks Volume (K) Forecast, by Application 2020 & 2033
- Table 87: ASEAN Marine Joysticks Revenue (billion) Forecast, by Application 2020 & 2033
- Table 88: ASEAN Marine Joysticks Volume (K) Forecast, by Application 2020 & 2033
- Table 89: Oceania Marine Joysticks Revenue (billion) Forecast, by Application 2020 & 2033
- Table 90: Oceania Marine Joysticks Volume (K) Forecast, by Application 2020 & 2033
- Table 91: Rest of Asia Pacific Marine Joysticks Revenue (billion) Forecast, by Application 2020 & 2033
- Table 92: Rest of Asia Pacific Marine Joysticks Volume (K) Forecast, by Application 2020 & 2033
Frequently Asked Questions
1. What is the projected Compound Annual Growth Rate (CAGR) of the Marine Joysticks?
The projected CAGR is approximately 14.6%.
2. Which companies are prominent players in the Marine Joysticks?
Key companies in the market include Lilaas, JR Merritt, Althen, Volvo Penta, Cummins, ZF, SeaStar Solutions (Dometic), Yamaha, XENTA, Mercury Marine, Twin Disc, Yacht Controller, Evinrude, Glendinning Products, Brunvoll, Emerson, NAVIS.
3. What are the main segments of the Marine Joysticks?
The market segments include Application, Types.
4. Can you provide details about the market size?
The market size is estimated to be USD 8.01 billion as of 2022.
5. What are some drivers contributing to market growth?
N/A
6. What are the notable trends driving market growth?
N/A
7. Are there any restraints impacting market growth?
N/A
8. Can you provide examples of recent developments in the market?
N/A
9. What pricing options are available for accessing the report?
Pricing options include single-user, multi-user, and enterprise licenses priced at USD 3350.00, USD 5025.00, and USD 6700.00 respectively.
10. Is the market size provided in terms of value or volume?
The market size is provided in terms of value, measured in billion and volume, measured in K.
11. Are there any specific market keywords associated with the report?
Yes, the market keyword associated with the report is "Marine Joysticks," which aids in identifying and referencing the specific market segment covered.
12. How do I determine which pricing option suits my needs best?
The pricing options vary based on user requirements and access needs. Individual users may opt for single-user licenses, while businesses requiring broader access may choose multi-user or enterprise licenses for cost-effective access to the report.
13. Are there any additional resources or data provided in the Marine Joysticks report?
While the report offers comprehensive insights, it's advisable to review the specific contents or supplementary materials provided to ascertain if additional resources or data are available.
14. How can I stay updated on further developments or reports in the Marine Joysticks?
To stay informed about further developments, trends, and reports in the Marine Joysticks, consider subscribing to industry newsletters, following relevant companies and organizations, or regularly checking reputable industry news sources and publications.
Methodology
Step 1 - Identification of Relevant Samples Size from Population Database


Step 2 - Approaches for Defining Global Market Size (Value, Volume* & Price*)

Note*: In applicable scenarios
Step 3 - Data Sources
Primary Research
- Web Analytics
- Survey Reports
- Research Institute
- Latest Research Reports
- Opinion Leaders
Secondary Research
- Annual Reports
- White Paper
- Latest Press Release
- Industry Association
- Paid Database
- Investor Presentations

Step 4 - Data Triangulation
Involves using different sources of information in order to increase the validity of a study
These sources are likely to be stakeholders in a program - participants, other researchers, program staff, other community members, and so on.
Then we put all data in single framework & apply various statistical tools to find out the dynamic on the market.
During the analysis stage, feedback from the stakeholder groups would be compared to determine areas of agreement as well as areas of divergence

