

Key Insights
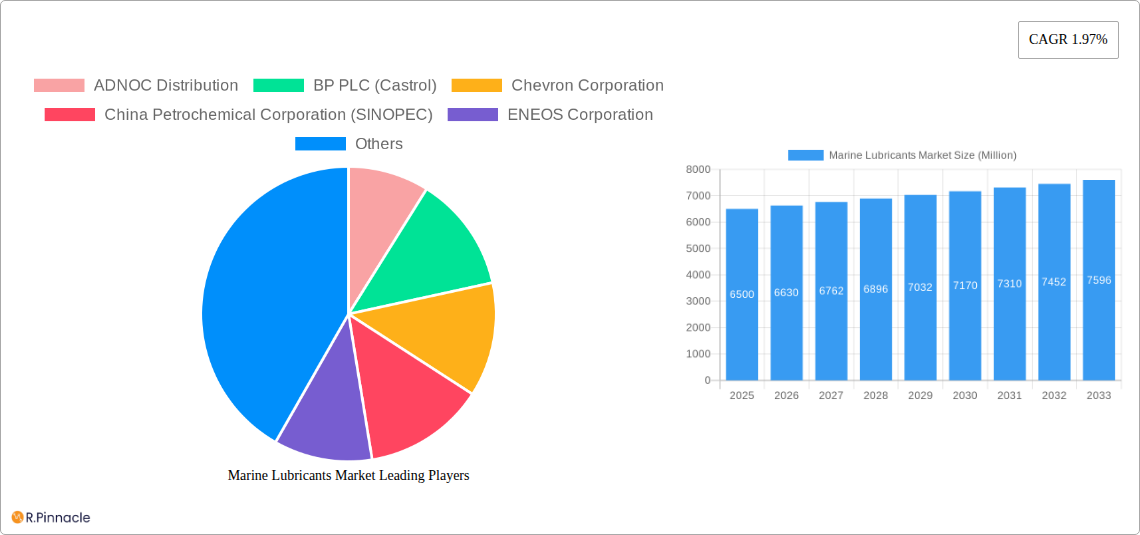
The global marine lubricants market, estimated at $6.2 billion in 2025, is poised for consistent expansion with a projected Compound Annual Growth Rate (CAGR) of 1.5%. This growth is fueled by escalating global shipping activities and increasingly stringent environmental regulations. Key drivers include the demand for fuel-efficient lubricants to lower operational expenditures and the implementation of regulations like IMO 2020, which necessitates specialized lubricants due to reduced sulfur content in marine fuels. The expansion of global trade and the thriving cruise industry also contribute significantly to market growth. However, market expansion is moderated by oil price volatility impacting lubricant costs and economic downturns affecting shipping volumes. The market is segmented by lubricant type, application, and vessel type. Leading companies such as ADNOC Distribution, BP PLC (Castrol), Chevron Corporation, and Shell PLC command a significant market share through their extensive distribution networks and advanced lubricant formulations. Future growth hinges on technological advancements, particularly in environmentally friendly bio-based lubricants and digital solutions for predictive maintenance to optimize lubricant performance and engine longevity.
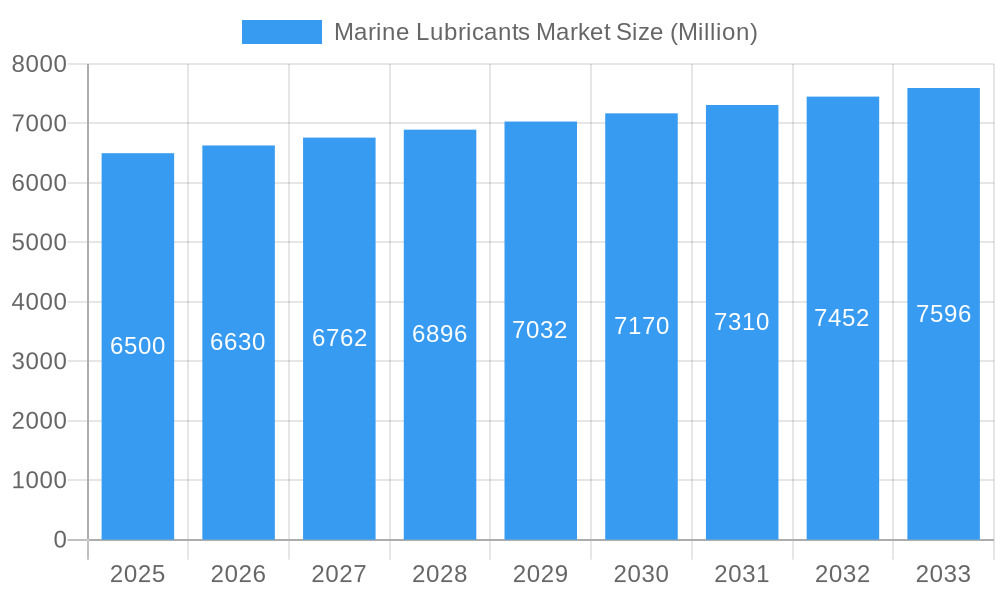
Marine Lubricants Market Market Size (In Billion)
The competitive environment is characterized by intense rivalry among established players, emphasizing product differentiation through superior performance and environmental sustainability. Regional growth patterns vary, with the Asia-Pacific region demonstrating accelerated expansion driven by robust economic activity and maritime trade growth. North America and Europe, while mature markets, anticipate steady growth fueled by the adoption of advanced lubricant technologies and regulatory adherence. The long-term outlook for global trade and maritime transportation positively influences the market's growth trajectory, although economic instability and environmental considerations present ongoing challenges to sustained high growth. Strategic initiatives by key market participants, including investments in research and development and strategic alliances, will be critical for achieving market success.
Marine Lubricants Market Company Market Share
Marine Lubricants Market Report: 2019-2033
This comprehensive report provides an in-depth analysis of the Marine Lubricants Market, offering invaluable insights for industry professionals, investors, and strategic decision-makers. With a study period spanning 2019-2033, a base year of 2025, and a forecast period of 2025-2033, this report leverages historical data (2019-2024) to predict future market trends and opportunities. The market is valued at xx Million in 2025 and is projected to reach xx Million by 2033, exhibiting a CAGR of xx%.
Marine Lubricants Market Structure & Innovation Trends
The marine lubricants market is characterized by a moderately concentrated structure, with key players such as ADNOC Distribution, BP PLC (Castrol), Chevron Corporation, China Petrochemical Corporation (SINOPEC), ENEOS Corporation, Exxon Mobil Corporation, FUCHS, Gazprom Neft PJSC, Gulf Oil International Ltd, Idemitsu Kosan Co Ltd, Indian Oil Corporation Ltd, LUKOIL, Shell PLC, and Total Energies SE holding significant market share. However, the market also features several smaller, specialized players. Market share data for 2025 indicates that the top five players control approximately xx% of the market, while the remaining share is distributed amongst numerous smaller competitors. Recent M&A activity has been relatively subdued, with the total value of deals in the past five years estimated at xx Million. Innovation is driven by the need for environmentally friendly lubricants, stricter emission regulations (IMO 2020), and the adoption of alternative fuels like LNG and methanol. The market is subject to various regulatory frameworks, including those concerning environmental protection and product safety. Key product substitutes include bio-based lubricants and synthetic oils. The end-user demographics are primarily large shipping companies, ports, and shipyards.
- Market Concentration: Moderately concentrated, with top 5 players holding xx% market share (2025).
- Innovation Drivers: Environmental regulations (IMO 2020), alternative fuels (LNG, methanol), and improved engine efficiency.
- Regulatory Frameworks: Stringent environmental and safety standards governing lubricant composition and disposal.
- Product Substitutes: Bio-based lubricants, synthetic oils.
- M&A Activity (2020-2024): Total deal value estimated at xx Million.
Marine Lubricants Market Dynamics & Trends
The marine lubricants market is experiencing robust growth, fueled by the increasing global shipping volume, expansion of the maritime trade, and the rising demand for high-performance lubricants to meet stringent environmental regulations. The market is undergoing significant technological disruptions, with a focus on developing eco-friendly, bio-based, and energy-efficient lubricants. Consumer preferences are shifting towards sustainable and high-performance products that minimize environmental impact and optimize engine performance. Competitive dynamics are intense, with major players investing heavily in research and development, expanding their product portfolios, and adopting strategic partnerships to gain a competitive edge. The market penetration of advanced lubricant technologies, such as those designed for LNG-fueled vessels, is steadily increasing.
Dominant Regions & Segments in Marine Lubricants Market
Asia-Pacific currently dominates the marine lubricants market, driven by the region's large and rapidly growing shipping industry, extensive port infrastructure, and strong economic growth.
- Key Drivers in Asia-Pacific:
- Rapid growth of shipping and maritime trade.
- Increasing investments in port infrastructure.
- Strong economic growth in several countries.
- Rising demand for high-performance lubricants.
Other regions like Europe and North America hold significant shares, but their growth rates are comparatively slower. This dominance is primarily attributed to the region's sizable fleet of vessels, extensive shipbuilding activities, and robust maritime trade. A detailed analysis reveals the competitive landscape within the region, highlighting market leaders and their strategies. Specific market segments, such as those catering to particular vessel types or lubricant applications, show varied growth rates reflecting differing technological demands and regulatory pressures.
Marine Lubricants Market Product Innovations
Recent product innovations focus on environmentally friendly formulations, meeting the demands of stricter emission regulations. Castrol's launch of Cyltech 40 XDC, a marine cylinder oil suitable for LNG and methanol-fueled vessels, exemplifies this trend. These new lubricants offer improved performance, reduced emissions, and enhanced engine protection, catering to the evolving needs of the shipping industry. The competitive advantage lies in offering superior performance, reduced environmental impact, and cost-effectiveness.
Report Scope & Segmentation Analysis
This report segments the marine lubricants market by lubricant type (e.g., engine oils, gear oils, greases), vessel type (e.g., tankers, container ships, bulk carriers), and geography. Each segment's growth projections, market size (in Million), and competitive dynamics are analyzed in detail. Detailed analysis of market segments reveals diverse growth trajectories driven by factors specific to each segment.
Key Drivers of Marine Lubricants Market Growth
Growth is primarily driven by:
- Increasing Global Shipping Volume: The continuous rise in global trade and maritime transportation fuels the demand for marine lubricants.
- Stringent Environmental Regulations: Compliance with IMO 2020 and other environmental standards drives the adoption of low-sulfur and eco-friendly lubricants.
- Technological Advancements: Innovations in lubricant formulations lead to improved engine performance, fuel efficiency, and reduced emissions.
Challenges in the Marine Lubricants Market Sector
Challenges include:
- Fluctuating Crude Oil Prices: Raw material costs significantly impact lubricant pricing and profitability.
- Supply Chain Disruptions: Global events can disrupt the supply of raw materials and finished products.
- Intense Competition: The market is highly competitive, with major players vying for market share.
Emerging Opportunities in Marine Lubricants Market
Emerging opportunities lie in:
- Bio-based and Sustainable Lubricants: Growing demand for environmentally friendly products creates new market segments.
- Lubricants for Alternative Fuels: The shift towards LNG and methanol fuels opens avenues for specialized lubricant development.
- Digitalization and Data Analytics: Optimizing lubricant usage and maintenance through data-driven insights.
Leading Players in the Marine Lubricants Market Market
- ADNOC Distribution
- BP PLC (Castrol)
- Chevron Corporation
- China Petrochemical Corporation (SINOPEC)
- ENEOS Corporation
- Exxon Mobil Corporation
- FUCHS
- Gazprom Neft PJSC
- Gulf Oil International Ltd
- Idemitsu Kosan Co Ltd
- Indian Oil Corporation Ltd
- LUKOIL
- Shell PLC
- Total Energies SE
- List Not Exhaustive
Key Developments in Marine Lubricants Market Industry
- April 2024: AD Ports Group partners with ADNOC Distribution to globally distribute marine lubricants.
- March 2023: Castrol launches Cyltech 40 XDC marine cylinder oil for LNG and methanol-fueled vessels.
- February 2023: Luberef expands its base oil plant in Yanbu' al Bahr, Saudi Arabia, increasing capacity by 230,000 metric tons annually.
Future Outlook for Marine Lubricants Market Market
The marine lubricants market is poised for continued growth, driven by increasing global trade, stricter environmental regulations, and technological advancements. Strategic opportunities exist in developing innovative, sustainable, and high-performance lubricants that meet the evolving needs of the shipping industry. The market is expected to witness significant expansion in the coming years, fueled by these factors.
Marine Lubricants Market Segmentation
-
1. Lubricant Type
- 1.1. System Oil
- 1.2. Marine Cylinder Lubricant
- 1.3. Trunk Piston Engine Oil
- 1.4. Other Lubricant Types
-
2. Ship Type
- 2.1. Bulker
- 2.2. Tanker
- 2.3. Container
- 2.4. Other Ship Types
Marine Lubricants Market Segmentation By Geography
-
1. Asia Pacific
- 1.1. China
- 1.2. India
- 1.3. Japan
- 1.4. South Korea
- 1.5. Malaysia
- 1.6. Thailand
- 1.7. Indonesia
- 1.8. Vietnam
- 1.9. Rest of Asia Pacific
-
2. North America
- 2.1. United States
- 2.2. Canada
- 2.3. Mexico
-
3. Europe
- 3.1. Germany
- 3.2. United Kingdom
- 3.3. France
- 3.4. Italy
- 3.5. Spain
- 3.6. NORDIC Countries
- 3.7. Turkey
- 3.8. Russia
- 3.9. Rest of Europe
-
4. South America
- 4.1. Brazil
- 4.2. Argentina
- 4.3. Colombia
- 4.4. Rest of South America
-
5. Middle East and Africa
- 5.1. Saudi Arabia
- 5.2. Qatar
- 5.3. United Arab Emirates
- 5.4. Nigeria
- 5.5. Egypt
- 5.6. South Africa
- 5.7. Rest of Middle East and Africa
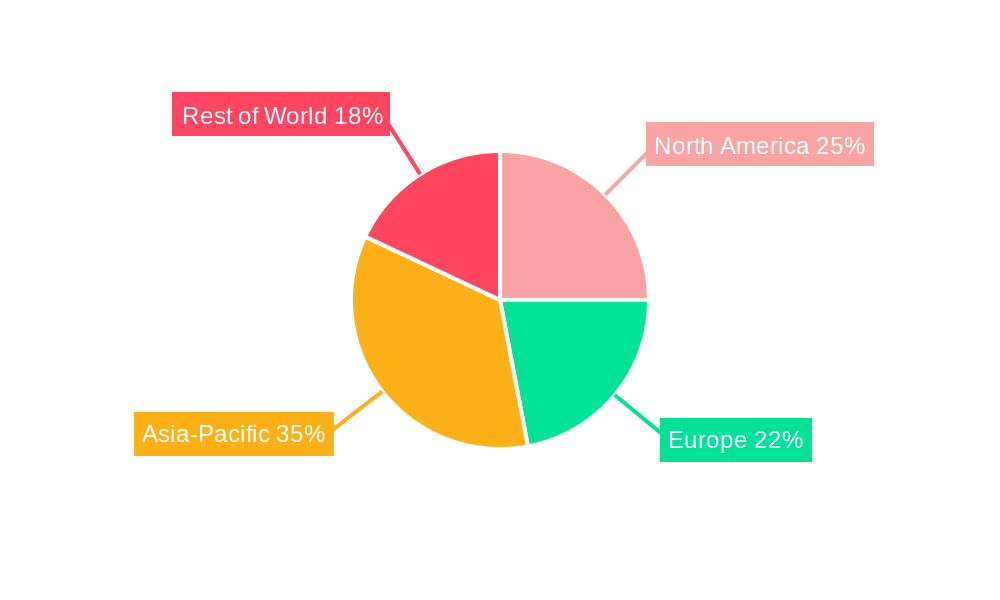
Marine Lubricants Market Regional Market Share
Geographic Coverage of Marine Lubricants Market
Marine Lubricants Market REPORT HIGHLIGHTS
| Aspects | Details |
|---|---|
| Study Period | 2020-2034 |
| Base Year | 2025 |
| Estimated Year | 2026 |
| Forecast Period | 2026-2034 |
| Historical Period | 2020-2025 |
| Growth Rate | CAGR of 4.6% from 2020-2034 |
| Segmentation |
|
Table of Contents
- 1. Introduction
- 1.1. Research Scope
- 1.2. Market Segmentation
- 1.3. Research Objective
- 1.4. Definitions and Assumptions
- 2. Executive Summary
- 2.1. Market Snapshot
- 3. Market Dynamics
- 3.1. Market Drivers
- 3.2. Market Restrains
- 3.3. Market Trends
- 3.4. Market Opportunities
- 4. Market Factor Analysis
- 4.1. Porters Five Forces
- 4.1.1. Bargaining Power of Suppliers
- 4.1.2. Bargaining Power of Buyers
- 4.1.3. Threat of New Entrants
- 4.1.4. Threat of Substitutes
- 4.1.5. Competitive Rivalry
- 4.2. PESTEL analysis
- 4.3. BCG Analysis
- 4.3.1. Stars (High Growth, High Market Share)
- 4.3.2. Cash Cows (Low Growth, High Market Share)
- 4.3.3. Question Mark (High Growth, Low Market Share)
- 4.3.4. Dogs (Low Growth, Low Market Share)
- 4.4. Ansoff Matrix Analysis
- 4.5. Supply Chain Analysis
- 4.6. Regulatory Landscape
- 4.7. Current Market Potential and Opportunity Assessment (TAM–SAM–SOM Framework)
- 4.8. PRI Analyst Note
- 4.1. Porters Five Forces
- 5. Market Analysis, Insights and Forecast 2021-2033
- 5.1. Market Analysis, Insights and Forecast - by Lubricant Type
- 5.1.1. System Oil
- 5.1.2. Marine Cylinder Lubricant
- 5.1.3. Trunk Piston Engine Oil
- 5.1.4. Other Lubricant Types
- 5.2. Market Analysis, Insights and Forecast - by Ship Type
- 5.2.1. Bulker
- 5.2.2. Tanker
- 5.2.3. Container
- 5.2.4. Other Ship Types
- 5.3. Market Analysis, Insights and Forecast - by Region
- 5.3.1. Asia Pacific
- 5.3.2. North America
- 5.3.3. Europe
- 5.3.4. South America
- 5.3.5. Middle East and Africa
- 5.1. Market Analysis, Insights and Forecast - by Lubricant Type
- 6. Global Marine Lubricants Market Analysis, Insights and Forecast, 2021-2033
- 6.1. Market Analysis, Insights and Forecast - by Lubricant Type
- 6.1.1. System Oil
- 6.1.2. Marine Cylinder Lubricant
- 6.1.3. Trunk Piston Engine Oil
- 6.1.4. Other Lubricant Types
- 6.2. Market Analysis, Insights and Forecast - by Ship Type
- 6.2.1. Bulker
- 6.2.2. Tanker
- 6.2.3. Container
- 6.2.4. Other Ship Types
- 6.1. Market Analysis, Insights and Forecast - by Lubricant Type
- 7. Asia Pacific Marine Lubricants Market Analysis, Insights and Forecast, 2020-2032
- 7.1. Market Analysis, Insights and Forecast - by Lubricant Type
- 7.1.1. System Oil
- 7.1.2. Marine Cylinder Lubricant
- 7.1.3. Trunk Piston Engine Oil
- 7.1.4. Other Lubricant Types
- 7.2. Market Analysis, Insights and Forecast - by Ship Type
- 7.2.1. Bulker
- 7.2.2. Tanker
- 7.2.3. Container
- 7.2.4. Other Ship Types
- 7.1. Market Analysis, Insights and Forecast - by Lubricant Type
- 8. North America Marine Lubricants Market Analysis, Insights and Forecast, 2020-2032
- 8.1. Market Analysis, Insights and Forecast - by Lubricant Type
- 8.1.1. System Oil
- 8.1.2. Marine Cylinder Lubricant
- 8.1.3. Trunk Piston Engine Oil
- 8.1.4. Other Lubricant Types
- 8.2. Market Analysis, Insights and Forecast - by Ship Type
- 8.2.1. Bulker
- 8.2.2. Tanker
- 8.2.3. Container
- 8.2.4. Other Ship Types
- 8.1. Market Analysis, Insights and Forecast - by Lubricant Type
- 9. Europe Marine Lubricants Market Analysis, Insights and Forecast, 2020-2032
- 9.1. Market Analysis, Insights and Forecast - by Lubricant Type
- 9.1.1. System Oil
- 9.1.2. Marine Cylinder Lubricant
- 9.1.3. Trunk Piston Engine Oil
- 9.1.4. Other Lubricant Types
- 9.2. Market Analysis, Insights and Forecast - by Ship Type
- 9.2.1. Bulker
- 9.2.2. Tanker
- 9.2.3. Container
- 9.2.4. Other Ship Types
- 9.1. Market Analysis, Insights and Forecast - by Lubricant Type
- 10. South America Marine Lubricants Market Analysis, Insights and Forecast, 2020-2032
- 10.1. Market Analysis, Insights and Forecast - by Lubricant Type
- 10.1.1. System Oil
- 10.1.2. Marine Cylinder Lubricant
- 10.1.3. Trunk Piston Engine Oil
- 10.1.4. Other Lubricant Types
- 10.2. Market Analysis, Insights and Forecast - by Ship Type
- 10.2.1. Bulker
- 10.2.2. Tanker
- 10.2.3. Container
- 10.2.4. Other Ship Types
- 10.1. Market Analysis, Insights and Forecast - by Lubricant Type
- 11. Middle East and Africa Marine Lubricants Market Analysis, Insights and Forecast, 2020-2032
- 11.1. Market Analysis, Insights and Forecast - by Lubricant Type
- 11.1.1. System Oil
- 11.1.2. Marine Cylinder Lubricant
- 11.1.3. Trunk Piston Engine Oil
- 11.1.4. Other Lubricant Types
- 11.2. Market Analysis, Insights and Forecast - by Ship Type
- 11.2.1. Bulker
- 11.2.2. Tanker
- 11.2.3. Container
- 11.2.4. Other Ship Types
- 11.1. Market Analysis, Insights and Forecast - by Lubricant Type
- 12. Competitive Analysis
- 12.1. Company Profiles
- 12.1.1 ADNOC Distribution
- 12.1.1.1. Company Overview
- 12.1.1.2. Products
- 12.1.1.3. Company Financials
- 12.1.1.4. SWOT Analysis
- 12.1.2 BP PLC (Castrol)
- 12.1.2.1. Company Overview
- 12.1.2.2. Products
- 12.1.2.3. Company Financials
- 12.1.2.4. SWOT Analysis
- 12.1.3 Chevron Corporation
- 12.1.3.1. Company Overview
- 12.1.3.2. Products
- 12.1.3.3. Company Financials
- 12.1.3.4. SWOT Analysis
- 12.1.4 China Petrochemical Corporation (SINOPEC)
- 12.1.4.1. Company Overview
- 12.1.4.2. Products
- 12.1.4.3. Company Financials
- 12.1.4.4. SWOT Analysis
- 12.1.5 ENEOS Corporation
- 12.1.5.1. Company Overview
- 12.1.5.2. Products
- 12.1.5.3. Company Financials
- 12.1.5.4. SWOT Analysis
- 12.1.6 Exxon Mobil Corporation
- 12.1.6.1. Company Overview
- 12.1.6.2. Products
- 12.1.6.3. Company Financials
- 12.1.6.4. SWOT Analysis
- 12.1.7 FUCHS
- 12.1.7.1. Company Overview
- 12.1.7.2. Products
- 12.1.7.3. Company Financials
- 12.1.7.4. SWOT Analysis
- 12.1.8 Gazprom Neft PJSC
- 12.1.8.1. Company Overview
- 12.1.8.2. Products
- 12.1.8.3. Company Financials
- 12.1.8.4. SWOT Analysis
- 12.1.9 Gulf Oil International Ltd
- 12.1.9.1. Company Overview
- 12.1.9.2. Products
- 12.1.9.3. Company Financials
- 12.1.9.4. SWOT Analysis
- 12.1.10 Idemitsu Kosan Co Ltd
- 12.1.10.1. Company Overview
- 12.1.10.2. Products
- 12.1.10.3. Company Financials
- 12.1.10.4. SWOT Analysis
- 12.1.11 Indian Oil Corporation Ltd
- 12.1.11.1. Company Overview
- 12.1.11.2. Products
- 12.1.11.3. Company Financials
- 12.1.11.4. SWOT Analysis
- 12.1.12 LUKOIL
- 12.1.12.1. Company Overview
- 12.1.12.2. Products
- 12.1.12.3. Company Financials
- 12.1.12.4. SWOT Analysis
- 12.1.13 Shell PLC
- 12.1.13.1. Company Overview
- 12.1.13.2. Products
- 12.1.13.3. Company Financials
- 12.1.13.4. SWOT Analysis
- 12.1.14 Total Energies SE*List Not Exhaustive
- 12.1.14.1. Company Overview
- 12.1.14.2. Products
- 12.1.14.3. Company Financials
- 12.1.14.4. SWOT Analysis
- 12.1.1 ADNOC Distribution
- 12.2. Market Entropy
- 12.2.1 Company's Key Areas Served
- 12.2.2 Recent Developments
- 12.3. Company Market Share Analysis 2025
- 12.3.1 Top 5 Companies Market Share Analysis
- 12.3.2 Top 3 Companies Market Share Analysis
- 12.4. List of Potential Customers
- 13. Research Methodology
List of Figures
- Figure 1: Global Marine Lubricants Market Revenue Breakdown (million, %) by Region 2025 & 2033
- Figure 2: Asia Pacific Marine Lubricants Market Revenue (million), by Lubricant Type 2025 & 2033
- Figure 3: Asia Pacific Marine Lubricants Market Revenue Share (%), by Lubricant Type 2025 & 2033
- Figure 4: Asia Pacific Marine Lubricants Market Revenue (million), by Ship Type 2025 & 2033
- Figure 5: Asia Pacific Marine Lubricants Market Revenue Share (%), by Ship Type 2025 & 2033
- Figure 6: Asia Pacific Marine Lubricants Market Revenue (million), by Country 2025 & 2033
- Figure 7: Asia Pacific Marine Lubricants Market Revenue Share (%), by Country 2025 & 2033
- Figure 8: North America Marine Lubricants Market Revenue (million), by Lubricant Type 2025 & 2033
- Figure 9: North America Marine Lubricants Market Revenue Share (%), by Lubricant Type 2025 & 2033
- Figure 10: North America Marine Lubricants Market Revenue (million), by Ship Type 2025 & 2033
- Figure 11: North America Marine Lubricants Market Revenue Share (%), by Ship Type 2025 & 2033
- Figure 12: North America Marine Lubricants Market Revenue (million), by Country 2025 & 2033
- Figure 13: North America Marine Lubricants Market Revenue Share (%), by Country 2025 & 2033
- Figure 14: Europe Marine Lubricants Market Revenue (million), by Lubricant Type 2025 & 2033
- Figure 15: Europe Marine Lubricants Market Revenue Share (%), by Lubricant Type 2025 & 2033
- Figure 16: Europe Marine Lubricants Market Revenue (million), by Ship Type 2025 & 2033
- Figure 17: Europe Marine Lubricants Market Revenue Share (%), by Ship Type 2025 & 2033
- Figure 18: Europe Marine Lubricants Market Revenue (million), by Country 2025 & 2033
- Figure 19: Europe Marine Lubricants Market Revenue Share (%), by Country 2025 & 2033
- Figure 20: South America Marine Lubricants Market Revenue (million), by Lubricant Type 2025 & 2033
- Figure 21: South America Marine Lubricants Market Revenue Share (%), by Lubricant Type 2025 & 2033
- Figure 22: South America Marine Lubricants Market Revenue (million), by Ship Type 2025 & 2033
- Figure 23: South America Marine Lubricants Market Revenue Share (%), by Ship Type 2025 & 2033
- Figure 24: South America Marine Lubricants Market Revenue (million), by Country 2025 & 2033
- Figure 25: South America Marine Lubricants Market Revenue Share (%), by Country 2025 & 2033
- Figure 26: Middle East and Africa Marine Lubricants Market Revenue (million), by Lubricant Type 2025 & 2033
- Figure 27: Middle East and Africa Marine Lubricants Market Revenue Share (%), by Lubricant Type 2025 & 2033
- Figure 28: Middle East and Africa Marine Lubricants Market Revenue (million), by Ship Type 2025 & 2033
- Figure 29: Middle East and Africa Marine Lubricants Market Revenue Share (%), by Ship Type 2025 & 2033
- Figure 30: Middle East and Africa Marine Lubricants Market Revenue (million), by Country 2025 & 2033
- Figure 31: Middle East and Africa Marine Lubricants Market Revenue Share (%), by Country 2025 & 2033
List of Tables
- Table 1: Global Marine Lubricants Market Revenue million Forecast, by Lubricant Type 2020 & 2033
- Table 2: Global Marine Lubricants Market Revenue million Forecast, by Ship Type 2020 & 2033
- Table 3: Global Marine Lubricants Market Revenue million Forecast, by Region 2020 & 2033
- Table 4: Global Marine Lubricants Market Revenue million Forecast, by Lubricant Type 2020 & 2033
- Table 5: Global Marine Lubricants Market Revenue million Forecast, by Ship Type 2020 & 2033
- Table 6: Global Marine Lubricants Market Revenue million Forecast, by Country 2020 & 2033
- Table 7: China Marine Lubricants Market Revenue (million) Forecast, by Application 2020 & 2033
- Table 8: India Marine Lubricants Market Revenue (million) Forecast, by Application 2020 & 2033
- Table 9: Japan Marine Lubricants Market Revenue (million) Forecast, by Application 2020 & 2033
- Table 10: South Korea Marine Lubricants Market Revenue (million) Forecast, by Application 2020 & 2033
- Table 11: Malaysia Marine Lubricants Market Revenue (million) Forecast, by Application 2020 & 2033
- Table 12: Thailand Marine Lubricants Market Revenue (million) Forecast, by Application 2020 & 2033
- Table 13: Indonesia Marine Lubricants Market Revenue (million) Forecast, by Application 2020 & 2033
- Table 14: Vietnam Marine Lubricants Market Revenue (million) Forecast, by Application 2020 & 2033
- Table 15: Rest of Asia Pacific Marine Lubricants Market Revenue (million) Forecast, by Application 2020 & 2033
- Table 16: Global Marine Lubricants Market Revenue million Forecast, by Lubricant Type 2020 & 2033
- Table 17: Global Marine Lubricants Market Revenue million Forecast, by Ship Type 2020 & 2033
- Table 18: Global Marine Lubricants Market Revenue million Forecast, by Country 2020 & 2033
- Table 19: United States Marine Lubricants Market Revenue (million) Forecast, by Application 2020 & 2033
- Table 20: Canada Marine Lubricants Market Revenue (million) Forecast, by Application 2020 & 2033
- Table 21: Mexico Marine Lubricants Market Revenue (million) Forecast, by Application 2020 & 2033
- Table 22: Global Marine Lubricants Market Revenue million Forecast, by Lubricant Type 2020 & 2033
- Table 23: Global Marine Lubricants Market Revenue million Forecast, by Ship Type 2020 & 2033
- Table 24: Global Marine Lubricants Market Revenue million Forecast, by Country 2020 & 2033
- Table 25: Germany Marine Lubricants Market Revenue (million) Forecast, by Application 2020 & 2033
- Table 26: United Kingdom Marine Lubricants Market Revenue (million) Forecast, by Application 2020 & 2033
- Table 27: France Marine Lubricants Market Revenue (million) Forecast, by Application 2020 & 2033
- Table 28: Italy Marine Lubricants Market Revenue (million) Forecast, by Application 2020 & 2033
- Table 29: Spain Marine Lubricants Market Revenue (million) Forecast, by Application 2020 & 2033
- Table 30: NORDIC Countries Marine Lubricants Market Revenue (million) Forecast, by Application 2020 & 2033
- Table 31: Turkey Marine Lubricants Market Revenue (million) Forecast, by Application 2020 & 2033
- Table 32: Russia Marine Lubricants Market Revenue (million) Forecast, by Application 2020 & 2033
- Table 33: Rest of Europe Marine Lubricants Market Revenue (million) Forecast, by Application 2020 & 2033
- Table 34: Global Marine Lubricants Market Revenue million Forecast, by Lubricant Type 2020 & 2033
- Table 35: Global Marine Lubricants Market Revenue million Forecast, by Ship Type 2020 & 2033
- Table 36: Global Marine Lubricants Market Revenue million Forecast, by Country 2020 & 2033
- Table 37: Brazil Marine Lubricants Market Revenue (million) Forecast, by Application 2020 & 2033
- Table 38: Argentina Marine Lubricants Market Revenue (million) Forecast, by Application 2020 & 2033
- Table 39: Colombia Marine Lubricants Market Revenue (million) Forecast, by Application 2020 & 2033
- Table 40: Rest of South America Marine Lubricants Market Revenue (million) Forecast, by Application 2020 & 2033
- Table 41: Global Marine Lubricants Market Revenue million Forecast, by Lubricant Type 2020 & 2033
- Table 42: Global Marine Lubricants Market Revenue million Forecast, by Ship Type 2020 & 2033
- Table 43: Global Marine Lubricants Market Revenue million Forecast, by Country 2020 & 2033
- Table 44: Saudi Arabia Marine Lubricants Market Revenue (million) Forecast, by Application 2020 & 2033
- Table 45: Qatar Marine Lubricants Market Revenue (million) Forecast, by Application 2020 & 2033
- Table 46: United Arab Emirates Marine Lubricants Market Revenue (million) Forecast, by Application 2020 & 2033
- Table 47: Nigeria Marine Lubricants Market Revenue (million) Forecast, by Application 2020 & 2033
- Table 48: Egypt Marine Lubricants Market Revenue (million) Forecast, by Application 2020 & 2033
- Table 49: South Africa Marine Lubricants Market Revenue (million) Forecast, by Application 2020 & 2033
- Table 50: Rest of Middle East and Africa Marine Lubricants Market Revenue (million) Forecast, by Application 2020 & 2033
Frequently Asked Questions
1. What is the projected Compound Annual Growth Rate (CAGR) of the Marine Lubricants Market?
The projected CAGR is approximately 4.6%.
2. Which companies are prominent players in the Marine Lubricants Market?
Key companies in the market include ADNOC Distribution, BP PLC (Castrol), Chevron Corporation, China Petrochemical Corporation (SINOPEC), ENEOS Corporation, Exxon Mobil Corporation, FUCHS, Gazprom Neft PJSC, Gulf Oil International Ltd, Idemitsu Kosan Co Ltd, Indian Oil Corporation Ltd, LUKOIL, Shell PLC, Total Energies SE*List Not Exhaustive.
3. What are the main segments of the Marine Lubricants Market?
The market segments include Lubricant Type, Ship Type.
4. Can you provide details about the market size?
The market size is estimated to be USD 8368.1 million as of 2022.
5. What are some drivers contributing to market growth?
Rising Demand for Marine Transport; Growing Shipbuilding Activities; Other Drivers.
6. What are the notable trends driving market growth?
Marine Cylinder Lubricant Segment is Expected to Dominate the Market.
7. Are there any restraints impacting market growth?
Rising Demand for Marine Transport; Growing Shipbuilding Activities; Other Drivers.
8. Can you provide examples of recent developments in the market?
April 2024: AD Ports Group, a key player in global trade, logistics, and industry, revealed that its Ports Cluster was broadening its scope to include the worldwide distribution of marine lubricants. This move follows a strategic partnership formed with ADNOC Distribution, the foremost manufacturer of marine and automotive lubricants in the United Arab Emirates. As per the agreement, Ports Cluster will utilize its established connections and state-of-the-art infrastructure to distribute globally recognized lubricants to customers in the United Arab Emirates. It plans to widen this distribution network globally.March 2023: Castrol unveiled its latest offering: the marine cylinder oil, Castrol Cyltech 40 XDC (eXtra Deposit Control). This new oil is designed for LNG and methanol-fueled vessels but is equally compatible with ships utilizing traditional marine fuels. The introduction of Castrol Cyltech 40 XDC underscores Castrol's dedication to aiding the marine sector's shift toward cleaner fuels and advanced engine technologies while guaranteeing optimal engine performance and reliability.February 2023: Luberef, a subsidiary of Saudi Aramco, revealed plans to expand its base oil plant in Yanbu' al Bahr, Saudi Arabia, boosting its capacity by 230,000 metric tons annually. The project will upgrade the facility, allowing it to produce API Group III base stocks. The expansion will elevate the Yanbu plant to a size nearly matching that of the Pearl gas-to-liquids joint venture, the largest base oil plant in the Middle East.
9. What pricing options are available for accessing the report?
Pricing options include single-user, multi-user, and enterprise licenses priced at USD 4750, USD 5250, and USD 8750 respectively.
10. Is the market size provided in terms of value or volume?
The market size is provided in terms of value, measured in million.
11. Are there any specific market keywords associated with the report?
Yes, the market keyword associated with the report is "Marine Lubricants Market," which aids in identifying and referencing the specific market segment covered.
12. How do I determine which pricing option suits my needs best?
The pricing options vary based on user requirements and access needs. Individual users may opt for single-user licenses, while businesses requiring broader access may choose multi-user or enterprise licenses for cost-effective access to the report.
13. Are there any additional resources or data provided in the Marine Lubricants Market report?
While the report offers comprehensive insights, it's advisable to review the specific contents or supplementary materials provided to ascertain if additional resources or data are available.
14. How can I stay updated on further developments or reports in the Marine Lubricants Market?
To stay informed about further developments, trends, and reports in the Marine Lubricants Market, consider subscribing to industry newsletters, following relevant companies and organizations, or regularly checking reputable industry news sources and publications.
Methodology
Step 1 - Identification of Relevant Samples Size from Population Database


Step 2 - Approaches for Defining Global Market Size (Value, Volume* & Price*)

Note*: In applicable scenarios
Step 3 - Data Sources
Primary Research
- Web Analytics
- Survey Reports
- Research Institute
- Latest Research Reports
- Opinion Leaders
Secondary Research
- Annual Reports
- White Paper
- Latest Press Release
- Industry Association
- Paid Database
- Investor Presentations

Step 4 - Data Triangulation
Involves using different sources of information in order to increase the validity of a study
These sources are likely to be stakeholders in a program - participants, other researchers, program staff, other community members, and so on.
Then we put all data in single framework & apply various statistical tools to find out the dynamic on the market.
During the analysis stage, feedback from the stakeholder groups would be compared to determine areas of agreement as well as areas of divergence