

Key Insights
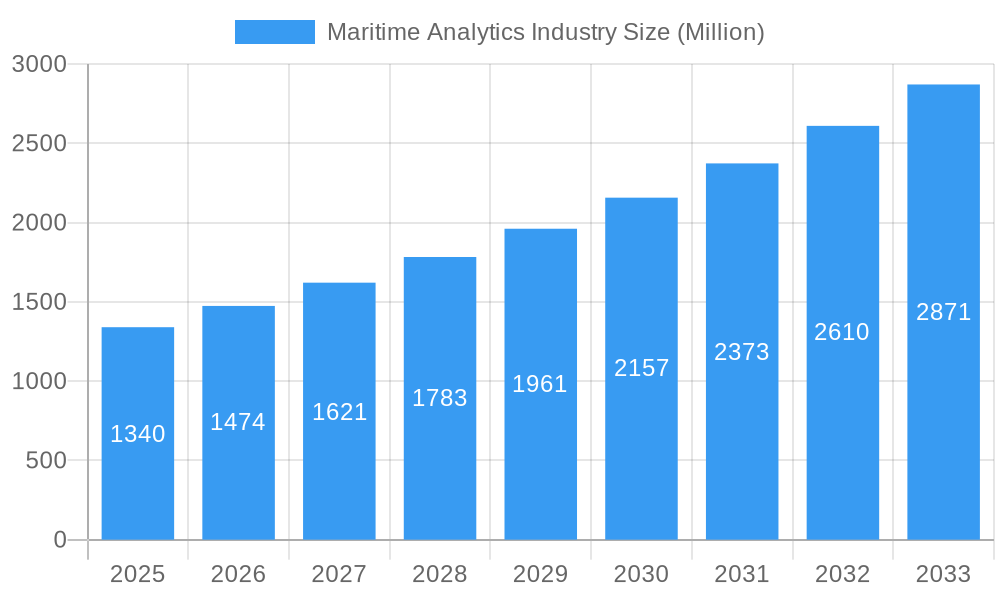
The Maritime Analytics Industry is poised for substantial growth, projected to reach a market size of USD 1.34 Billion by 2025, with an impressive Compound Annual Growth Rate (CAGR) of 10.01% over the forecast period of 2025-2033. This robust expansion is primarily fueled by the increasing adoption of digital technologies within the maritime sector, driven by the imperative for enhanced operational efficiency, cost reduction, and improved safety standards. Key applications such as predictive and prescriptive maintenance are gaining significant traction as companies seek to minimize downtime and optimize vessel performance. Similarly, advancements in voyage operations analytics are enabling more efficient route planning and fuel consumption management. The growing complexity of global trade and the need for real-time insights into fleet movements further bolster the demand for sophisticated maritime analytics solutions.
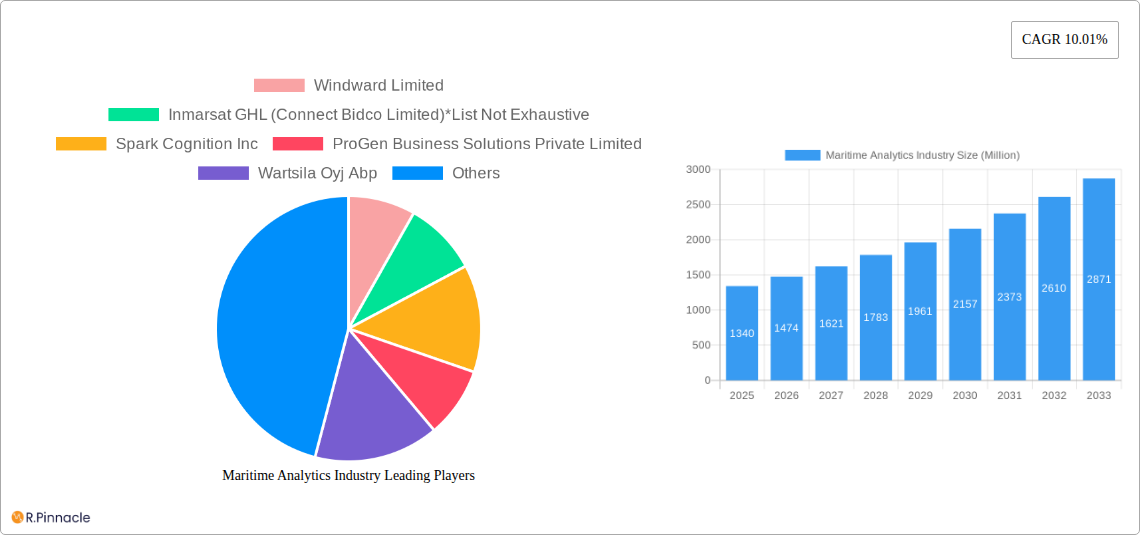
Maritime Analytics Industry Market Size (In Billion)
Several critical trends are shaping the trajectory of the Maritime Analytics Industry. The integration of Artificial Intelligence (AI) and Machine Learning (ML) is paramount, allowing for more accurate forecasting and data-driven decision-making. The rise of the Internet of Things (IoT) in shipping, with the proliferation of sensors on vessels, is generating vast amounts of data that analytics platforms can leverage. Furthermore, increasing regulatory scrutiny concerning emissions and environmental impact is compelling stakeholders to adopt analytics for better compliance and sustainability reporting. While the industry benefits from these drivers, challenges such as data security concerns, the need for skilled personnel to interpret complex data, and the initial investment costs for advanced analytics infrastructure present potential restraints. However, the overarching benefits of enhanced safety, reduced operational costs, and improved overall fleet management are expected to outweigh these limitations, driving sustained market expansion across government and commercial sectors.
Maritime Analytics Industry Company Market Share
Maritime Analytics Industry: Revolutionizing Global Shipping with Data-Driven Insights - Comprehensive Market Report 2024-2033
This in-depth report delivers unparalleled insights into the burgeoning Maritime Analytics Industry. Explore how cutting-edge technologies and big data analytics are transforming ship operations, fleet management, and predictive maintenance across the global maritime sector. Gain a competitive edge by understanding market dynamics, innovation trends, key growth drivers, and future outlook, all backed by robust data and expert analysis. This report is an essential resource for shipping companies, technology providers, investors, and industry stakeholders seeking to navigate the complexities and capitalize on the immense opportunities within this rapidly evolving market.
Maritime Analytics Industry Market Structure & Innovation Trends
The Maritime Analytics Industry exhibits a moderately concentrated market structure, with a growing number of specialized players focusing on enhancing operational efficiency and safety at sea. Key innovation drivers include the relentless pursuit of fuel optimization, emission reduction, and the increasing adoption of IoT sensors and AI algorithms for real-time data processing. Regulatory frameworks, such as the IMO's decarbonization targets, are acting as significant catalysts for innovation, pushing companies to invest in advanced analytical solutions. Product substitutes are gradually emerging, including manual tracking and basic reporting, but the superior insights and automation offered by maritime analytics are quickly rendering them obsolete. End-user demographics are diverse, spanning commercial shipping lines, government maritime agencies, and offshore industries, all seeking to leverage data for improved decision-making. Mergers and acquisitions (M&A) activities are on the rise as larger corporations aim to integrate specialized analytical capabilities, with estimated M&A deal values in the tens to hundreds of millions of dollars, indicating consolidation and strategic expansion within the sector.
Maritime Analytics Industry Market Dynamics & Trends
The Maritime Analytics Industry is poised for substantial growth, driven by a confluence of technological advancements, evolving consumer preferences for sustainable shipping, and intense competitive dynamics. The projected Compound Annual Growth Rate (CAGR) for this market is estimated at an impressive XX%, reflecting the increasing penetration of digital solutions across the maritime value chain. Technological disruptions are at the forefront, with the integration of artificial intelligence (AI), machine learning (ML), and blockchain technology revolutionizing how data is collected, analyzed, and utilized. These advancements enable sophisticated functionalities such as predictive maintenance, optimizing vessel performance to prevent costly breakdowns and minimize downtime. Furthermore, the growing imperative for environmental sustainability is a significant market driver. Shipping operators are increasingly adopting analytics to monitor and reduce carbon emissions, comply with stringent regulations, and enhance their corporate social responsibility profiles. This shift is directly influencing consumer preferences, with charterers and cargo owners favoring shipping lines that demonstrate a commitment to eco-efficient operations. Competitive dynamics are characterized by a mix of established maritime technology providers and agile startups, all vying to offer the most comprehensive and actionable insights. The market penetration of advanced maritime analytics is expected to accelerate as more businesses recognize the tangible benefits in terms of cost savings, improved safety, and enhanced operational visibility. The global adoption of advanced analytics is moving beyond basic data logging to sophisticated prescriptive analytics, guiding operators on the best course of action to achieve optimal outcomes.
Dominant Regions & Segments in Maritime Analytics Industry
The Maritime Analytics Industry is experiencing significant growth across various regions and segments, with a discernible dominance in key areas.
Dominant Region: Europe
Europe stands as a leading region in the adoption and development of maritime analytics. This dominance is fueled by:
- Strong Regulatory Push: The European Union's stringent environmental regulations, such as the European Green Deal, are compelling shipping companies to invest in analytics for emission monitoring and reduction.
- Established Maritime Hubs: Major maritime nations like Norway, Denmark, and the UK possess a high concentration of shipping companies, port authorities, and technology developers, fostering a robust ecosystem for maritime analytics.
- Technological Innovation: Significant investment in R&D for smart shipping and digitalization in the region has led to the development of pioneering analytical solutions.
- Infrastructure Development: Advanced port infrastructure and a strong network of maritime service providers facilitate the seamless integration and deployment of analytics platforms.
Dominant Segment by Application: Predictive and Prescriptive Maintenance
Within the application segments, Predictive and Prescriptive Maintenance holds a dominant position. Key drivers include:
- Cost Reduction: Proactive identification of potential equipment failures through predictive analytics significantly reduces costly unscheduled repairs and downtime.
- Enhanced Safety: Preventing equipment malfunctions directly contributes to improved vessel safety and reduces the risk of accidents.
- Asset Lifespan Extension: Optimizing maintenance schedules based on actual asset condition extends the operational life of critical ship components.
- Operational Efficiency: Minimizing disruptions caused by breakdowns ensures smoother voyage operations and adherence to schedules.
Dominant Segment by End-User: Commercial
The Commercial end-user segment represents the largest market share. This is driven by:
- Profitability Focus: Commercial shipping lines are acutely focused on optimizing profitability through cost savings, efficiency gains, and improved revenue generation.
- Competitive Pressure: Intense competition necessitates the adoption of advanced technologies to gain a competitive edge and offer superior services.
- Scale of Operations: Large commercial fleets generate vast amounts of data, making them prime candidates for analytics solutions that can manage and leverage this data effectively.
- Demand for Transparency: Charterers and cargo owners are increasingly demanding greater transparency and predictability in shipping operations, pushing commercial operators to adopt advanced analytics.
Maritime Analytics Industry Product Innovations
Product innovations in the Maritime Analytics Industry are centered on delivering actionable insights for enhanced operational efficiency, safety, and sustainability. Companies are developing sophisticated platforms that integrate AI and ML to provide predictive maintenance alerts, optimize voyage planning for fuel efficiency, and offer comprehensive fleet management dashboards. The competitive advantage lies in the ability to process diverse data streams – from sensor data and AIS to weather forecasts – into real-time, user-friendly intelligence. These innovations are crucial for meeting the growing demand for greener and more cost-effective shipping solutions, making them highly relevant to market needs.
Report Scope & Segmentation Analysis
This report meticulously analyzes the Maritime Analytics Industry across key segmentation parameters.
Application:
- Predictive and Prescriptive Maintenance: This segment is expected to witness significant growth, driven by the industry's focus on reducing operational costs and minimizing vessel downtime. Growth projections are robust, with an estimated market size of $XXX million in 2025, expanding to $XXX million by 2033. Competitive dynamics are intense, with players offering advanced AI-driven solutions.
- Voyage Operations: This segment focuses on optimizing routes, speed, and fuel consumption. Its market size is projected to reach $XXX million in 2025 and grow to $XXX million by 2033. Key competitive advantages lie in real-time weather data integration and AI-powered route optimization.
- Fleet Management: Encompassing the broader management of multiple vessels, this segment is crucial for large shipping operators. Market size is estimated at $XXX million in 2025, expected to reach $XXX million by 2033. Competition revolves around comprehensive dashboarding and performance tracking.
- Other Applications: This category includes niche areas like cargo tracking, compliance management, and risk assessment, with an estimated market size of $XXX million in 2025, growing to $XXX million by 2033.
End-User:
- Government: This segment includes defense, coast guard, and port authorities. Its market size is projected at $XXX million in 2025 and is expected to reach $XXX million by 2033, driven by national security and maritime surveillance needs.
- Commercial: As the largest segment, commercial shipping lines are heavily investing in analytics for profitability and efficiency. The market size is estimated at $XXX million in 2025, projected to reach $XXX million by 2033. Competitive dynamics are fierce, with a focus on ROI and operational excellence.
Key Drivers of Maritime Analytics Industry Growth
The growth of the Maritime Analytics Industry is propelled by several interconnected factors. Technological advancements, particularly in AI, ML, and IoT, are enabling the collection and analysis of vast amounts of data, leading to more sophisticated insights. Economic factors such as the increasing cost of fuel and the pressure to improve operational efficiency are compelling companies to adopt data-driven solutions. Furthermore, regulatory frameworks promoting sustainability, such as stricter emission standards and decarbonization targets, are creating a strong demand for analytics that can monitor and reduce environmental impact. For instance, the International Maritime Organization's (IMO) greenhouse gas reduction strategy is a significant catalyst. The drive for enhanced safety and security at sea, coupled with the increasing complexity of global supply chains, also necessitates advanced analytical capabilities for better risk management and operational resilience.
Challenges in the Maritime Analytics Industry Sector
Despite its promising growth, the Maritime Analytics Industry faces several significant challenges. Data integration and standardization remain a hurdle, as disparate systems and formats can complicate the creation of a unified analytical view. Cybersecurity concerns are paramount, given the sensitive nature of operational data and the increasing interconnectedness of maritime assets. The initial investment cost for advanced analytics solutions can be substantial, posing a barrier for smaller shipping companies. Additionally, a shortage of skilled personnel with expertise in data science and maritime operations can hinder the effective implementation and utilization of these technologies. Resistance to change within traditional maritime organizations and the need for robust regulatory clarity on data usage and privacy also present ongoing challenges.
Emerging Opportunities in Maritime Analytics Industry
The Maritime Analytics Industry is ripe with emerging opportunities. The increasing focus on decarbonization and environmental, social, and governance (ESG) compliance presents a significant avenue for growth, with analytics playing a crucial role in emissions monitoring and reporting. The development of digital twins for vessels and port operations offers a powerful tool for simulation, optimization, and training. The expansion of autonomous shipping will necessitate advanced analytical capabilities for decision-making and remote operations. Furthermore, the integration of blockchain technology offers opportunities for enhanced transparency, security, and traceability in supply chains. The growing demand for smart ports and intermodal connectivity will also drive the need for integrated maritime analytics solutions across the entire logistics network.
Leading Players in the Maritime Analytics Industry Market
- Windward Limited
- Inmarsat GHL (Connect Bidco Limited)
- Spark Cognition Inc
- ProGen Business Solutions Private Limited
- Wartsila Oyj Abp
- Amplify Mindware Private Limited
- ABB Limited
- Prisma Electronics SA (Laros)
- U-Ming Marine Transport Corporation
- Spire Global Inc
Key Developments in Maritime Analytics Industry Industry
- May 2022: Wartsila has developed and received orders for 70 vessels, with this number continuing to rise. The company commands over 20% market share and has installed batteries exceeding 100 MWh, highlighting advancements in hybrid vessel technology which merges engines and batteries for enhanced sophistication over purely diesel-mechanical or electric systems.
- March 2022: U-Ming Marine Transport Corporation's post-Panamax bulk carrier, M.V. Cemtex Excellence (99,990 DWT), built by Oshima Shipbuilding Co., Ltd. under a contract with Japan's Sumitomo Marine Co. Ltd., features high-end eco-efficient systems and an upgraded digital operating system, significantly boosting its operational effectiveness and safety.
- January 2022: NAVTOR acquired Ingenium Marine, integrating its digital logbooks into NAVTOR's e-Navigation and performance suite. This acquisition followed NAVTOR's earlier purchase of US-based vessel analytics specialist Tres Solutions in 2021, demonstrating a strategic move to consolidate digital solutions for enhanced vessel performance.
Future Outlook for Maritime Analytics Industry Market
The future outlook for the Maritime Analytics Industry is exceptionally positive, characterized by sustained growth and transformative innovation. Expect accelerated adoption of AI and ML for predictive and prescriptive capabilities, leading to highly optimized vessel performance and unprecedented cost savings. The industry will increasingly focus on sustainability, with analytics playing a pivotal role in achieving decarbonization targets and promoting environmentally friendly shipping practices. The development of autonomous systems and digital twins will further revolutionize vessel operations and management. Strategic partnerships and consolidations are anticipated, creating more comprehensive and integrated solutions. As the global maritime sector continues to embrace digitalization, maritime analytics will remain an indispensable tool for ensuring competitiveness, safety, and environmental stewardship.
Maritime Analytics Industry Segmentation
-
1. Application
- 1.1. Predictive and Prescriptive Maintenance
- 1.2. Voyage Operations
- 1.3. Fleet Management
- 1.4. Other Applications
-
2. End-User
- 2.1. Government
- 2.2. Commercial
Maritime Analytics Industry Segmentation By Geography
- 1. North America
- 2. Europe
- 3. Asia Pacific
- 4. Rest of the World
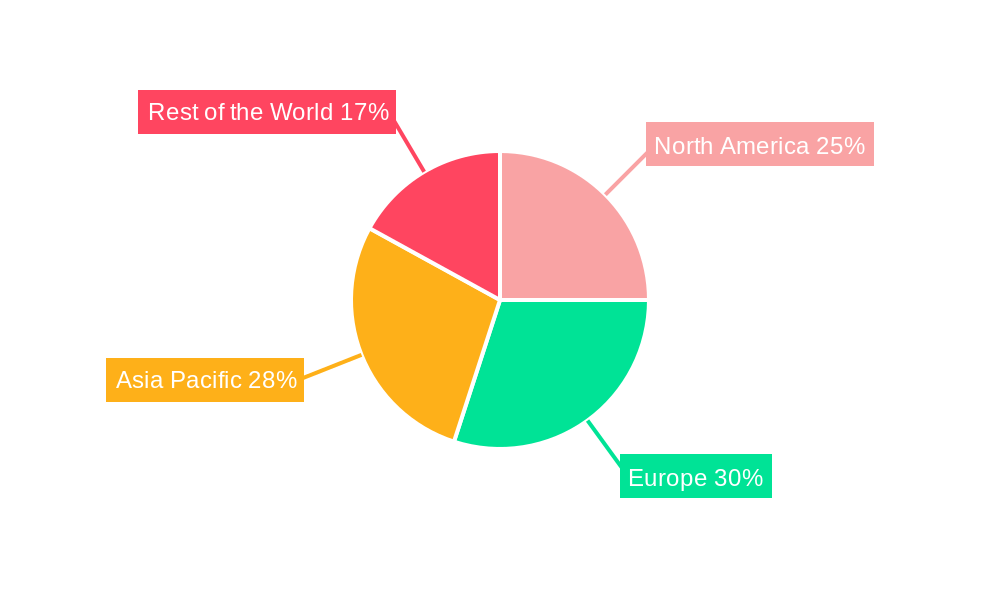
Maritime Analytics Industry Regional Market Share
Geographic Coverage of Maritime Analytics Industry
Maritime Analytics Industry REPORT HIGHLIGHTS
| Aspects | Details |
|---|---|
| Study Period | 2020-2034 |
| Base Year | 2025 |
| Estimated Year | 2026 |
| Forecast Period | 2026-2034 |
| Historical Period | 2020-2025 |
| Growth Rate | CAGR of 10.01% from 2020-2034 |
| Segmentation |
|
Table of Contents
- 1. Introduction
- 1.1. Research Scope
- 1.2. Market Segmentation
- 1.3. Research Objective
- 1.4. Definitions and Assumptions
- 2. Executive Summary
- 2.1. Market Snapshot
- 3. Market Dynamics
- 3.1. Market Drivers
- 3.2. Market Restrains
- 3.3. Market Trends
- 3.4. Market Opportunities
- 4. Market Factor Analysis
- 4.1. Porters Five Forces
- 4.1.1. Bargaining Power of Suppliers
- 4.1.2. Bargaining Power of Buyers
- 4.1.3. Threat of New Entrants
- 4.1.4. Threat of Substitutes
- 4.1.5. Competitive Rivalry
- 4.2. PESTEL analysis
- 4.3. BCG Analysis
- 4.3.1. Stars (High Growth, High Market Share)
- 4.3.2. Cash Cows (Low Growth, High Market Share)
- 4.3.3. Question Mark (High Growth, Low Market Share)
- 4.3.4. Dogs (Low Growth, Low Market Share)
- 4.4. Ansoff Matrix Analysis
- 4.5. Supply Chain Analysis
- 4.6. Regulatory Landscape
- 4.7. Current Market Potential and Opportunity Assessment (TAM–SAM–SOM Framework)
- 4.8. PRI Analyst Note
- 4.1. Porters Five Forces
- 5. Market Analysis, Insights and Forecast 2021-2033
- 5.1. Market Analysis, Insights and Forecast - by Application
- 5.1.1. Predictive and Prescriptive Maintenance
- 5.1.2. Voyage Operations
- 5.1.3. Fleet Management
- 5.1.4. Other Applications
- 5.2. Market Analysis, Insights and Forecast - by End-User
- 5.2.1. Government
- 5.2.2. Commercial
- 5.3. Market Analysis, Insights and Forecast - by Region
- 5.3.1. North America
- 5.3.2. Europe
- 5.3.3. Asia Pacific
- 5.3.4. Rest of the World
- 5.1. Market Analysis, Insights and Forecast - by Application
- 6. Global Maritime Analytics Industry Analysis, Insights and Forecast, 2021-2033
- 6.1. Market Analysis, Insights and Forecast - by Application
- 6.1.1. Predictive and Prescriptive Maintenance
- 6.1.2. Voyage Operations
- 6.1.3. Fleet Management
- 6.1.4. Other Applications
- 6.2. Market Analysis, Insights and Forecast - by End-User
- 6.2.1. Government
- 6.2.2. Commercial
- 6.1. Market Analysis, Insights and Forecast - by Application
- 7. North America Maritime Analytics Industry Analysis, Insights and Forecast, 2020-2032
- 7.1. Market Analysis, Insights and Forecast - by Application
- 7.1.1. Predictive and Prescriptive Maintenance
- 7.1.2. Voyage Operations
- 7.1.3. Fleet Management
- 7.1.4. Other Applications
- 7.2. Market Analysis, Insights and Forecast - by End-User
- 7.2.1. Government
- 7.2.2. Commercial
- 7.1. Market Analysis, Insights and Forecast - by Application
- 8. Europe Maritime Analytics Industry Analysis, Insights and Forecast, 2020-2032
- 8.1. Market Analysis, Insights and Forecast - by Application
- 8.1.1. Predictive and Prescriptive Maintenance
- 8.1.2. Voyage Operations
- 8.1.3. Fleet Management
- 8.1.4. Other Applications
- 8.2. Market Analysis, Insights and Forecast - by End-User
- 8.2.1. Government
- 8.2.2. Commercial
- 8.1. Market Analysis, Insights and Forecast - by Application
- 9. Asia Pacific Maritime Analytics Industry Analysis, Insights and Forecast, 2020-2032
- 9.1. Market Analysis, Insights and Forecast - by Application
- 9.1.1. Predictive and Prescriptive Maintenance
- 9.1.2. Voyage Operations
- 9.1.3. Fleet Management
- 9.1.4. Other Applications
- 9.2. Market Analysis, Insights and Forecast - by End-User
- 9.2.1. Government
- 9.2.2. Commercial
- 9.1. Market Analysis, Insights and Forecast - by Application
- 10. Rest of the World Maritime Analytics Industry Analysis, Insights and Forecast, 2020-2032
- 10.1. Market Analysis, Insights and Forecast - by Application
- 10.1.1. Predictive and Prescriptive Maintenance
- 10.1.2. Voyage Operations
- 10.1.3. Fleet Management
- 10.1.4. Other Applications
- 10.2. Market Analysis, Insights and Forecast - by End-User
- 10.2.1. Government
- 10.2.2. Commercial
- 10.1. Market Analysis, Insights and Forecast - by Application
- 11. Competitive Analysis
- 11.1. Company Profiles
- 11.1.1 Windward Limited
- 11.1.1.1. Company Overview
- 11.1.1.2. Products
- 11.1.1.3. Company Financials
- 11.1.1.4. SWOT Analysis
- 11.1.2 Inmarsat GHL (Connect Bidco Limited)*List Not Exhaustive
- 11.1.2.1. Company Overview
- 11.1.2.2. Products
- 11.1.2.3. Company Financials
- 11.1.2.4. SWOT Analysis
- 11.1.3 Spark Cognition Inc
- 11.1.3.1. Company Overview
- 11.1.3.2. Products
- 11.1.3.3. Company Financials
- 11.1.3.4. SWOT Analysis
- 11.1.4 ProGen Business Solutions Private Limited
- 11.1.4.1. Company Overview
- 11.1.4.2. Products
- 11.1.4.3. Company Financials
- 11.1.4.4. SWOT Analysis
- 11.1.5 Wartsila Oyj Abp
- 11.1.5.1. Company Overview
- 11.1.5.2. Products
- 11.1.5.3. Company Financials
- 11.1.5.4. SWOT Analysis
- 11.1.6 Amplify Mindware Private Limited
- 11.1.6.1. Company Overview
- 11.1.6.2. Products
- 11.1.6.3. Company Financials
- 11.1.6.4. SWOT Analysis
- 11.1.7 ABB Limited
- 11.1.7.1. Company Overview
- 11.1.7.2. Products
- 11.1.7.3. Company Financials
- 11.1.7.4. SWOT Analysis
- 11.1.8 Prisma Electronics SA (Laros)
- 11.1.8.1. Company Overview
- 11.1.8.2. Products
- 11.1.8.3. Company Financials
- 11.1.8.4. SWOT Analysis
- 11.1.9 U-Ming Marine Transport Corporation
- 11.1.9.1. Company Overview
- 11.1.9.2. Products
- 11.1.9.3. Company Financials
- 11.1.9.4. SWOT Analysis
- 11.1.10 Spire Global Inc
- 11.1.10.1. Company Overview
- 11.1.10.2. Products
- 11.1.10.3. Company Financials
- 11.1.10.4. SWOT Analysis
- 11.1.1 Windward Limited
- 11.2. Market Entropy
- 11.2.1 Company's Key Areas Served
- 11.2.2 Recent Developments
- 11.3. Company Market Share Analysis 2025
- 11.3.1 Top 5 Companies Market Share Analysis
- 11.3.2 Top 3 Companies Market Share Analysis
- 11.4. List of Potential Customers
- 12. Research Methodology
List of Figures
- Figure 1: Global Maritime Analytics Industry Revenue Breakdown (Million, %) by Region 2025 & 2033
- Figure 2: North America Maritime Analytics Industry Revenue (Million), by Application 2025 & 2033
- Figure 3: North America Maritime Analytics Industry Revenue Share (%), by Application 2025 & 2033
- Figure 4: North America Maritime Analytics Industry Revenue (Million), by End-User 2025 & 2033
- Figure 5: North America Maritime Analytics Industry Revenue Share (%), by End-User 2025 & 2033
- Figure 6: North America Maritime Analytics Industry Revenue (Million), by Country 2025 & 2033
- Figure 7: North America Maritime Analytics Industry Revenue Share (%), by Country 2025 & 2033
- Figure 8: Europe Maritime Analytics Industry Revenue (Million), by Application 2025 & 2033
- Figure 9: Europe Maritime Analytics Industry Revenue Share (%), by Application 2025 & 2033
- Figure 10: Europe Maritime Analytics Industry Revenue (Million), by End-User 2025 & 2033
- Figure 11: Europe Maritime Analytics Industry Revenue Share (%), by End-User 2025 & 2033
- Figure 12: Europe Maritime Analytics Industry Revenue (Million), by Country 2025 & 2033
- Figure 13: Europe Maritime Analytics Industry Revenue Share (%), by Country 2025 & 2033
- Figure 14: Asia Pacific Maritime Analytics Industry Revenue (Million), by Application 2025 & 2033
- Figure 15: Asia Pacific Maritime Analytics Industry Revenue Share (%), by Application 2025 & 2033
- Figure 16: Asia Pacific Maritime Analytics Industry Revenue (Million), by End-User 2025 & 2033
- Figure 17: Asia Pacific Maritime Analytics Industry Revenue Share (%), by End-User 2025 & 2033
- Figure 18: Asia Pacific Maritime Analytics Industry Revenue (Million), by Country 2025 & 2033
- Figure 19: Asia Pacific Maritime Analytics Industry Revenue Share (%), by Country 2025 & 2033
- Figure 20: Rest of the World Maritime Analytics Industry Revenue (Million), by Application 2025 & 2033
- Figure 21: Rest of the World Maritime Analytics Industry Revenue Share (%), by Application 2025 & 2033
- Figure 22: Rest of the World Maritime Analytics Industry Revenue (Million), by End-User 2025 & 2033
- Figure 23: Rest of the World Maritime Analytics Industry Revenue Share (%), by End-User 2025 & 2033
- Figure 24: Rest of the World Maritime Analytics Industry Revenue (Million), by Country 2025 & 2033
- Figure 25: Rest of the World Maritime Analytics Industry Revenue Share (%), by Country 2025 & 2033
List of Tables
- Table 1: Global Maritime Analytics Industry Revenue Million Forecast, by Application 2020 & 2033
- Table 2: Global Maritime Analytics Industry Revenue Million Forecast, by End-User 2020 & 2033
- Table 3: Global Maritime Analytics Industry Revenue Million Forecast, by Region 2020 & 2033
- Table 4: Global Maritime Analytics Industry Revenue Million Forecast, by Application 2020 & 2033
- Table 5: Global Maritime Analytics Industry Revenue Million Forecast, by End-User 2020 & 2033
- Table 6: Global Maritime Analytics Industry Revenue Million Forecast, by Country 2020 & 2033
- Table 7: Global Maritime Analytics Industry Revenue Million Forecast, by Application 2020 & 2033
- Table 8: Global Maritime Analytics Industry Revenue Million Forecast, by End-User 2020 & 2033
- Table 9: Global Maritime Analytics Industry Revenue Million Forecast, by Country 2020 & 2033
- Table 10: Global Maritime Analytics Industry Revenue Million Forecast, by Application 2020 & 2033
- Table 11: Global Maritime Analytics Industry Revenue Million Forecast, by End-User 2020 & 2033
- Table 12: Global Maritime Analytics Industry Revenue Million Forecast, by Country 2020 & 2033
- Table 13: Global Maritime Analytics Industry Revenue Million Forecast, by Application 2020 & 2033
- Table 14: Global Maritime Analytics Industry Revenue Million Forecast, by End-User 2020 & 2033
- Table 15: Global Maritime Analytics Industry Revenue Million Forecast, by Country 2020 & 2033
Frequently Asked Questions
1. What is the projected Compound Annual Growth Rate (CAGR) of the Maritime Analytics Industry?
The projected CAGR is approximately 10.01%.
2. Which companies are prominent players in the Maritime Analytics Industry?
Key companies in the market include Windward Limited, Inmarsat GHL (Connect Bidco Limited)*List Not Exhaustive, Spark Cognition Inc, ProGen Business Solutions Private Limited, Wartsila Oyj Abp, Amplify Mindware Private Limited, ABB Limited, Prisma Electronics SA (Laros), U-Ming Marine Transport Corporation, Spire Global Inc.
3. What are the main segments of the Maritime Analytics Industry?
The market segments include Application, End-User.
4. Can you provide details about the market size?
The market size is estimated to be USD 1.34 Million as of 2022.
5. What are some drivers contributing to market growth?
Increasing Penetration of Digitization in the Maritime Industry; Increase in Seaborne Trade.
6. What are the notable trends driving market growth?
Government Segment is Expected to Drive the Market.
7. Are there any restraints impacting market growth?
High Installation Cost; Lack of Uninterrupted and Seamless Internet Connectivity.
8. Can you provide examples of recent developments in the market?
May 2022 - Wartsila had developed and received orders for 70 vessels, and this number is still rising. The company currently holds a market share of over 20% and has installed batteries with a combined capacity that exceeds 100 MWh. Hybrid vessels are more sophisticated than diesel-mechanical or fully electric vessels since their propulsion systems often mix engines and batteries.
9. What pricing options are available for accessing the report?
Pricing options include single-user, multi-user, and enterprise licenses priced at USD 4750, USD 5250, and USD 8750 respectively.
10. Is the market size provided in terms of value or volume?
The market size is provided in terms of value, measured in Million.
11. Are there any specific market keywords associated with the report?
Yes, the market keyword associated with the report is "Maritime Analytics Industry," which aids in identifying and referencing the specific market segment covered.
12. How do I determine which pricing option suits my needs best?
The pricing options vary based on user requirements and access needs. Individual users may opt for single-user licenses, while businesses requiring broader access may choose multi-user or enterprise licenses for cost-effective access to the report.
13. Are there any additional resources or data provided in the Maritime Analytics Industry report?
While the report offers comprehensive insights, it's advisable to review the specific contents or supplementary materials provided to ascertain if additional resources or data are available.
14. How can I stay updated on further developments or reports in the Maritime Analytics Industry?
To stay informed about further developments, trends, and reports in the Maritime Analytics Industry, consider subscribing to industry newsletters, following relevant companies and organizations, or regularly checking reputable industry news sources and publications.
Methodology
Step 1 - Identification of Relevant Samples Size from Population Database


Step 2 - Approaches for Defining Global Market Size (Value, Volume* & Price*)

Note*: In applicable scenarios
Step 3 - Data Sources
Primary Research
- Web Analytics
- Survey Reports
- Research Institute
- Latest Research Reports
- Opinion Leaders
Secondary Research
- Annual Reports
- White Paper
- Latest Press Release
- Industry Association
- Paid Database
- Investor Presentations

Step 4 - Data Triangulation
Involves using different sources of information in order to increase the validity of a study
These sources are likely to be stakeholders in a program - participants, other researchers, program staff, other community members, and so on.
Then we put all data in single framework & apply various statistical tools to find out the dynamic on the market.
During the analysis stage, feedback from the stakeholder groups would be compared to determine areas of agreement as well as areas of divergence