MCAA Market CAGR Trends: Growth Outlook 2025-2033

MCAA Market by Chemical Application (Glycine, Carboxymethylcellulose (CMC), Surfactants, 2, 4-Dichloro Phenoxy Acetic Acid, Thioglycol Acid, Other Applications), by End-user Industry (Personal Care and Pharmaceuticals, Agrochemicals, Geological Drillings, Dyes and Detergents, Other End-user Industries), by Asia Pacific (China, India, Japan, South Korea, Malaysia, Thailand, Indonesia, Vietnam, Rest of Asia Pacific), by North America (United States, Canada, Mexico), by Europe (Germany, United Kingdom, Italy, France, Spain, Nordic Countries, Turkey, Russia, Rest of Europe), by South America (Brazil, Argentina, Colombia, Rest of South America), by Middle East and Africa (Saudi Arabia, Qatar, United Arab Emirates, Nigeria, Egypt, South Africa, Rest of Middle East and Africa) Forecast 2025-2033

Aug 3 2025
Base Year: 2024

180 Pages
Main Logo

MCAA Market CAGR Trends: Growth Outlook 2025-2033


Home
Industries
Chemicals & Materials
sponsor image
sponsor image
sponsor image
sponsor image

Tailored for you

  • In-depth Analysis Tailored to Specified Regions or Segments
  • Company Profiles Customized to User Preferences
  • Comprehensive Insights Focused on Specific Segments or Regions
  • Customized Evaluation of Competitive Landscape to Meet Your Needs
  • Tailored Customization to Address Other Specific Requirements
Ask for customization


Key Insights

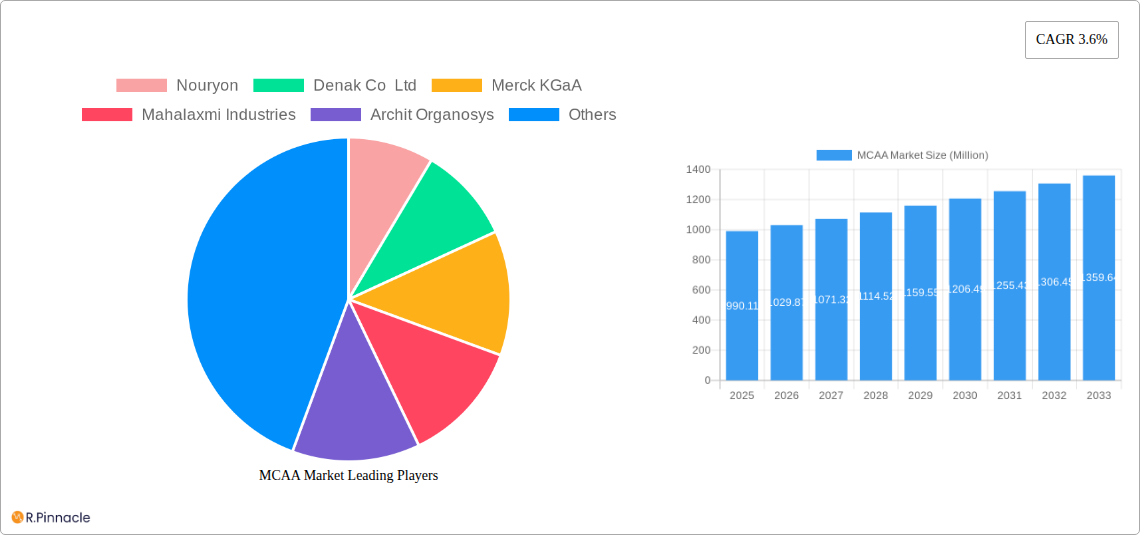
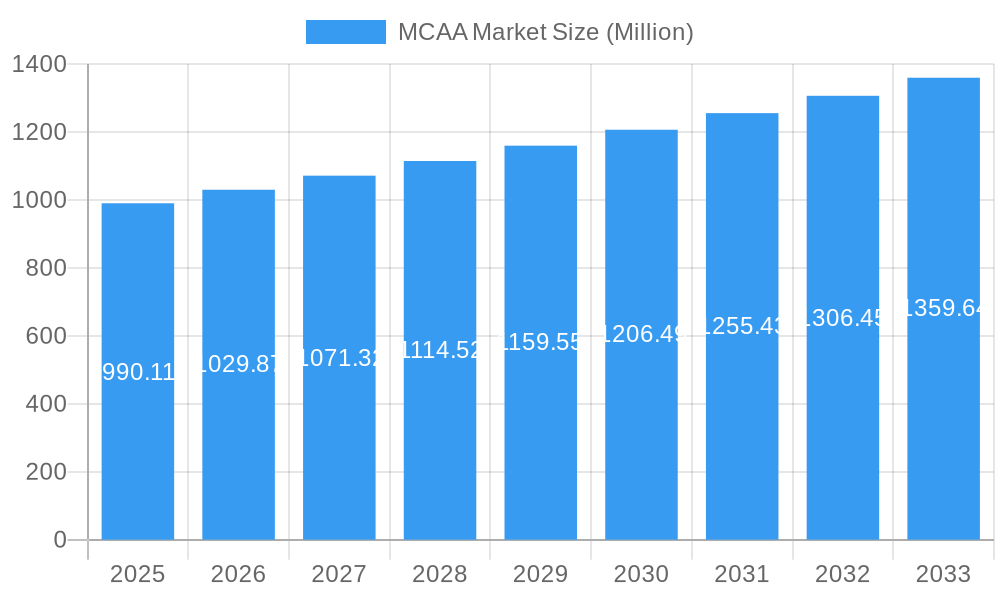
The Monochloroacetic Acid (MCAA) market, valued at $990.11 million in 2025, is projected to experience steady growth, driven by its diverse applications across various industries. A compound annual growth rate (CAGR) of 3.6% from 2025 to 2033 indicates a promising future, fueled by increasing demand from the personal care and pharmaceutical sectors. The rising use of MCAA as a key intermediate in the production of glycine, carboxymethylcellulose (CMC), and other crucial chemicals further contributes to market expansion. Growth is also spurred by the agrochemical industry's reliance on MCAA for herbicide formulations and the expanding geological drilling sector's utilization in various drilling fluids. While specific restraints are not detailed, potential challenges could include fluctuating raw material prices, stringent environmental regulations, and the emergence of alternative chemicals. Nevertheless, the market's diversification across end-user industries offers resilience against potential headwinds. The Asia-Pacific region, particularly China and India, is expected to show significant growth due to expanding industrialization and increasing demand from emerging economies. North America and Europe will continue to be important markets, driven by established chemical industries and strong regulatory frameworks.

The competitive landscape is characterized by a mix of established global players and regional manufacturers. Key players like Nouryon, Merck KGaA, and others are likely to invest in research and development to enhance product offerings and cater to evolving market demands. The strategic alliances and acquisitions witnessed in the past are expected to continue, shaping the competitive dynamics and driving consolidation in the market. The market segmentation by chemical application (glycine, CMC, surfactants, etc.) and end-user industries allows for a nuanced understanding of specific growth drivers and potential opportunities for market players. Focusing on specific niche applications and regional markets with high growth potential will be crucial for companies seeking to gain a competitive edge. Future growth will likely be influenced by factors such as technological advancements, sustainability initiatives, and the development of new applications for MCAA, particularly in areas such as bio-based materials and sustainable chemistry.

MCAA Market Research Report - Market Size, Growth & Forecast

MCAA Market Report: A Comprehensive Analysis (2019-2033)

This in-depth report provides a comprehensive analysis of the global Monochloroacetic Acid (MCAA) market, offering valuable insights for industry professionals, investors, and strategic decision-makers. With a focus on market dynamics, competitive landscape, and future growth prospects, this report covers the period from 2019 to 2033, with a base year of 2025 and a forecast period of 2025-2033. The report utilizes robust data and expert analysis to project a market valued at XX Million by 2033, showcasing significant growth opportunities.

MCAA Market Structure & Innovation Trends

The MCAA market exhibits a moderately concentrated structure, with key players like Nouryon and Merck KGaA holding significant market share (estimated at xx% and xx% respectively in 2025). The market is driven by continuous innovation in production processes, focusing on enhancing efficiency and sustainability. Stringent regulatory frameworks, particularly concerning environmental impact and safety, influence production methods and market access. Several product substitutes exist, but MCAA's unique properties maintain its dominance in key applications. M&A activities have played a role in shaping the market landscape, with deals like the Atul Limited and Nouryon joint venture signifying strategic investments in production capacity. The total value of M&A deals in the MCAA market during the historical period (2019-2024) is estimated at xx Million.

  • Market Concentration: Moderately concentrated, with top players holding xx% combined market share in 2025.
  • Innovation Drivers: Improved production efficiency, sustainable manufacturing processes, and novel applications.
  • Regulatory Framework: Stringent environmental and safety regulations influence market dynamics.
  • Product Substitutes: Limited substitutes with comparable performance characteristics.
  • M&A Activity: Significant investments and collaborations to expand production capacity and market reach.
MCAA Market Growth

MCAA Market Dynamics & Trends

The MCAA market is experiencing robust growth, driven by increasing demand across various end-user industries. The Compound Annual Growth Rate (CAGR) from 2025 to 2033 is projected at xx%, fueled by the rising consumption of MCAA in personal care, pharmaceuticals, and agrochemicals. Technological advancements in production techniques are enhancing efficiency and reducing costs, further boosting market expansion. Consumer preferences towards eco-friendly and sustainable products are also influencing market trends, driving the adoption of sustainable MCAA production methods. Competitive dynamics are shaped by pricing strategies, product differentiation, and geographic expansion. Market penetration in emerging economies presents significant growth opportunities.

MCAA Market Growth

Dominant Regions & Segments in MCAA Market

The Asia-Pacific region is projected as the dominant market for MCAA, driven by the rapid growth of end-user industries in countries like India and China. Within chemical applications, Glycine and Carboxymethylcellulose (CMC) represent the largest segments, while in end-user industries, personal care and pharmaceuticals are leading the way.

  • Key Drivers in Asia-Pacific: Rapid industrialization, growing population, rising disposable incomes, and supportive government policies.
  • Dominant Chemical Applications: Glycine and CMC due to their widespread use in various products.
  • Leading End-user Industries: Personal care and pharmaceuticals owing to increasing demand for MCAA-based products.

The detailed dominance analysis further explores factors influencing the growth of specific regions and segments, providing insights into regional economic conditions and infrastructure development.

MCAA Market Product Innovations

Recent product innovations focus on enhancing the purity and efficiency of MCAA production. The introduction of sustainable and environmentally friendly manufacturing processes is gaining traction, attracting environmentally conscious consumers and businesses. Several companies are also focusing on developing new applications for MCAA, expanding its market potential in various sectors. These innovations are driving competitive advantages by improving product quality, reducing costs, and enhancing sustainability profiles.

Report Scope & Segmentation Analysis

This report segments the MCAA market based on chemical application (Glycine, CMC, Surfactants, 2,4-Dichloro Phenoxy Acetic Acid, Thioglycol Acid, Other Applications) and end-user industry (Personal Care and Pharmaceuticals, Agrochemicals, Geological Drillings, Dyes and Detergents, Other End-user Industries). Each segment's growth projection, market size, and competitive dynamics are thoroughly analyzed. For instance, the Glycine segment is expected to experience a CAGR of xx% driven by its increasing use in the food and beverage industry.

Key Drivers of MCAA Market Growth

The MCAA market's growth is propelled by several factors, including: increasing demand from end-use sectors, particularly personal care, pharmaceuticals and agrochemicals; technological advancements leading to more efficient production; and supportive government policies promoting sustainable manufacturing. Furthermore, the expansion of emerging economies and rising disposable incomes contribute to higher market demand.

Challenges in the MCAA Market Sector

The MCAA market faces challenges such as stringent environmental regulations, potential supply chain disruptions, and intense competition among existing players. These factors can significantly impact production costs and market access. The exact quantifiable impact varies per challenge and is analyzed in detail within the report.

Emerging Opportunities in MCAA Market

Emerging opportunities lie in expanding into new markets, particularly in developing economies with growing demand. Technological advancements such as improved production processes and the development of new applications will further drive market growth. Furthermore, the increasing focus on sustainable and eco-friendly solutions presents lucrative avenues for market expansion.

Leading Players in the MCAA Market Market

  • Nouryon
  • Denak Co Ltd
  • Merck KGaA
  • Mahalaxmi Industries
  • Archit Organosys
  • Jiangxi Biochem Co Ltd
  • Alfa Aesar Thermo Fisher Scientific
  • Meridian Chem Bond Pvt Ltd
  • TerraTech
  • PCC Group
  • Henan HDF Chemical Company Ltd
  • ITALMAR (THAILAND) CO LTD
  • Shandong Minji New Material Technology Co Ltd

Key Developments in MCAA Market Industry

  • April 2021: Atul Limited and Nouryon launched a joint venture in Gujarat, India, significantly boosting MCAA production capacity by 32,000 tons per year.
  • September 2021: Archit Organosys increased its production capacity by 12,000 tpa, driven by increasing domestic and export demand.

Future Outlook for MCAA Market Market

The future of the MCAA market looks promising, driven by sustained growth in key end-user sectors and ongoing technological advancements. Strategic partnerships, expansion into new markets, and a focus on sustainable production methods will further shape the market landscape. The report provides detailed insights into these accelerators, enabling businesses to capitalize on lucrative opportunities and navigate the evolving market dynamics.

MCAA Market Segmentation

  • 1. Chemical Application
    • 1.1. Glycine
    • 1.2. Carboxymethylcellulose (CMC)
    • 1.3. Surfactants
    • 1.4. 2,4-Dichloro Phenoxy Acetic Acid
    • 1.5. Thioglycol Acid
    • 1.6. Other Applications
  • 2. End-user Industry
    • 2.1. Personal Care and Pharmaceuticals
    • 2.2. Agrochemicals
    • 2.3. Geological Drillings
    • 2.4. Dyes and Detergents
    • 2.5. Other End-user Industries

MCAA Market Segmentation By Geography

  • 1. Asia Pacific
    • 1.1. China
    • 1.2. India
    • 1.3. Japan
    • 1.4. South Korea
    • 1.5. Malaysia
    • 1.6. Thailand
    • 1.7. Indonesia
    • 1.8. Vietnam
    • 1.9. Rest of Asia Pacific
  • 2. North America
    • 2.1. United States
    • 2.2. Canada
    • 2.3. Mexico
  • 3. Europe
    • 3.1. Germany
    • 3.2. United Kingdom
    • 3.3. Italy
    • 3.4. France
    • 3.5. Spain
    • 3.6. Nordic Countries
    • 3.7. Turkey
    • 3.8. Russia
    • 3.9. Rest of Europe
  • 4. South America
    • 4.1. Brazil
    • 4.2. Argentina
    • 4.3. Colombia
    • 4.4. Rest of South America
  • 5. Middle East and Africa
    • 5.1. Saudi Arabia
    • 5.2. Qatar
    • 5.3. United Arab Emirates
    • 5.4. Nigeria
    • 5.5. Egypt
    • 5.6. South Africa
    • 5.7. Rest of Middle East and Africa
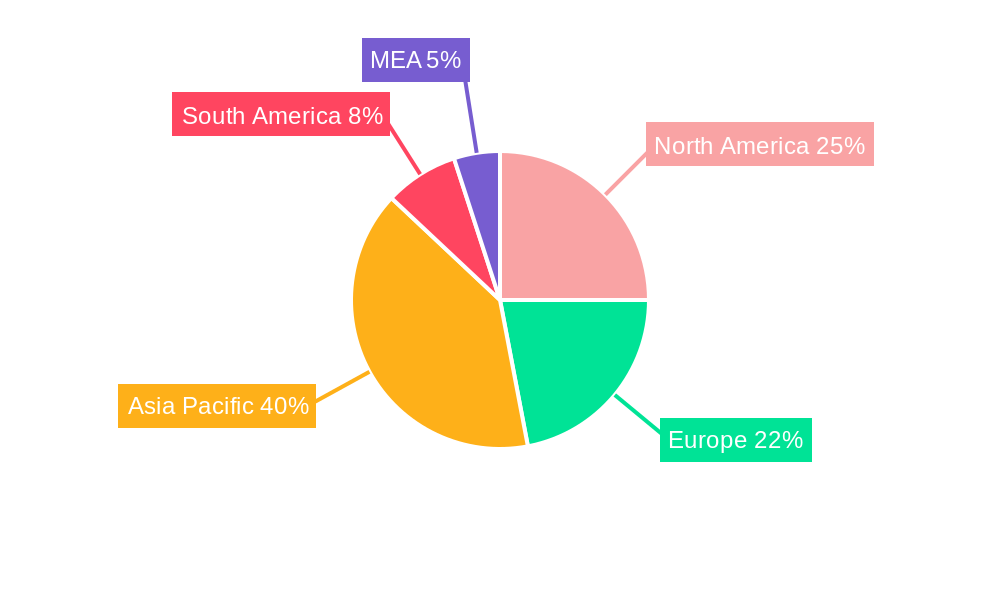
MCAA Market Regional Share


MCAA Market REPORT HIGHLIGHTS

AspectsDetails
Study Period 2019-2033
Base Year 2024
Estimated Year 2025
Forecast Period2025-2033
Historical Period2019-2024
Growth RateCAGR of 3.6% from 2019-2033
Segmentation
    • By Chemical Application
      • Glycine
      • Carboxymethylcellulose (CMC)
      • Surfactants
      • 2,4-Dichloro Phenoxy Acetic Acid
      • Thioglycol Acid
      • Other Applications
    • By End-user Industry
      • Personal Care and Pharmaceuticals
      • Agrochemicals
      • Geological Drillings
      • Dyes and Detergents
      • Other End-user Industries
  • By Geography
    • Asia Pacific
      • China
      • India
      • Japan
      • South Korea
      • Malaysia
      • Thailand
      • Indonesia
      • Vietnam
      • Rest of Asia Pacific
    • North America
      • United States
      • Canada
      • Mexico
    • Europe
      • Germany
      • United Kingdom
      • Italy
      • France
      • Spain
      • Nordic Countries
      • Turkey
      • Russia
      • Rest of Europe
    • South America
      • Brazil
      • Argentina
      • Colombia
      • Rest of South America
    • Middle East and Africa
      • Saudi Arabia
      • Qatar
      • United Arab Emirates
      • Nigeria
      • Egypt
      • South Africa
      • Rest of Middle East and Africa


Table of Contents

  1. 1. Introduction
    • 1.1. Research Scope
    • 1.2. Market Segmentation
    • 1.3. Research Methodology
    • 1.4. Definitions and Assumptions
  2. 2. Executive Summary
    • 2.1. Introduction
  3. 3. Market Dynamics
    • 3.1. Introduction
      • 3.2. Market Drivers
        • 3.2.1. Growing consumption from the pharmaceutical Industry; Growing production of agrochemical in the country
      • 3.3. Market Restrains
        • 3.3.1. Decline in detergent consumption
      • 3.4. Market Trends
        • 3.4.1. Increasing Demand from Personal Care and Pharmaceuticals Industries
  4. 4. Market Factor Analysis
    • 4.1. Porters Five Forces
    • 4.2. Supply/Value Chain
    • 4.3. PESTEL analysis
    • 4.4. Market Entropy
    • 4.5. Patent/Trademark Analysis
  5. 5. Global MCAA Market Analysis, Insights and Forecast, 2019-2031
    • 5.1. Market Analysis, Insights and Forecast - by Chemical Application
      • 5.1.1. Glycine
      • 5.1.2. Carboxymethylcellulose (CMC)
      • 5.1.3. Surfactants
      • 5.1.4. 2,4-Dichloro Phenoxy Acetic Acid
      • 5.1.5. Thioglycol Acid
      • 5.1.6. Other Applications
    • 5.2. Market Analysis, Insights and Forecast - by End-user Industry
      • 5.2.1. Personal Care and Pharmaceuticals
      • 5.2.2. Agrochemicals
      • 5.2.3. Geological Drillings
      • 5.2.4. Dyes and Detergents
      • 5.2.5. Other End-user Industries
    • 5.3. Market Analysis, Insights and Forecast - by Region
      • 5.3.1. Asia Pacific
      • 5.3.2. North America
      • 5.3.3. Europe
      • 5.3.4. South America
      • 5.3.5. Middle East and Africa
  6. 6. Asia Pacific MCAA Market Analysis, Insights and Forecast, 2019-2031
    • 6.1. Market Analysis, Insights and Forecast - by Chemical Application
      • 6.1.1. Glycine
      • 6.1.2. Carboxymethylcellulose (CMC)
      • 6.1.3. Surfactants
      • 6.1.4. 2,4-Dichloro Phenoxy Acetic Acid
      • 6.1.5. Thioglycol Acid
      • 6.1.6. Other Applications
    • 6.2. Market Analysis, Insights and Forecast - by End-user Industry
      • 6.2.1. Personal Care and Pharmaceuticals
      • 6.2.2. Agrochemicals
      • 6.2.3. Geological Drillings
      • 6.2.4. Dyes and Detergents
      • 6.2.5. Other End-user Industries
  7. 7. North America MCAA Market Analysis, Insights and Forecast, 2019-2031
    • 7.1. Market Analysis, Insights and Forecast - by Chemical Application
      • 7.1.1. Glycine
      • 7.1.2. Carboxymethylcellulose (CMC)
      • 7.1.3. Surfactants
      • 7.1.4. 2,4-Dichloro Phenoxy Acetic Acid
      • 7.1.5. Thioglycol Acid
      • 7.1.6. Other Applications
    • 7.2. Market Analysis, Insights and Forecast - by End-user Industry
      • 7.2.1. Personal Care and Pharmaceuticals
      • 7.2.2. Agrochemicals
      • 7.2.3. Geological Drillings
      • 7.2.4. Dyes and Detergents
      • 7.2.5. Other End-user Industries
  8. 8. Europe MCAA Market Analysis, Insights and Forecast, 2019-2031
    • 8.1. Market Analysis, Insights and Forecast - by Chemical Application
      • 8.1.1. Glycine
      • 8.1.2. Carboxymethylcellulose (CMC)
      • 8.1.3. Surfactants
      • 8.1.4. 2,4-Dichloro Phenoxy Acetic Acid
      • 8.1.5. Thioglycol Acid
      • 8.1.6. Other Applications
    • 8.2. Market Analysis, Insights and Forecast - by End-user Industry
      • 8.2.1. Personal Care and Pharmaceuticals
      • 8.2.2. Agrochemicals
      • 8.2.3. Geological Drillings
      • 8.2.4. Dyes and Detergents
      • 8.2.5. Other End-user Industries
  9. 9. South America MCAA Market Analysis, Insights and Forecast, 2019-2031
    • 9.1. Market Analysis, Insights and Forecast - by Chemical Application
      • 9.1.1. Glycine
      • 9.1.2. Carboxymethylcellulose (CMC)
      • 9.1.3. Surfactants
      • 9.1.4. 2,4-Dichloro Phenoxy Acetic Acid
      • 9.1.5. Thioglycol Acid
      • 9.1.6. Other Applications
    • 9.2. Market Analysis, Insights and Forecast - by End-user Industry
      • 9.2.1. Personal Care and Pharmaceuticals
      • 9.2.2. Agrochemicals
      • 9.2.3. Geological Drillings
      • 9.2.4. Dyes and Detergents
      • 9.2.5. Other End-user Industries
  10. 10. Middle East and Africa MCAA Market Analysis, Insights and Forecast, 2019-2031
    • 10.1. Market Analysis, Insights and Forecast - by Chemical Application
      • 10.1.1. Glycine
      • 10.1.2. Carboxymethylcellulose (CMC)
      • 10.1.3. Surfactants
      • 10.1.4. 2,4-Dichloro Phenoxy Acetic Acid
      • 10.1.5. Thioglycol Acid
      • 10.1.6. Other Applications
    • 10.2. Market Analysis, Insights and Forecast - by End-user Industry
      • 10.2.1. Personal Care and Pharmaceuticals
      • 10.2.2. Agrochemicals
      • 10.2.3. Geological Drillings
      • 10.2.4. Dyes and Detergents
      • 10.2.5. Other End-user Industries
  11. 11. North America MCAA Market Analysis, Insights and Forecast, 2019-2031
      • 11.1. Market Analysis, Insights and Forecast - By Country/Sub-region
        • 11.1.1 United States
        • 11.1.2 Canada
        • 11.1.3 Mexico
  12. 12. Europe MCAA Market Analysis, Insights and Forecast, 2019-2031
      • 12.1. Market Analysis, Insights and Forecast - By Country/Sub-region
        • 12.1.1 Germany
        • 12.1.2 France
        • 12.1.3 Italy
        • 12.1.4 United Kingdom
        • 12.1.5 Netherlands
        • 12.1.6 Rest of Europe
  13. 13. Asia Pacific MCAA Market Analysis, Insights and Forecast, 2019-2031
      • 13.1. Market Analysis, Insights and Forecast - By Country/Sub-region
        • 13.1.1 China
        • 13.1.2 Japan
        • 13.1.3 India
        • 13.1.4 South Korea
        • 13.1.5 Taiwan
        • 13.1.6 Australia
        • 13.1.7 Rest of Asia-Pacific
  14. 14. South America MCAA Market Analysis, Insights and Forecast, 2019-2031
      • 14.1. Market Analysis, Insights and Forecast - By Country/Sub-region
        • 14.1.1 Brazil
        • 14.1.2 Argentina
        • 14.1.3 Rest of South America
  15. 15. MEA MCAA Market Analysis, Insights and Forecast, 2019-2031
      • 15.1. Market Analysis, Insights and Forecast - By Country/Sub-region
        • 15.1.1 Middle East
        • 15.1.2 Africa
  16. 16. Competitive Analysis
    • 16.1. Global Market Share Analysis 2024
      • 16.2. Company Profiles
        • 16.2.1 Nouryon
          • 16.2.1.1. Overview
          • 16.2.1.2. Products
          • 16.2.1.3. SWOT Analysis
          • 16.2.1.4. Recent Developments
          • 16.2.1.5. Financials (Based on Availability)
        • 16.2.2 Denak Co Ltd
          • 16.2.2.1. Overview
          • 16.2.2.2. Products
          • 16.2.2.3. SWOT Analysis
          • 16.2.2.4. Recent Developments
          • 16.2.2.5. Financials (Based on Availability)
        • 16.2.3 Merck KGaA
          • 16.2.3.1. Overview
          • 16.2.3.2. Products
          • 16.2.3.3. SWOT Analysis
          • 16.2.3.4. Recent Developments
          • 16.2.3.5. Financials (Based on Availability)
        • 16.2.4 Mahalaxmi Industries
          • 16.2.4.1. Overview
          • 16.2.4.2. Products
          • 16.2.4.3. SWOT Analysis
          • 16.2.4.4. Recent Developments
          • 16.2.4.5. Financials (Based on Availability)
        • 16.2.5 Archit Organosys
          • 16.2.5.1. Overview
          • 16.2.5.2. Products
          • 16.2.5.3. SWOT Analysis
          • 16.2.5.4. Recent Developments
          • 16.2.5.5. Financials (Based on Availability)
        • 16.2.6 Jiangxi Biochem Co Ltd
          • 16.2.6.1. Overview
          • 16.2.6.2. Products
          • 16.2.6.3. SWOT Analysis
          • 16.2.6.4. Recent Developments
          • 16.2.6.5. Financials (Based on Availability)
        • 16.2.7 Alfa Aesar Thermo Fisher Scientific
          • 16.2.7.1. Overview
          • 16.2.7.2. Products
          • 16.2.7.3. SWOT Analysis
          • 16.2.7.4. Recent Developments
          • 16.2.7.5. Financials (Based on Availability)
        • 16.2.8 Meridian Chem Bond Pvt Ltd
          • 16.2.8.1. Overview
          • 16.2.8.2. Products
          • 16.2.8.3. SWOT Analysis
          • 16.2.8.4. Recent Developments
          • 16.2.8.5. Financials (Based on Availability)
        • 16.2.9 TerraTech
          • 16.2.9.1. Overview
          • 16.2.9.2. Products
          • 16.2.9.3. SWOT Analysis
          • 16.2.9.4. Recent Developments
          • 16.2.9.5. Financials (Based on Availability)
        • 16.2.10 PCC Group
          • 16.2.10.1. Overview
          • 16.2.10.2. Products
          • 16.2.10.3. SWOT Analysis
          • 16.2.10.4. Recent Developments
          • 16.2.10.5. Financials (Based on Availability)
        • 16.2.11 Henan HDF Chemical CompanyLtd
          • 16.2.11.1. Overview
          • 16.2.11.2. Products
          • 16.2.11.3. SWOT Analysis
          • 16.2.11.4. Recent Developments
          • 16.2.11.5. Financials (Based on Availability)
        • 16.2.12 ITALMAR (THAILAND) CO LTD
          • 16.2.12.1. Overview
          • 16.2.12.2. Products
          • 16.2.12.3. SWOT Analysis
          • 16.2.12.4. Recent Developments
          • 16.2.12.5. Financials (Based on Availability)
        • 16.2.13 Shandong Minji New Material Technology Co Ltd
          • 16.2.13.1. Overview
          • 16.2.13.2. Products
          • 16.2.13.3. SWOT Analysis
          • 16.2.13.4. Recent Developments
          • 16.2.13.5. Financials (Based on Availability)

List of Figures

  1. Figure 1: Global MCAA Market Revenue Breakdown (Million, %) by Region 2024 & 2032
  2. Figure 2: Global MCAA Market Volume Breakdown (K Tons, %) by Region 2024 & 2032
  3. Figure 3: North America MCAA Market Revenue (Million), by Country 2024 & 2032
  4. Figure 4: North America MCAA Market Volume (K Tons), by Country 2024 & 2032
  5. Figure 5: North America MCAA Market Revenue Share (%), by Country 2024 & 2032
  6. Figure 6: North America MCAA Market Volume Share (%), by Country 2024 & 2032
  7. Figure 7: Europe MCAA Market Revenue (Million), by Country 2024 & 2032
  8. Figure 8: Europe MCAA Market Volume (K Tons), by Country 2024 & 2032
  9. Figure 9: Europe MCAA Market Revenue Share (%), by Country 2024 & 2032
  10. Figure 10: Europe MCAA Market Volume Share (%), by Country 2024 & 2032
  11. Figure 11: Asia Pacific MCAA Market Revenue (Million), by Country 2024 & 2032
  12. Figure 12: Asia Pacific MCAA Market Volume (K Tons), by Country 2024 & 2032
  13. Figure 13: Asia Pacific MCAA Market Revenue Share (%), by Country 2024 & 2032
  14. Figure 14: Asia Pacific MCAA Market Volume Share (%), by Country 2024 & 2032
  15. Figure 15: South America MCAA Market Revenue (Million), by Country 2024 & 2032
  16. Figure 16: South America MCAA Market Volume (K Tons), by Country 2024 & 2032
  17. Figure 17: South America MCAA Market Revenue Share (%), by Country 2024 & 2032
  18. Figure 18: South America MCAA Market Volume Share (%), by Country 2024 & 2032
  19. Figure 19: MEA MCAA Market Revenue (Million), by Country 2024 & 2032
  20. Figure 20: MEA MCAA Market Volume (K Tons), by Country 2024 & 2032
  21. Figure 21: MEA MCAA Market Revenue Share (%), by Country 2024 & 2032
  22. Figure 22: MEA MCAA Market Volume Share (%), by Country 2024 & 2032
  23. Figure 23: Asia Pacific MCAA Market Revenue (Million), by Chemical Application 2024 & 2032
  24. Figure 24: Asia Pacific MCAA Market Volume (K Tons), by Chemical Application 2024 & 2032
  25. Figure 25: Asia Pacific MCAA Market Revenue Share (%), by Chemical Application 2024 & 2032
  26. Figure 26: Asia Pacific MCAA Market Volume Share (%), by Chemical Application 2024 & 2032
  27. Figure 27: Asia Pacific MCAA Market Revenue (Million), by End-user Industry 2024 & 2032
  28. Figure 28: Asia Pacific MCAA Market Volume (K Tons), by End-user Industry 2024 & 2032
  29. Figure 29: Asia Pacific MCAA Market Revenue Share (%), by End-user Industry 2024 & 2032
  30. Figure 30: Asia Pacific MCAA Market Volume Share (%), by End-user Industry 2024 & 2032
  31. Figure 31: Asia Pacific MCAA Market Revenue (Million), by Country 2024 & 2032
  32. Figure 32: Asia Pacific MCAA Market Volume (K Tons), by Country 2024 & 2032
  33. Figure 33: Asia Pacific MCAA Market Revenue Share (%), by Country 2024 & 2032
  34. Figure 34: Asia Pacific MCAA Market Volume Share (%), by Country 2024 & 2032
  35. Figure 35: North America MCAA Market Revenue (Million), by Chemical Application 2024 & 2032
  36. Figure 36: North America MCAA Market Volume (K Tons), by Chemical Application 2024 & 2032
  37. Figure 37: North America MCAA Market Revenue Share (%), by Chemical Application 2024 & 2032
  38. Figure 38: North America MCAA Market Volume Share (%), by Chemical Application 2024 & 2032
  39. Figure 39: North America MCAA Market Revenue (Million), by End-user Industry 2024 & 2032
  40. Figure 40: North America MCAA Market Volume (K Tons), by End-user Industry 2024 & 2032
  41. Figure 41: North America MCAA Market Revenue Share (%), by End-user Industry 2024 & 2032
  42. Figure 42: North America MCAA Market Volume Share (%), by End-user Industry 2024 & 2032
  43. Figure 43: North America MCAA Market Revenue (Million), by Country 2024 & 2032
  44. Figure 44: North America MCAA Market Volume (K Tons), by Country 2024 & 2032
  45. Figure 45: North America MCAA Market Revenue Share (%), by Country 2024 & 2032
  46. Figure 46: North America MCAA Market Volume Share (%), by Country 2024 & 2032
  47. Figure 47: Europe MCAA Market Revenue (Million), by Chemical Application 2024 & 2032
  48. Figure 48: Europe MCAA Market Volume (K Tons), by Chemical Application 2024 & 2032
  49. Figure 49: Europe MCAA Market Revenue Share (%), by Chemical Application 2024 & 2032
  50. Figure 50: Europe MCAA Market Volume Share (%), by Chemical Application 2024 & 2032
  51. Figure 51: Europe MCAA Market Revenue (Million), by End-user Industry 2024 & 2032
  52. Figure 52: Europe MCAA Market Volume (K Tons), by End-user Industry 2024 & 2032
  53. Figure 53: Europe MCAA Market Revenue Share (%), by End-user Industry 2024 & 2032
  54. Figure 54: Europe MCAA Market Volume Share (%), by End-user Industry 2024 & 2032
  55. Figure 55: Europe MCAA Market Revenue (Million), by Country 2024 & 2032
  56. Figure 56: Europe MCAA Market Volume (K Tons), by Country 2024 & 2032
  57. Figure 57: Europe MCAA Market Revenue Share (%), by Country 2024 & 2032
  58. Figure 58: Europe MCAA Market Volume Share (%), by Country 2024 & 2032
  59. Figure 59: South America MCAA Market Revenue (Million), by Chemical Application 2024 & 2032
  60. Figure 60: South America MCAA Market Volume (K Tons), by Chemical Application 2024 & 2032
  61. Figure 61: South America MCAA Market Revenue Share (%), by Chemical Application 2024 & 2032
  62. Figure 62: South America MCAA Market Volume Share (%), by Chemical Application 2024 & 2032
  63. Figure 63: South America MCAA Market Revenue (Million), by End-user Industry 2024 & 2032
  64. Figure 64: South America MCAA Market Volume (K Tons), by End-user Industry 2024 & 2032
  65. Figure 65: South America MCAA Market Revenue Share (%), by End-user Industry 2024 & 2032
  66. Figure 66: South America MCAA Market Volume Share (%), by End-user Industry 2024 & 2032
  67. Figure 67: South America MCAA Market Revenue (Million), by Country 2024 & 2032
  68. Figure 68: South America MCAA Market Volume (K Tons), by Country 2024 & 2032
  69. Figure 69: South America MCAA Market Revenue Share (%), by Country 2024 & 2032
  70. Figure 70: South America MCAA Market Volume Share (%), by Country 2024 & 2032
  71. Figure 71: Middle East and Africa MCAA Market Revenue (Million), by Chemical Application 2024 & 2032
  72. Figure 72: Middle East and Africa MCAA Market Volume (K Tons), by Chemical Application 2024 & 2032
  73. Figure 73: Middle East and Africa MCAA Market Revenue Share (%), by Chemical Application 2024 & 2032
  74. Figure 74: Middle East and Africa MCAA Market Volume Share (%), by Chemical Application 2024 & 2032
  75. Figure 75: Middle East and Africa MCAA Market Revenue (Million), by End-user Industry 2024 & 2032
  76. Figure 76: Middle East and Africa MCAA Market Volume (K Tons), by End-user Industry 2024 & 2032
  77. Figure 77: Middle East and Africa MCAA Market Revenue Share (%), by End-user Industry 2024 & 2032
  78. Figure 78: Middle East and Africa MCAA Market Volume Share (%), by End-user Industry 2024 & 2032
  79. Figure 79: Middle East and Africa MCAA Market Revenue (Million), by Country 2024 & 2032
  80. Figure 80: Middle East and Africa MCAA Market Volume (K Tons), by Country 2024 & 2032
  81. Figure 81: Middle East and Africa MCAA Market Revenue Share (%), by Country 2024 & 2032
  82. Figure 82: Middle East and Africa MCAA Market Volume Share (%), by Country 2024 & 2032

List of Tables

  1. Table 1: Global MCAA Market Revenue Million Forecast, by Region 2019 & 2032
  2. Table 2: Global MCAA Market Volume K Tons Forecast, by Region 2019 & 2032
  3. Table 3: Global MCAA Market Revenue Million Forecast, by Chemical Application 2019 & 2032
  4. Table 4: Global MCAA Market Volume K Tons Forecast, by Chemical Application 2019 & 2032
  5. Table 5: Global MCAA Market Revenue Million Forecast, by End-user Industry 2019 & 2032
  6. Table 6: Global MCAA Market Volume K Tons Forecast, by End-user Industry 2019 & 2032
  7. Table 7: Global MCAA Market Revenue Million Forecast, by Region 2019 & 2032
  8. Table 8: Global MCAA Market Volume K Tons Forecast, by Region 2019 & 2032
  9. Table 9: Global MCAA Market Revenue Million Forecast, by Country 2019 & 2032
  10. Table 10: Global MCAA Market Volume K Tons Forecast, by Country 2019 & 2032
  11. Table 11: United States MCAA Market Revenue (Million) Forecast, by Application 2019 & 2032
  12. Table 12: United States MCAA Market Volume (K Tons) Forecast, by Application 2019 & 2032
  13. Table 13: Canada MCAA Market Revenue (Million) Forecast, by Application 2019 & 2032
  14. Table 14: Canada MCAA Market Volume (K Tons) Forecast, by Application 2019 & 2032
  15. Table 15: Mexico MCAA Market Revenue (Million) Forecast, by Application 2019 & 2032
  16. Table 16: Mexico MCAA Market Volume (K Tons) Forecast, by Application 2019 & 2032
  17. Table 17: Global MCAA Market Revenue Million Forecast, by Country 2019 & 2032
  18. Table 18: Global MCAA Market Volume K Tons Forecast, by Country 2019 & 2032
  19. Table 19: Germany MCAA Market Revenue (Million) Forecast, by Application 2019 & 2032
  20. Table 20: Germany MCAA Market Volume (K Tons) Forecast, by Application 2019 & 2032
  21. Table 21: France MCAA Market Revenue (Million) Forecast, by Application 2019 & 2032
  22. Table 22: France MCAA Market Volume (K Tons) Forecast, by Application 2019 & 2032
  23. Table 23: Italy MCAA Market Revenue (Million) Forecast, by Application 2019 & 2032
  24. Table 24: Italy MCAA Market Volume (K Tons) Forecast, by Application 2019 & 2032
  25. Table 25: United Kingdom MCAA Market Revenue (Million) Forecast, by Application 2019 & 2032
  26. Table 26: United Kingdom MCAA Market Volume (K Tons) Forecast, by Application 2019 & 2032
  27. Table 27: Netherlands MCAA Market Revenue (Million) Forecast, by Application 2019 & 2032
  28. Table 28: Netherlands MCAA Market Volume (K Tons) Forecast, by Application 2019 & 2032
  29. Table 29: Rest of Europe MCAA Market Revenue (Million) Forecast, by Application 2019 & 2032
  30. Table 30: Rest of Europe MCAA Market Volume (K Tons) Forecast, by Application 2019 & 2032
  31. Table 31: Global MCAA Market Revenue Million Forecast, by Country 2019 & 2032
  32. Table 32: Global MCAA Market Volume K Tons Forecast, by Country 2019 & 2032
  33. Table 33: China MCAA Market Revenue (Million) Forecast, by Application 2019 & 2032
  34. Table 34: China MCAA Market Volume (K Tons) Forecast, by Application 2019 & 2032
  35. Table 35: Japan MCAA Market Revenue (Million) Forecast, by Application 2019 & 2032
  36. Table 36: Japan MCAA Market Volume (K Tons) Forecast, by Application 2019 & 2032
  37. Table 37: India MCAA Market Revenue (Million) Forecast, by Application 2019 & 2032
  38. Table 38: India MCAA Market Volume (K Tons) Forecast, by Application 2019 & 2032
  39. Table 39: South Korea MCAA Market Revenue (Million) Forecast, by Application 2019 & 2032
  40. Table 40: South Korea MCAA Market Volume (K Tons) Forecast, by Application 2019 & 2032
  41. Table 41: Taiwan MCAA Market Revenue (Million) Forecast, by Application 2019 & 2032
  42. Table 42: Taiwan MCAA Market Volume (K Tons) Forecast, by Application 2019 & 2032
  43. Table 43: Australia MCAA Market Revenue (Million) Forecast, by Application 2019 & 2032
  44. Table 44: Australia MCAA Market Volume (K Tons) Forecast, by Application 2019 & 2032
  45. Table 45: Rest of Asia-Pacific MCAA Market Revenue (Million) Forecast, by Application 2019 & 2032
  46. Table 46: Rest of Asia-Pacific MCAA Market Volume (K Tons) Forecast, by Application 2019 & 2032
  47. Table 47: Global MCAA Market Revenue Million Forecast, by Country 2019 & 2032
  48. Table 48: Global MCAA Market Volume K Tons Forecast, by Country 2019 & 2032
  49. Table 49: Brazil MCAA Market Revenue (Million) Forecast, by Application 2019 & 2032
  50. Table 50: Brazil MCAA Market Volume (K Tons) Forecast, by Application 2019 & 2032
  51. Table 51: Argentina MCAA Market Revenue (Million) Forecast, by Application 2019 & 2032
  52. Table 52: Argentina MCAA Market Volume (K Tons) Forecast, by Application 2019 & 2032
  53. Table 53: Rest of South America MCAA Market Revenue (Million) Forecast, by Application 2019 & 2032
  54. Table 54: Rest of South America MCAA Market Volume (K Tons) Forecast, by Application 2019 & 2032
  55. Table 55: Global MCAA Market Revenue Million Forecast, by Country 2019 & 2032
  56. Table 56: Global MCAA Market Volume K Tons Forecast, by Country 2019 & 2032
  57. Table 57: Middle East MCAA Market Revenue (Million) Forecast, by Application 2019 & 2032
  58. Table 58: Middle East MCAA Market Volume (K Tons) Forecast, by Application 2019 & 2032
  59. Table 59: Africa MCAA Market Revenue (Million) Forecast, by Application 2019 & 2032
  60. Table 60: Africa MCAA Market Volume (K Tons) Forecast, by Application 2019 & 2032
  61. Table 61: Global MCAA Market Revenue Million Forecast, by Chemical Application 2019 & 2032
  62. Table 62: Global MCAA Market Volume K Tons Forecast, by Chemical Application 2019 & 2032
  63. Table 63: Global MCAA Market Revenue Million Forecast, by End-user Industry 2019 & 2032
  64. Table 64: Global MCAA Market Volume K Tons Forecast, by End-user Industry 2019 & 2032
  65. Table 65: Global MCAA Market Revenue Million Forecast, by Country 2019 & 2032
  66. Table 66: Global MCAA Market Volume K Tons Forecast, by Country 2019 & 2032
  67. Table 67: China MCAA Market Revenue (Million) Forecast, by Application 2019 & 2032
  68. Table 68: China MCAA Market Volume (K Tons) Forecast, by Application 2019 & 2032
  69. Table 69: India MCAA Market Revenue (Million) Forecast, by Application 2019 & 2032
  70. Table 70: India MCAA Market Volume (K Tons) Forecast, by Application 2019 & 2032
  71. Table 71: Japan MCAA Market Revenue (Million) Forecast, by Application 2019 & 2032
  72. Table 72: Japan MCAA Market Volume (K Tons) Forecast, by Application 2019 & 2032
  73. Table 73: South Korea MCAA Market Revenue (Million) Forecast, by Application 2019 & 2032
  74. Table 74: South Korea MCAA Market Volume (K Tons) Forecast, by Application 2019 & 2032
  75. Table 75: Malaysia MCAA Market Revenue (Million) Forecast, by Application 2019 & 2032
  76. Table 76: Malaysia MCAA Market Volume (K Tons) Forecast, by Application 2019 & 2032
  77. Table 77: Thailand MCAA Market Revenue (Million) Forecast, by Application 2019 & 2032
  78. Table 78: Thailand MCAA Market Volume (K Tons) Forecast, by Application 2019 & 2032
  79. Table 79: Indonesia MCAA Market Revenue (Million) Forecast, by Application 2019 & 2032
  80. Table 80: Indonesia MCAA Market Volume (K Tons) Forecast, by Application 2019 & 2032
  81. Table 81: Vietnam MCAA Market Revenue (Million) Forecast, by Application 2019 & 2032
  82. Table 82: Vietnam MCAA Market Volume (K Tons) Forecast, by Application 2019 & 2032
  83. Table 83: Rest of Asia Pacific MCAA Market Revenue (Million) Forecast, by Application 2019 & 2032
  84. Table 84: Rest of Asia Pacific MCAA Market Volume (K Tons) Forecast, by Application 2019 & 2032
  85. Table 85: Global MCAA Market Revenue Million Forecast, by Chemical Application 2019 & 2032
  86. Table 86: Global MCAA Market Volume K Tons Forecast, by Chemical Application 2019 & 2032
  87. Table 87: Global MCAA Market Revenue Million Forecast, by End-user Industry 2019 & 2032
  88. Table 88: Global MCAA Market Volume K Tons Forecast, by End-user Industry 2019 & 2032
  89. Table 89: Global MCAA Market Revenue Million Forecast, by Country 2019 & 2032
  90. Table 90: Global MCAA Market Volume K Tons Forecast, by Country 2019 & 2032
  91. Table 91: United States MCAA Market Revenue (Million) Forecast, by Application 2019 & 2032
  92. Table 92: United States MCAA Market Volume (K Tons) Forecast, by Application 2019 & 2032
  93. Table 93: Canada MCAA Market Revenue (Million) Forecast, by Application 2019 & 2032
  94. Table 94: Canada MCAA Market Volume (K Tons) Forecast, by Application 2019 & 2032
  95. Table 95: Mexico MCAA Market Revenue (Million) Forecast, by Application 2019 & 2032
  96. Table 96: Mexico MCAA Market Volume (K Tons) Forecast, by Application 2019 & 2032
  97. Table 97: Global MCAA Market Revenue Million Forecast, by Chemical Application 2019 & 2032
  98. Table 98: Global MCAA Market Volume K Tons Forecast, by Chemical Application 2019 & 2032
  99. Table 99: Global MCAA Market Revenue Million Forecast, by End-user Industry 2019 & 2032
  100. Table 100: Global MCAA Market Volume K Tons Forecast, by End-user Industry 2019 & 2032
  101. Table 101: Global MCAA Market Revenue Million Forecast, by Country 2019 & 2032
  102. Table 102: Global MCAA Market Volume K Tons Forecast, by Country 2019 & 2032
  103. Table 103: Germany MCAA Market Revenue (Million) Forecast, by Application 2019 & 2032
  104. Table 104: Germany MCAA Market Volume (K Tons) Forecast, by Application 2019 & 2032
  105. Table 105: United Kingdom MCAA Market Revenue (Million) Forecast, by Application 2019 & 2032
  106. Table 106: United Kingdom MCAA Market Volume (K Tons) Forecast, by Application 2019 & 2032
  107. Table 107: Italy MCAA Market Revenue (Million) Forecast, by Application 2019 & 2032
  108. Table 108: Italy MCAA Market Volume (K Tons) Forecast, by Application 2019 & 2032
  109. Table 109: France MCAA Market Revenue (Million) Forecast, by Application 2019 & 2032
  110. Table 110: France MCAA Market Volume (K Tons) Forecast, by Application 2019 & 2032
  111. Table 111: Spain MCAA Market Revenue (Million) Forecast, by Application 2019 & 2032
  112. Table 112: Spain MCAA Market Volume (K Tons) Forecast, by Application 2019 & 2032
  113. Table 113: Nordic Countries MCAA Market Revenue (Million) Forecast, by Application 2019 & 2032
  114. Table 114: Nordic Countries MCAA Market Volume (K Tons) Forecast, by Application 2019 & 2032
  115. Table 115: Turkey MCAA Market Revenue (Million) Forecast, by Application 2019 & 2032
  116. Table 116: Turkey MCAA Market Volume (K Tons) Forecast, by Application 2019 & 2032
  117. Table 117: Russia MCAA Market Revenue (Million) Forecast, by Application 2019 & 2032
  118. Table 118: Russia MCAA Market Volume (K Tons) Forecast, by Application 2019 & 2032
  119. Table 119: Rest of Europe MCAA Market Revenue (Million) Forecast, by Application 2019 & 2032
  120. Table 120: Rest of Europe MCAA Market Volume (K Tons) Forecast, by Application 2019 & 2032
  121. Table 121: Global MCAA Market Revenue Million Forecast, by Chemical Application 2019 & 2032
  122. Table 122: Global MCAA Market Volume K Tons Forecast, by Chemical Application 2019 & 2032
  123. Table 123: Global MCAA Market Revenue Million Forecast, by End-user Industry 2019 & 2032
  124. Table 124: Global MCAA Market Volume K Tons Forecast, by End-user Industry 2019 & 2032
  125. Table 125: Global MCAA Market Revenue Million Forecast, by Country 2019 & 2032
  126. Table 126: Global MCAA Market Volume K Tons Forecast, by Country 2019 & 2032
  127. Table 127: Brazil MCAA Market Revenue (Million) Forecast, by Application 2019 & 2032
  128. Table 128: Brazil MCAA Market Volume (K Tons) Forecast, by Application 2019 & 2032
  129. Table 129: Argentina MCAA Market Revenue (Million) Forecast, by Application 2019 & 2032
  130. Table 130: Argentina MCAA Market Volume (K Tons) Forecast, by Application 2019 & 2032
  131. Table 131: Colombia MCAA Market Revenue (Million) Forecast, by Application 2019 & 2032
  132. Table 132: Colombia MCAA Market Volume (K Tons) Forecast, by Application 2019 & 2032
  133. Table 133: Rest of South America MCAA Market Revenue (Million) Forecast, by Application 2019 & 2032
  134. Table 134: Rest of South America MCAA Market Volume (K Tons) Forecast, by Application 2019 & 2032
  135. Table 135: Global MCAA Market Revenue Million Forecast, by Chemical Application 2019 & 2032
  136. Table 136: Global MCAA Market Volume K Tons Forecast, by Chemical Application 2019 & 2032
  137. Table 137: Global MCAA Market Revenue Million Forecast, by End-user Industry 2019 & 2032
  138. Table 138: Global MCAA Market Volume K Tons Forecast, by End-user Industry 2019 & 2032
  139. Table 139: Global MCAA Market Revenue Million Forecast, by Country 2019 & 2032
  140. Table 140: Global MCAA Market Volume K Tons Forecast, by Country 2019 & 2032
  141. Table 141: Saudi Arabia MCAA Market Revenue (Million) Forecast, by Application 2019 & 2032
  142. Table 142: Saudi Arabia MCAA Market Volume (K Tons) Forecast, by Application 2019 & 2032
  143. Table 143: Qatar MCAA Market Revenue (Million) Forecast, by Application 2019 & 2032
  144. Table 144: Qatar MCAA Market Volume (K Tons) Forecast, by Application 2019 & 2032
  145. Table 145: United Arab Emirates MCAA Market Revenue (Million) Forecast, by Application 2019 & 2032
  146. Table 146: United Arab Emirates MCAA Market Volume (K Tons) Forecast, by Application 2019 & 2032
  147. Table 147: Nigeria MCAA Market Revenue (Million) Forecast, by Application 2019 & 2032
  148. Table 148: Nigeria MCAA Market Volume (K Tons) Forecast, by Application 2019 & 2032
  149. Table 149: Egypt MCAA Market Revenue (Million) Forecast, by Application 2019 & 2032
  150. Table 150: Egypt MCAA Market Volume (K Tons) Forecast, by Application 2019 & 2032
  151. Table 151: South Africa MCAA Market Revenue (Million) Forecast, by Application 2019 & 2032
  152. Table 152: South Africa MCAA Market Volume (K Tons) Forecast, by Application 2019 & 2032
  153. Table 153: Rest of Middle East and Africa MCAA Market Revenue (Million) Forecast, by Application 2019 & 2032
  154. Table 154: Rest of Middle East and Africa MCAA Market Volume (K Tons) Forecast, by Application 2019 & 2032


Frequently Asked Questions

1. What is the projected Compound Annual Growth Rate (CAGR) of the MCAA Market?

The projected CAGR is approximately 3.6%.

2. Which companies are prominent players in the MCAA Market?

Key companies in the market include Nouryon, Denak Co Ltd, Merck KGaA, Mahalaxmi Industries, Archit Organosys, Jiangxi Biochem Co Ltd, Alfa Aesar Thermo Fisher Scientific, Meridian Chem Bond Pvt Ltd, TerraTech, PCC Group, Henan HDF Chemical CompanyLtd, ITALMAR (THAILAND) CO LTD, Shandong Minji New Material Technology Co Ltd.

3. What are the main segments of the MCAA Market?

The market segments include Chemical Application, End-user Industry.

4. Can you provide details about the market size?

The market size is estimated to be USD 990.11 Million as of 2022.

5. What are some drivers contributing to market growth?

Growing consumption from the pharmaceutical Industry; Growing production of agrochemical in the country.

6. What are the notable trends driving market growth?

Increasing Demand from Personal Care and Pharmaceuticals Industries.

7. Are there any restraints impacting market growth?

Decline in detergent consumption.

8. Can you provide examples of recent developments in the market?

September 2021: The Board of Directors of Archit Organosys approved the proposal to increase the production capacity by 12,000 tpa at the existing Bhavnagar plant in Gujarat. The project will entail an investment of Rs five crore which will be financed through internal accruals. There is an increase in demand for Monochloro Acetic Acid (MCA) both at the domestic and export level, as witnessed by the company.

9. What pricing options are available for accessing the report?

Pricing options include single-user, multi-user, and enterprise licenses priced at USD 4750, USD 5250, and USD 8750 respectively.

10. Is the market size provided in terms of value or volume?

The market size is provided in terms of value, measured in Million and volume, measured in K Tons.

11. Are there any specific market keywords associated with the report?

Yes, the market keyword associated with the report is "MCAA Market," which aids in identifying and referencing the specific market segment covered.

12. How do I determine which pricing option suits my needs best?

The pricing options vary based on user requirements and access needs. Individual users may opt for single-user licenses, while businesses requiring broader access may choose multi-user or enterprise licenses for cost-effective access to the report.

13. Are there any additional resources or data provided in the MCAA Market report?

While the report offers comprehensive insights, it's advisable to review the specific contents or supplementary materials provided to ascertain if additional resources or data are available.

14. How can I stay updated on further developments or reports in the MCAA Market?

To stay informed about further developments, trends, and reports in the MCAA Market, consider subscribing to industry newsletters, following relevant companies and organizations, or regularly checking reputable industry news sources and publications.


Methodology

Step 1 - Identification of Relevant Samples Size from Population Database

Step Chart
Bar Chart
Method Chart

Step 2 - Approaches for Defining Global Market Size (Value, Volume* & Price*)

Approach Chart
Top-down and bottom-up approaches are used to validate the global market size and estimate the market size for manufactures, regional segments, product, and application.

Note*: In applicable scenarios

Step 3 - Data Sources

Primary Research

  • Web Analytics
  • Survey Reports
  • Research Institute
  • Latest Research Reports
  • Opinion Leaders

Secondary Research

  • Annual Reports
  • White Paper
  • Latest Press Release
  • Industry Association
  • Paid Database
  • Investor Presentations
Analyst Chart

Step 4 - Data Triangulation

Involves using different sources of information in order to increase the validity of a study

These sources are likely to be stakeholders in a program - participants, other researchers, program staff, other community members, and so on.

Then we put all data in single framework & apply various statistical tools to find out the dynamic on the market.

During the analysis stage, feedback from the stakeholder groups would be compared to determine areas of agreement as well as areas of divergence

Additionally, after gathering mixed and scattered data from a wide range of sources, data is triangulated and correlated to come up with estimated figures which are further validated through primary mediums or industry experts, opinion leaders.

About Report Pinnacle

Report Pinnacle provides top-tier market research, industry intelligence, and actionable insights for finance, technology, healthcare, and consumer sectors. Our reports empower you to make informed decisions and achieve business success.

Our expert team combines primary research, data analytics, and industry knowledge to deliver insights you can trust. We offer syndicated reports, custom research, and consulting services tailored to your unique business needs.

At Report Pinnacle, we are committed to quality, transparency, and client satisfaction. Every report is rigorously validated to ensure accuracy and relevance. Our global perspective and local expertise help you understand both broad trends and detailed market shifts.

Stay ahead with Report Pinnacle. Subscribe to our newsletter for the latest insights and research highlights, and follow us on social media for real-time updates.

Report Pinnacle – Your Partner for Reaching the Top in Market Intelligence.

artwork spiralartwork spiralRelated Reports
artwork underline

Surfactants Market Report 2025: Growth Driven by Government Incentives and Partnerships

Discover the latest trends and growth opportunities in the booming surfactants market. This comprehensive analysis reveals key drivers, restraints, and regional market shares, along with projections to 2033. Explore market segmentation by type and application, and learn about leading companies shaping the future of this vital industry.

September 2025
Base Year: 2024
No Of Pages: 234
Price: $4750

Polyethyleneimine Market Market’s Consumer Preferences: Trends and Analysis 2025-2033

Discover the latest trends and insights into the Polyethyleneimine (PEI) market, projected to reach [estimated 2033 value based on CAGR] by 2033. This comprehensive analysis covers market size, CAGR, regional breakdowns (North America, Europe, Asia-Pacific), key applications (water treatment, adhesives), and leading companies. Learn more about this growing market and its future potential.

September 2025
Base Year: 2024
No Of Pages: 234
Price: $4750

Growth Roadmap for Resorbable Polymers Market Market 2025-2033

The resorbable polymers market is booming, projected to exceed $5 billion by 2033, driven by advancements in drug delivery and orthopedics. Explore key trends, leading companies, and regional growth forecasts in this comprehensive market analysis.

September 2025
Base Year: 2024
No Of Pages: 180
Price: $4750

Engineering Plastic Industry Comprehensive Market Study: Trends and Predictions 2025-2033

Discover the booming engineering plastics market! This comprehensive analysis explores key trends, growth drivers, and restraints impacting the industry, segmented by resin type and end-user. Learn about leading companies and regional market share projections for 2025-2033.

September 2025
Base Year: 2024
No Of Pages: 197
Price: $3800

Seals Industry 2025-2033 Overview: Trends, Competitor Dynamics, and Opportunities

The global seals industry is booming, projected to reach [estimated 2033 market size] by 2033 with a CAGR exceeding 4%. Discover key market trends, regional insights, leading companies (Trelleborg, Freudenberg, SKF), and the impact of automotive, oil & gas, and industrial automation on this dynamic sector.

September 2025
Base Year: 2024
No Of Pages: 150
Price: $4750

High Performance Foam Market Market’s Consumer Preferences: Trends and Analysis 2025-2033

Discover the booming high-performance foam market, projected to reach $XX billion by 2033 with a CAGR exceeding 8%. This in-depth analysis covers market drivers, trends, restraints, segmentation (silicone, polyurethane, etc.), key players (Solvay, 3M, BASF), and regional growth. Explore the future of high-performance foams in construction, transportation, and healthcare.

September 2025
Base Year: 2024
No Of Pages: 150
Price: $4750

Charting Thin Insulation Market Growth: CAGR Projections for 2025-2033

Discover the booming thin insulation market! This comprehensive analysis reveals a CAGR >5%, driven by energy efficiency mandates & advancements in aerogels & plastic foams. Explore market size, segmentation, key players (Dow, BASF, 3M), and regional trends through 2033.

September 2025
Base Year: 2024
No Of Pages: 234
Price: $4750

Exploring United States Non-Woven Fabric Market Market Disruption and Innovation

Discover the booming US non-woven fabric market! Explore key drivers, trends, and restraints shaping this $10 Billion+ industry (2025 est.), including insights into spunbond, polyester, and polypropylene segments. Learn about major players and future growth projections through 2033.

September 2025
Base Year: 2024
No Of Pages: 150
Price: $3800

Proppants Industry Comprehensive Market Study: Trends and Predictions 2025-2033

Discover the booming proppants market analysis for 2025-2033. This in-depth report reveals key trends, CAGR projections, and regional market share for proppants used in hydraulic fracturing, offering valuable insights for investors and industry professionals. Explore the impact of oil prices, technological advancements, and environmental regulations.

September 2025
Base Year: 2024
No Of Pages: 234
Price: $4750

United Arab Emirates Protective Coatings Market Future-proof Strategies: Trends, Competitor Dynamics, and Opportunities 2025-2033

The UAE protective coatings market is booming, projected to surpass $83 million by 2033, driven by infrastructure development and technological advancements. Discover key trends, market segmentation, and leading players in this lucrative sector. Explore growth opportunities in waterborne, epoxy, and polyurethane coatings for oil & gas, construction, and power industries.

September 2025
Base Year: 2024
No Of Pages: 180
Price: $3800

Exploring Growth Patterns in Germany Water Treatment Market Market

Discover the booming German water treatment market! Explore key trends, drivers, and restraints shaping this €[estimated value] industry, projected to grow at a CAGR exceeding 4% until 2033. Learn about leading companies and key segments.

September 2025
Base Year: 2024
No Of Pages: 197
Price: $3800

Specialty Gas Market: Harnessing Emerging Innovations for Growth 2025-2033

The specialty gas market is booming, projected to exceed a 4% CAGR through 2033, driven by electronics, automotive, and healthcare advancements. This comprehensive analysis explores market size, key players (Air Products, Linde, Air Liquide), regional trends, and future growth opportunities in high-purity gases, noble gases, and more.

September 2025
Base Year: 2024
No Of Pages: 180
Price: $4750

GCC Cement Market XX CAGR Growth Analysis 2025-2033

The GCC cement market is booming, with a CAGR exceeding 4.5% through 2033. Driven by massive infrastructure projects and urbanization, this report analyzes market size, segmentation (Portland, blended, residential, commercial), key players (Cemex, Holcim), and regional trends in Saudi Arabia, UAE, Qatar, Oman, Kuwait, and Bahrain. Discover growth opportunities in this dynamic market.

September 2025
Base Year: 2024
No Of Pages: 234
Price: $4750

Car Oil in Spain Market Market Overview: Growth and Insights

Discover the latest insights into the dynamic Spanish car oil market. Explore market size, growth trends (CAGR 2.08%), key players (Castrol, Shell, Repsol), and future projections to 2033. Learn about the impact of consumer behavior, economic factors, and environmental regulations on this competitive sector.

September 2025
Base Year: 2024
No Of Pages: 197
Price: $3800

BTX Industry Decade Long Trends, Analysis and Forecast 2025-2033

The BTX market (Benzene, Toluene, Xylene) is booming, with a CAGR exceeding 4% and projected to reach $XX million by 2033. Driven by rising petrochemical demand and economic growth in Asia-Pacific, this detailed analysis explores market trends, key players (Shell, ExxonMobil, Sinopec), and regional growth forecasts. Discover insights into BTX applications, segment performance, and future market potential.

September 2025
Base Year: 2024
No Of Pages: 234
Price: $4750

Anhydrous AlCl3 Market Innovations Shaping Market Growth 2025-2033

Discover the booming anhydrous aluminum chloride market! Explore key drivers, trends, and restraints impacting this $1.5B+ market, segmented by form (powder, granules, crystals) and application (pharmaceuticals, pesticides, more). Learn about leading companies and regional growth projections through 2033.

September 2025
Base Year: 2024
No Of Pages: 234
Price: $4750

Argentina Passenger Vehicles Lubricants Market Insights: Market Size Analysis to 2033

Discover the latest insights into Argentina's passenger vehicle lubricants market. This comprehensive analysis reveals a steady growth trajectory (CAGR 2.51%), driven by automotive industry expansion and consumer demand. Explore market segmentation, key players, and future growth projections (2025-2033).

September 2025
Base Year: 2024
No Of Pages: 197
Price: $3800

Exploring Barriers in Dry Mix Mortar Market Market: Trends and Analysis 2025-2033

Discover the booming Dry Mix Mortar market! Explore key trends, growth drivers, and competitive landscape analysis from 2019-2033. Learn about regional market share, leading companies (Holcim, Sika, etc.), and the impact of sustainability. Invest in future-proof construction materials.

September 2025
Base Year: 2024
No Of Pages: 180
Price: $3800

Germany Automotive Engine Oil Industry: Disruptive Technologies Driving Market Growth 2025-2033

Discover the latest trends and insights into the booming German automotive engine oil market. Explore market size, growth projections (CAGR 1.29%), key players (Castrol, Chevron, ExxonMobil), and future opportunities within this €1.5 billion industry. Learn about segment performance and the impact of new technologies.

September 2025
Base Year: 2024
No Of Pages: 197
Price: $3800

North America Compressor Oil Market Market Expansion Strategies

The North American compressor oil market is poised for steady growth, driven by industrial expansion and technological advancements. Learn about market size, CAGR, key players, and future trends in this comprehensive analysis. Discover insights into the segmentation by base oil type and end-user industries.

September 2025
Base Year: 2024
No Of Pages: 180
Price: $4750

Water-borne Adhesives Market Market Expansion Strategies

Discover the booming water-borne adhesives market, projected to exceed a 5% CAGR through 2033. This comprehensive analysis explores market size, key drivers (sustainability, innovation), restraints, regional trends (Asia-Pacific leading the charge), and leading companies. Learn about the expanding applications across building & construction, packaging, and more.

September 2025
Base Year: 2024
No Of Pages: 150
Price: $4750

Europe Gypsum Board Market Comprehensive Market Study: Trends and Predictions 2025-2033

Discover the booming European gypsum board market! This in-depth analysis reveals a CAGR exceeding 5%, driven by construction growth and sustainability trends. Explore key players, regional breakdowns, and future forecasts for 2025-2033. Learn about market segments, drivers, and restraints impacting wall board, ceiling board, and pre-decorated board sales.

September 2025
Base Year: 2024
No Of Pages: 234
Price: $4750

Strategic Insights for SCC Market Market Growth

Discover the booming Self-Consolidating Concrete (SCC) market! Explore its 5%+ CAGR, key drivers like infrastructure development & precast concrete, and leading players like UltraTech & LafargeHolcim. This in-depth analysis forecasts market trends to 2033, covering regional breakdowns and key applications.

September 2025
Base Year: 2024
No Of Pages: 234
Price: $4750

Future-Ready Strategies for Epoxy Powder Coatings Market Market Growth

Discover the booming epoxy powder coatings market! This comprehensive analysis reveals key trends, drivers, and restraints shaping the industry's growth through 2033, including regional insights and leading companies. Explore market size, CAGR, and segmentation data for protective coatings, automotive, aerospace, and construction applications.

September 2025
Base Year: 2024
No Of Pages: 234
Price: $4750

India Floor Coatings Market Market Predictions and Opportunities 2025-2033

Discover the booming India floor coatings market! This comprehensive analysis reveals a ₹14940 million market in 2025, projecting a CAGR exceeding 7% through 2033. Explore key drivers, trends, and segmentation data including epoxy, polyurethane, and other coatings across residential, commercial, and industrial sectors. Learn about leading players like Asian Paints and Sherwin-Williams.

September 2025
Base Year: 2024
No Of Pages: 180
Price: $3800

Strategic Vision for Middle-East and Africa Thermal Spray Market Industry Trends

The Middle East & Africa thermal spray market is booming, projected to reach \$16.54 billion by 2033, driven by aerospace, automotive, and energy sectors. Discover key trends, restraints, and leading companies shaping this high-growth market.

September 2025
Base Year: 2024
No Of Pages: 180
Price: $4750

Opportunities in Ion Exchange Membrane Market Market 2025-2033

The global ion exchange membrane market is booming, driven by water treatment, renewable energy, and battery technology advancements. Explore market size, CAGR, key players, and regional trends in this comprehensive analysis projecting to 2033. Discover lucrative investment opportunities in this rapidly expanding sector.

September 2025
Base Year: 2024
No Of Pages: 150
Price: $4750

Unlocking the Future of APAC Paints & Coatings Additives Industry: Growth and Trends 2025-2033

Discover the booming APAC paints & coatings additives market! This in-depth analysis reveals a CAGR exceeding 6%, driven by construction, automotive, and sustainability trends. Learn about key players, regional breakdowns (China, India, Japan, etc.), and future growth projections to 2033.

September 2025
Base Year: 2024
No Of Pages: 180
Price: $4750

C9 Resin Market CAGR Growth Drivers and Trends: Forecasts 2025-2033

Discover the booming C9 resin market! Explore our comprehensive analysis projecting significant growth through 2033, driven by key applications and technological advancements. Learn about market size, CAGR, and regional trends in this detailed report.

September 2025
Base Year: 2024
No Of Pages: 180
Price: $4750

Analyzing Competitor Moves: Brazil Bioplastics Market Growth Outlook 2025-2033

Discover the booming Brazil bioplastics market! This comprehensive analysis reveals a CAGR of 12.80%, driven by sustainability concerns and government initiatives. Explore market size, key players (Novamont, Arkema, Braskem), segments, and future trends in bio-based biodegradable and non-biodegradable plastics in Brazil (2019-2033).

September 2025
Base Year: 2024
No Of Pages: 120
Price: $3800

Dry Mix Mortar Additives and Chemicals Market Industry Growth Trends and Analysis

Discover the booming Dry Mix Mortar Additives & Chemicals market! This comprehensive analysis reveals a CAGR of 4.52%, driven by construction growth and sustainable building trends. Explore market segmentation, key players (Nouryon, BASF, Sika), and regional insights (Asia-Pacific leading). Project your business strategy with our detailed forecast to 2033.

September 2025
Base Year: 2024
No Of Pages: 150
Price: $4750

Market Deep Dive: Exploring Betaine Market Trends 2025-2033

Discover the booming Betaine Market analysis! Explore key trends, drivers, and restraints impacting this $XX million industry, featuring insights on Betaine Anhydrous, Monohydrate, and HCl forms, across food, animal feed, and personal care applications. Growth projections to 2033 reveal lucrative investment opportunities.

August 2025
Base Year: 2024
No Of Pages: 150
Price: $4750

Acetylene Industry Market Report: Trends and Growth

Discover the latest insights into the $11.38B Acetylene market. Explore growth drivers, regional trends (Asia Pacific leading), key players (Linde, Air Products), and future forecasts (2.54% CAGR) to 2033. Understand the impact of metal working, chemical applications, and emerging technologies on this vital industry.

August 2025
Base Year: 2024
No Of Pages: 180
Price: $4750

Norway Lubricants Market in Developing Economies: Trends and Growth Analysis 2025-2033

Discover the latest insights into the Norway lubricants market. This comprehensive analysis reveals steady growth driven by automotive, marine, and industrial sectors, alongside market trends, key players (BP Castrol, ExxonMobil, Shell), and future projections to 2033. Explore market size, CAGR, and regional dynamics.

August 2025
Base Year: 2024
No Of Pages: 197
Price: $3800

South Korea Passenger Vehicles Lubricants Market Market’s Tech Revolution: Projections to 2033

Discover the booming South Korea passenger vehicle lubricants market! This in-depth analysis reveals a $250 million market in 2025, projected to reach over $350 million by 2033, driven by increasing vehicle numbers and demand for high-performance lubricants. Explore market trends, key players (ExxonMobil, Shell, Castrol, GS Caltex), and growth opportunities.

August 2025
Base Year: 2024
No Of Pages: 180
Price: $3800

Isophthalic Acid Industry Market Report: Trends and Growth

Discover the booming Isophthalic Acid market! This comprehensive analysis reveals a CAGR exceeding 4%, driven by PET packaging, construction, and technological advancements. Explore regional trends, key players (Shell, Honeywell, etc.), and future growth projections for the period 2025-2033. Get insights into market segmentation and key challenges.

August 2025
Base Year: 2024
No Of Pages: 180
Price: $4750

Ferroboron Market Charting Growth Trajectories 2025-2033: Strategic Insights and Forecasts

The Ferroboron Market is booming, with a CAGR exceeding 5.50% through 2033. Driven by automotive, construction, and steel advancements, this report analyzes market size, regional shares (North America, Europe, Asia-Pacific), key players (AMPERRE alloys, CRONIMET), and future trends. Discover insights into this high-growth sector.

August 2025
Base Year: 2024
No Of Pages: 234
Price: $4750

Unlocking Insights for Green Hydrogen Market Growth Strategies

The green hydrogen market is booming, with a CAGR exceeding 60% and a projected value of $3.28 billion in 2025. Learn about key drivers, trends, restraints, and regional market share in this comprehensive analysis, covering major players and future forecasts to 2033. Discover the opportunities and challenges in this rapidly expanding sector of the renewable energy market.

August 2025
Base Year: 2024
No Of Pages: 180
Price: $4750

Carbon Fiber Market Market Analysis and Forecasts

The global carbon fiber market is booming, projected to reach $42.9 Billion by 2033 with a 10.05% CAGR. Driven by aerospace, renewable energy, and automotive sectors, this detailed market analysis explores key trends, restraints, and leading companies shaping this high-growth industry.

August 2025
Base Year: 2024
No Of Pages: 234
Price: $4750

Deep Dive into Bromine Industry: Comprehensive Growth Analysis 2025-2033

Discover the booming bromine market forecast to 2033! This in-depth analysis reveals a CAGR of 5%, driven by flame retardants, biocides, and energy storage. Explore key players, regional trends, and market segmentation for organobromines, bromide salts, and more. Get your free market report now!

August 2025
Base Year: 2024
No Of Pages: 180
Price: $3,950

Future Trends Shaping Viscosity Reducing Agents Market Growth

Discover the booming viscosity reducing agents market! Our comprehensive analysis reveals a CAGR of 5.68% to 2033, driven by oil & gas, paints & coatings, and plastics industries. Explore key players, regional trends, and future growth projections in this detailed market report.

August 2025
Base Year: 2024
No Of Pages: 180
Price: $3,950

Europe Protective Coatings Market Projected to Grow at XX CAGR: Insights and Forecasts 2025-2033

The European Protective Coatings Market is booming, projected to surpass €20 billion by 2033, driven by infrastructure growth and eco-friendly regulations. Explore market trends, key players (Akzo Nobel, BASF, PPG), and regional analysis in this comprehensive report.

August 2025
Base Year: 2024
No Of Pages: 180
Price: $4750

Emerging Markets for Indonesia Lubricant Market Industry

Discover the booming Indonesian lubricant market forecast to 2033! This in-depth analysis reveals market size, CAGR, key drivers, trends, restraints, and leading companies like Castrol and Shell. Explore regional breakdowns and future growth opportunities in this dynamic sector.

August 2025
Base Year: 2024
No Of Pages: 197
Price: $3800

Exploring Ethyl Levulinate Market Market Ecosystem: Insights to 2033

Discover the booming Ethyl Levulinate market! This comprehensive analysis reveals a CAGR exceeding 3%, driven by soaring demand in food, fragrance, and pharmaceutical applications. Explore market size, key players, regional trends, and future growth projections from 2025-2033.

August 2025
Base Year: 2024
No Of Pages: 234
Price: $4750

Aramid Fiber Market Market Report: Trends and Growth

Discover the booming aramid fiber market! This comprehensive analysis reveals a CAGR exceeding 4%, driven by aerospace, automotive, and construction sectors. Explore market trends, key players (DuPont, Teijin, Kolon), and future growth projections for 2025-2033. Learn about regional market shares and emerging opportunities in this high-growth industry.

August 2025
Base Year: 2024
No Of Pages: 234
Price: $4750

Diamond Wire Market Future-Proof Strategies: Market Trends 2025-2033

Discover the booming diamond wire market! This comprehensive analysis reveals a CAGR exceeding 10%, driven by solar, semiconductor, and construction applications. Explore market trends, key players (Dellas S p A, Logomatic GmbH, etc.), and regional insights (Asia Pacific leading) for the period 2019-2033. Get your free report now!

August 2025
Base Year: 2024
No Of Pages: 234
Price: $4750

Europe Automotive Coatings Market Market’s Decade-Long Growth Trends and Future Projections 2025-2033

Discover the latest insights into the booming European automotive coatings market. This comprehensive analysis reveals a €4.96 billion market in 2025, projected to grow at a 3% CAGR until 2033, driven by factors like increasing vehicle production and demand for sustainable coatings. Explore market trends, key players (Sherwin-Williams, PPG, BASF), and regional variations impacting this dynamic sector.

August 2025
Base Year: 2024
No Of Pages: 180
Price: $4750

Emerging Markets Driving Bulgaria Passenger Vehicles Lubricants Market Growth

Discover the growth potential of the Bulgarian passenger vehicle lubricants market. This comprehensive analysis reveals market size, CAGR, key players (ExxonMobil, Shell, Castrol, Motul etc.), market trends, and future projections through 2033. Learn about the leading segments (engine oils, greases, etc.) and unlock valuable insights for investment and business strategies.

August 2025
Base Year: 2024
No Of Pages: 180
Price: $3800

Opacifiers Market Market Growth Fueled by CAGR to XXX Million by 2033

Discover the booming opacifiers market! This in-depth analysis reveals a $XX million market with a 4%+ CAGR, driven by construction, paints & coatings, and personal care. Explore key trends, regional insights, and leading companies like Tronox and Kronos.

August 2025
Base Year: 2024
No Of Pages: 150
Price: $4750

Brazil Lubricants Industry 2025-2033 Trends and Competitor Dynamics: Unlocking Growth Opportunities

Discover the dynamic Brazil lubricants market. This in-depth analysis reveals key trends, growth drivers, and challenges for 2025-2033, highlighting leading companies and regional market share. Explore the opportunities and risks in this expanding $5 billion market.

August 2025
Base Year: 2024
No Of Pages: 197
Price: $3800
  • Home
  • About Us
  • Industries
    • Aerospace & Defense
    • Agriculture
    • Animal Nutrition & Wellness
    • Automotive
    • Chemicals & Materials
    • Consumer Goods and Services
    • Energy & Power
    • Financial Services and Investment Intelligence
    • Food & Beverage
    • Home and Property Improvement
    • Hospitality and Tourism
    • Logistics
    • Manufacturing Products and Services
    • Packaging
    • Professional and Commercial Services
    • Real Estate and Construction
    • Retail
    • Technology, Media and Telecom
    • Healthcare
  • Services
  • Contact
Main Logo
  • Home
  • About Us
  • Industries
    • Aerospace & Defense
    • Agriculture
    • Animal Nutrition & Wellness
    • Automotive
    • Chemicals & Materials
    • Consumer Goods and Services
    • Energy & Power
    • Financial Services and Investment Intelligence
    • Food & Beverage
    • Home and Property Improvement
    • Hospitality and Tourism
    • Logistics
    • Manufacturing Products and Services
    • Packaging
    • Professional and Commercial Services
    • Real Estate and Construction
    • Retail
    • Technology, Media and Telecom
    • Healthcare
  • Services
  • Contact
+17162654855
[email protected]

+17162654855

[email protected]

Business Address

Head Office

Ansec House 3 rd floor Tank Road, Yerwada, Pune, Maharashtra 411014

Contact Information

Craig Francis

Business Development Head

+17162654855

[email protected]

Secure Payment Partners

payment image
RetailLogisticsPackagingAutomotiveHealthcareAgricultureEnergy & PowerFood & BeverageAerospace & DefenseChemicals & MaterialsHospitality and TourismAnimal Nutrition & WellnessConsumer Goods and ServicesReal Estate and ConstructionHome and Property ImprovementTechnology, Media and TelecomManufacturing Products and ServicesFinancial Services and Investment Intelligence

© 2025 PRDUA Research & Media Private Limited, All rights reserved

Privacy Policy
Terms and Conditions
FAQ