

Key Insights
The Middle East and Africa (MEA) Energy Management Systems (EMS) market is poised for significant expansion, driven by escalating energy demand, stringent energy efficiency regulations, and the widespread adoption of smart technologies. The market, currently valued at $60.61 billion in the base year 2025, is projected to grow at a Compound Annual Growth Rate (CAGR) of 12.7% from 2025 to 2033. This growth is underpinned by increasing industrialization and urbanization, leading to higher energy consumption and a critical need for efficient EMS. Governments across the MEA region are actively promoting energy efficiency and security through supportive policies and incentives, particularly for smart city initiatives and renewable energy integration. Technological advancements and improved affordability of EMS solutions, including cloud-based platforms and advanced data analytics, are enhancing accessibility for a broader user base. Key growth segments include Building Energy Management Systems (BEMS) and Factory Energy Management Systems (FEMS), fueled by the expansion of commercial and industrial infrastructure. Leading companies are investing in R&D, product development, and strategic alliances to capture this market potential. Despite potential challenges like initial investment costs and varying levels of awareness, the compelling long-term benefits of reduced energy consumption and enhanced operational efficiency are expected to drive sustained market growth.
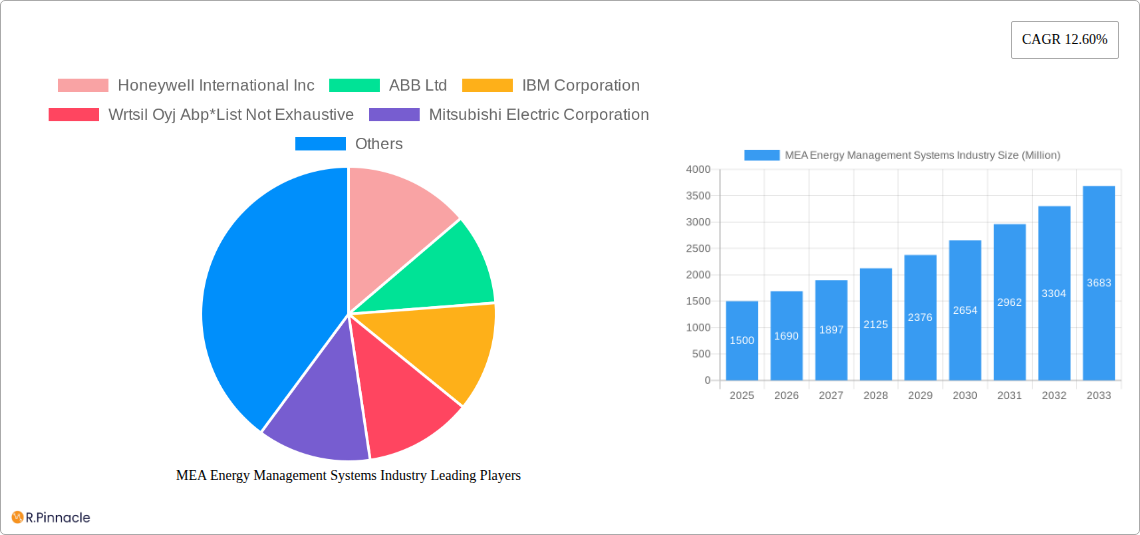
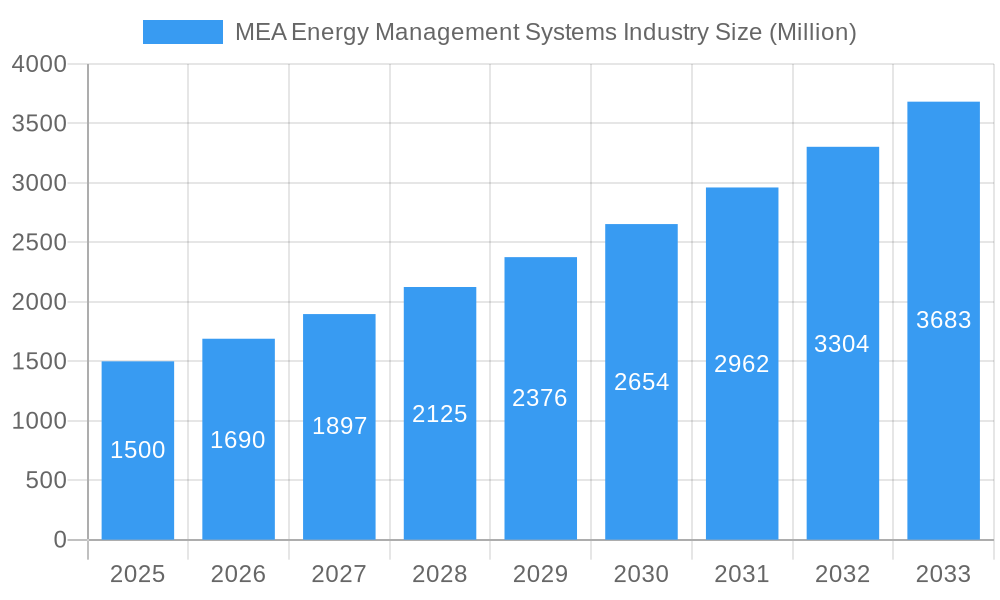
MEA Energy Management Systems Industry Market Size (In Billion)
The MEA EMS market is segmented by solution type (hardware, software, services), system type (HEMS, BEMS, FEMS), end-user industry (manufacturing, power & energy, IT & telecom, healthcare, corporate, others), and geography (UAE, Saudi Arabia, South Africa, Rest of MEA). The UAE and Saudi Arabia are anticipated to lead market growth due to substantial infrastructure investments and economic diversification efforts. However, significant growth opportunities exist across other MEA nations as awareness and adoption of advanced EMS technologies increase. The market landscape is competitive, featuring both global and regional players. Future expansion will be shaped by technological innovations such as AI-driven optimization, the integration of renewable energy sources, and a growing emphasis on regional sustainability and environmental responsibility. Continuous advancements in predictive maintenance and energy-efficient building designs will further contribute to market growth.
MEA Energy Management Systems Industry Company Market Share
MEA Energy Management Systems Industry Report: 2019-2033
This comprehensive report provides an in-depth analysis of the Middle East and Africa (MEA) Energy Management Systems (EMS) industry, offering valuable insights for industry professionals, investors, and strategic decision-makers. The report covers the period from 2019 to 2033, with a focus on the estimated year 2025. The market is segmented by solution type, energy management system type, end-user industry, and country, providing a granular view of this dynamic sector. Key players like Honeywell International Inc, ABB Ltd, IBM Corporation, Wärtsilä Oyj Abp, Mitsubishi Electric Corporation, Cisco Systems Inc, Siemens AG, Schneider Electric SE, Rockwell Automation Inc, and Eaton Corporation are analyzed for their market share and strategic moves. The report's projected market value exceeds $XX Million by 2033.
MEA Energy Management Systems Industry Market Structure & Innovation Trends
The MEA EMS market exhibits a moderately concentrated structure, with a few major players holding significant market share. However, the presence of numerous smaller, specialized firms fosters competition and innovation. Market share data for 2024 indicates that the top 5 players collectively hold approximately 60% of the market, with Honeywell International Inc and Siemens AG leading the pack. The overall market is valued at approximately $XX Million in 2024.
Innovation is driven by factors such as increasing energy costs, stringent government regulations promoting energy efficiency, and the growing adoption of smart technologies. The regulatory landscape is evolving, with various countries in the MEA region implementing policies to encourage the adoption of EMS solutions. Product substitutes include traditional energy management practices, but the advantages of sophisticated EMS solutions in terms of cost savings and efficiency are driving market growth. End-user demographics are shifting, with a growing emphasis on sustainability and technological advancements influencing purchasing decisions.
M&A activity has been moderate in recent years, with deal values ranging from $XX Million to $XX Million. Notable transactions include strategic partnerships to expand market reach and product offerings.
- Market Concentration: Moderately concentrated, with top 5 players holding ~60% market share (2024).
- Innovation Drivers: Rising energy costs, stringent regulations, smart technology adoption.
- M&A Activity: Moderate, with deal values between $XX Million and $XX Million.
MEA Energy Management Systems Industry Market Dynamics & Trends
The MEA EMS market is experiencing robust growth, driven by factors such as increasing urbanization, industrialization, and the growing adoption of smart buildings and factories. The compound annual growth rate (CAGR) is projected to be approximately XX% during the forecast period (2025-2033). This growth is fueled by technological disruptions, such as the Internet of Things (IoT), artificial intelligence (AI), and cloud computing, which are enhancing the capabilities and functionalities of EMS solutions. Consumer preferences are shifting towards energy-efficient and sustainable solutions, driving demand for advanced EMS systems. Competitive dynamics are shaped by factors such as product differentiation, pricing strategies, and technological advancements. Market penetration rates for various EMS solutions are gradually increasing across different end-user industries, indicating a strong trajectory for future growth.
Dominant Regions & Segments in MEA Energy Management Systems Industry
The United Arab Emirates (UAE) and Saudi Arabia represent the most dominant regions within the MEA EMS market, driven by significant investments in infrastructure development and smart city initiatives. South Africa also displays promising growth potential.
- By Solution Type: The software segment is expected to dominate, driven by increasing demand for advanced analytics and remote monitoring capabilities.
- By Type of Energy Management System: Building Energy Management Systems (BEMS) hold a significant share, fueled by the growing construction sector.
- By End-User Industry: The manufacturing and power & energy sectors are key drivers, with high energy consumption and a strong focus on efficiency improvements.
- By Country: The UAE and Saudi Arabia lead due to their economic development and large-scale infrastructure projects. South Africa shows high growth potential due to increased investment in renewable energy infrastructure.
Key drivers include favorable government policies promoting energy efficiency, expanding infrastructure development, and increasing adoption of smart technologies. The dominance of specific regions and segments is attributed to a combination of economic factors, infrastructure development, and government initiatives to encourage energy efficiency.
MEA Energy Management Systems Industry Product Innovations
Recent years have witnessed significant product innovations in the MEA EMS market, driven by technological advancements such as IoT, AI, and cloud computing. New products offer advanced features, including predictive maintenance, real-time energy monitoring, and enhanced energy optimization capabilities. These innovations provide competitive advantages by improving energy efficiency, reducing operational costs, and enhancing overall system performance. The market is witnessing increased integration of renewable energy sources into EMS solutions, aligning with global sustainability goals and responding to growing consumer demand for environmentally friendly technologies.
Report Scope & Segmentation Analysis
This report provides a comprehensive analysis of the MEA EMS market, segmented by solution type (hardware, software, services), type of energy management system (HEMS, BEMS, FEMS), end-user industry (manufacturing, power and energy, IT & Telecom, healthcare, corporate, others), and country (UAE, Saudi Arabia, South Africa, Rest of MEA). Each segment's growth projections, market size, and competitive dynamics are thoroughly analyzed. The report offers detailed market sizing, forecasting, and growth projections based on historical data and current trends.
Key Drivers of MEA Energy Management Systems Industry Growth
The MEA EMS market's growth is primarily driven by increasing energy costs, stringent government regulations promoting energy efficiency, and rapid urbanization and industrialization. Governments across the region are actively investing in smart city initiatives, creating significant demand for advanced EMS solutions. Technological advancements, including the proliferation of IoT devices and cloud computing, are also significantly contributing to market growth.
Challenges in the MEA Energy Management Systems Industry Sector
Challenges include high initial investment costs for EMS implementation, the complexity of integrating different systems, and a potential skills gap in deploying and maintaining these systems. Regulatory hurdles in some countries might also hinder faster adoption. Supply chain disruptions and fluctuating raw material prices can negatively affect market dynamics. Intense competition from established and emerging players can impact profitability margins.
Emerging Opportunities in MEA Energy Management Systems Industry
Significant opportunities exist in leveraging renewable energy integration with EMS, enhancing cybersecurity features in systems, and developing tailored solutions for specific industries. Expanding into less penetrated markets in the region presents notable potential. Focus on developing energy efficiency solutions aligned with the sustainability goals of various nations presents a large untapped opportunity.
Leading Players in the MEA Energy Management Systems Industry Market
- Honeywell International Inc
- ABB Ltd
- IBM Corporation
- Wärtsilä Oyj Abp
- Mitsubishi Electric Corporation
- Cisco Systems Inc
- Siemens AG
- Schneider Electric SE
- Rockwell Automation Inc
- Eaton Corporation
Key Developments in MEA Energy Management Systems Industry
- March 2021: Rockwell Automation partners with Precast FZCO to expand software solutions across the Middle East.
- September 2020: Schneider Electric SE launches "EcoStruxure," a cloud-based EMS.
Future Outlook for MEA Energy Management Systems Industry Market
The MEA EMS market is poised for sustained growth, driven by increasing investment in renewable energy infrastructure, supportive government policies, and rising demand for smart and sustainable solutions. Strategic partnerships, technological advancements, and focus on delivering customized solutions will further shape the market's trajectory. The market is anticipated to witness a significant surge in demand for advanced analytics and predictive maintenance capabilities, with the integration of AI and machine learning expected to play a key role.
MEA Energy Management Systems Industry Segmentation
-
1. Solution Type
- 1.1. Hardware
- 1.2. Software
- 1.3. Services
-
2. Type of Energy Management System
- 2.1. Home Energy Management System (HEMS)
- 2.2. Building Energy Management System (BEMS)
- 2.3. Factory Energy Management Systems (FEMS)
-
3. End-User Industry
- 3.1. Manufacturing
- 3.2. Power and Energy
- 3.3. IT & Telecom
- 3.4. Healthcare
- 3.5. Corporate
- 3.6. Others
MEA Energy Management Systems Industry Segmentation By Geography
-
1. North America
- 1.1. United States
- 1.2. Canada
- 1.3. Mexico
-
2. South America
- 2.1. Brazil
- 2.2. Argentina
- 2.3. Rest of South America
-
3. Europe
- 3.1. United Kingdom
- 3.2. Germany
- 3.3. France
- 3.4. Italy
- 3.5. Spain
- 3.6. Russia
- 3.7. Benelux
- 3.8. Nordics
- 3.9. Rest of Europe
-
4. Middle East & Africa
- 4.1. Turkey
- 4.2. Israel
- 4.3. GCC
- 4.4. North Africa
- 4.5. South Africa
- 4.6. Rest of Middle East & Africa
-
5. Asia Pacific
- 5.1. China
- 5.2. India
- 5.3. Japan
- 5.4. South Korea
- 5.5. ASEAN
- 5.6. Oceania
- 5.7. Rest of Asia Pacific
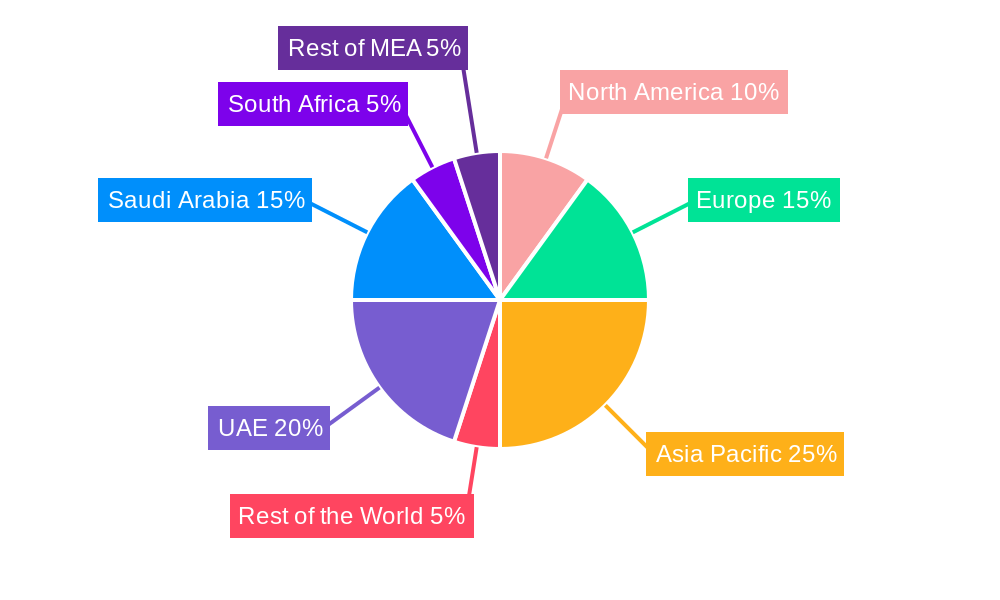
MEA Energy Management Systems Industry Regional Market Share
Geographic Coverage of MEA Energy Management Systems Industry
MEA Energy Management Systems Industry REPORT HIGHLIGHTS
| Aspects | Details |
|---|---|
| Study Period | 2020-2034 |
| Base Year | 2025 |
| Estimated Year | 2026 |
| Forecast Period | 2026-2034 |
| Historical Period | 2020-2025 |
| Growth Rate | CAGR of 12.7% from 2020-2034 |
| Segmentation |
|
Table of Contents
- 1. Introduction
- 1.1. Research Scope
- 1.2. Market Segmentation
- 1.3. Research Objective
- 1.4. Definitions and Assumptions
- 2. Executive Summary
- 2.1. Market Snapshot
- 3. Market Dynamics
- 3.1. Market Drivers
- 3.2. Market Restrains
- 3.3. Market Trends
- 3.4. Market Opportunities
- 4. Market Factor Analysis
- 4.1. Porters Five Forces
- 4.1.1. Bargaining Power of Suppliers
- 4.1.2. Bargaining Power of Buyers
- 4.1.3. Threat of New Entrants
- 4.1.4. Threat of Substitutes
- 4.1.5. Competitive Rivalry
- 4.2. PESTEL analysis
- 4.3. BCG Analysis
- 4.3.1. Stars (High Growth, High Market Share)
- 4.3.2. Cash Cows (Low Growth, High Market Share)
- 4.3.3. Question Mark (High Growth, Low Market Share)
- 4.3.4. Dogs (Low Growth, Low Market Share)
- 4.4. Ansoff Matrix Analysis
- 4.5. Supply Chain Analysis
- 4.6. Regulatory Landscape
- 4.7. Current Market Potential and Opportunity Assessment (TAM–SAM–SOM Framework)
- 4.8. PRI Analyst Note
- 4.1. Porters Five Forces
- 5. Market Analysis, Insights and Forecast 2021-2033
- 5.1. Market Analysis, Insights and Forecast - by Solution Type
- 5.1.1. Hardware
- 5.1.2. Software
- 5.1.3. Services
- 5.2. Market Analysis, Insights and Forecast - by Type of Energy Management System
- 5.2.1. Home Energy Management System (HEMS)
- 5.2.2. Building Energy Management System (BEMS)
- 5.2.3. Factory Energy Management Systems (FEMS)
- 5.3. Market Analysis, Insights and Forecast - by End-User Industry
- 5.3.1. Manufacturing
- 5.3.2. Power and Energy
- 5.3.3. IT & Telecom
- 5.3.4. Healthcare
- 5.3.5. Corporate
- 5.3.6. Others
- 5.4. Market Analysis, Insights and Forecast - by Region
- 5.4.1. North America
- 5.4.2. South America
- 5.4.3. Europe
- 5.4.4. Middle East & Africa
- 5.4.5. Asia Pacific
- 5.1. Market Analysis, Insights and Forecast - by Solution Type
- 6. Global MEA Energy Management Systems Industry Analysis, Insights and Forecast, 2021-2033
- 6.1. Market Analysis, Insights and Forecast - by Solution Type
- 6.1.1. Hardware
- 6.1.2. Software
- 6.1.3. Services
- 6.2. Market Analysis, Insights and Forecast - by Type of Energy Management System
- 6.2.1. Home Energy Management System (HEMS)
- 6.2.2. Building Energy Management System (BEMS)
- 6.2.3. Factory Energy Management Systems (FEMS)
- 6.3. Market Analysis, Insights and Forecast - by End-User Industry
- 6.3.1. Manufacturing
- 6.3.2. Power and Energy
- 6.3.3. IT & Telecom
- 6.3.4. Healthcare
- 6.3.5. Corporate
- 6.3.6. Others
- 6.1. Market Analysis, Insights and Forecast - by Solution Type
- 7. North America MEA Energy Management Systems Industry Analysis, Insights and Forecast, 2020-2032
- 7.1. Market Analysis, Insights and Forecast - by Solution Type
- 7.1.1. Hardware
- 7.1.2. Software
- 7.1.3. Services
- 7.2. Market Analysis, Insights and Forecast - by Type of Energy Management System
- 7.2.1. Home Energy Management System (HEMS)
- 7.2.2. Building Energy Management System (BEMS)
- 7.2.3. Factory Energy Management Systems (FEMS)
- 7.3. Market Analysis, Insights and Forecast - by End-User Industry
- 7.3.1. Manufacturing
- 7.3.2. Power and Energy
- 7.3.3. IT & Telecom
- 7.3.4. Healthcare
- 7.3.5. Corporate
- 7.3.6. Others
- 7.1. Market Analysis, Insights and Forecast - by Solution Type
- 8. South America MEA Energy Management Systems Industry Analysis, Insights and Forecast, 2020-2032
- 8.1. Market Analysis, Insights and Forecast - by Solution Type
- 8.1.1. Hardware
- 8.1.2. Software
- 8.1.3. Services
- 8.2. Market Analysis, Insights and Forecast - by Type of Energy Management System
- 8.2.1. Home Energy Management System (HEMS)
- 8.2.2. Building Energy Management System (BEMS)
- 8.2.3. Factory Energy Management Systems (FEMS)
- 8.3. Market Analysis, Insights and Forecast - by End-User Industry
- 8.3.1. Manufacturing
- 8.3.2. Power and Energy
- 8.3.3. IT & Telecom
- 8.3.4. Healthcare
- 8.3.5. Corporate
- 8.3.6. Others
- 8.1. Market Analysis, Insights and Forecast - by Solution Type
- 9. Europe MEA Energy Management Systems Industry Analysis, Insights and Forecast, 2020-2032
- 9.1. Market Analysis, Insights and Forecast - by Solution Type
- 9.1.1. Hardware
- 9.1.2. Software
- 9.1.3. Services
- 9.2. Market Analysis, Insights and Forecast - by Type of Energy Management System
- 9.2.1. Home Energy Management System (HEMS)
- 9.2.2. Building Energy Management System (BEMS)
- 9.2.3. Factory Energy Management Systems (FEMS)
- 9.3. Market Analysis, Insights and Forecast - by End-User Industry
- 9.3.1. Manufacturing
- 9.3.2. Power and Energy
- 9.3.3. IT & Telecom
- 9.3.4. Healthcare
- 9.3.5. Corporate
- 9.3.6. Others
- 9.1. Market Analysis, Insights and Forecast - by Solution Type
- 10. Middle East & Africa MEA Energy Management Systems Industry Analysis, Insights and Forecast, 2020-2032
- 10.1. Market Analysis, Insights and Forecast - by Solution Type
- 10.1.1. Hardware
- 10.1.2. Software
- 10.1.3. Services
- 10.2. Market Analysis, Insights and Forecast - by Type of Energy Management System
- 10.2.1. Home Energy Management System (HEMS)
- 10.2.2. Building Energy Management System (BEMS)
- 10.2.3. Factory Energy Management Systems (FEMS)
- 10.3. Market Analysis, Insights and Forecast - by End-User Industry
- 10.3.1. Manufacturing
- 10.3.2. Power and Energy
- 10.3.3. IT & Telecom
- 10.3.4. Healthcare
- 10.3.5. Corporate
- 10.3.6. Others
- 10.1. Market Analysis, Insights and Forecast - by Solution Type
- 11. Asia Pacific MEA Energy Management Systems Industry Analysis, Insights and Forecast, 2020-2032
- 11.1. Market Analysis, Insights and Forecast - by Solution Type
- 11.1.1. Hardware
- 11.1.2. Software
- 11.1.3. Services
- 11.2. Market Analysis, Insights and Forecast - by Type of Energy Management System
- 11.2.1. Home Energy Management System (HEMS)
- 11.2.2. Building Energy Management System (BEMS)
- 11.2.3. Factory Energy Management Systems (FEMS)
- 11.3. Market Analysis, Insights and Forecast - by End-User Industry
- 11.3.1. Manufacturing
- 11.3.2. Power and Energy
- 11.3.3. IT & Telecom
- 11.3.4. Healthcare
- 11.3.5. Corporate
- 11.3.6. Others
- 11.1. Market Analysis, Insights and Forecast - by Solution Type
- 12. Competitive Analysis
- 12.1. Company Profiles
- 12.1.1 Honeywell International Inc
- 12.1.1.1. Company Overview
- 12.1.1.2. Products
- 12.1.1.3. Company Financials
- 12.1.1.4. SWOT Analysis
- 12.1.2 ABB Ltd
- 12.1.2.1. Company Overview
- 12.1.2.2. Products
- 12.1.2.3. Company Financials
- 12.1.2.4. SWOT Analysis
- 12.1.3 IBM Corporation
- 12.1.3.1. Company Overview
- 12.1.3.2. Products
- 12.1.3.3. Company Financials
- 12.1.3.4. SWOT Analysis
- 12.1.4 Wrtsil Oyj Abp*List Not Exhaustive
- 12.1.4.1. Company Overview
- 12.1.4.2. Products
- 12.1.4.3. Company Financials
- 12.1.4.4. SWOT Analysis
- 12.1.5 Mitsubishi Electric Corporation
- 12.1.5.1. Company Overview
- 12.1.5.2. Products
- 12.1.5.3. Company Financials
- 12.1.5.4. SWOT Analysis
- 12.1.6 Cisco Systems Inc
- 12.1.6.1. Company Overview
- 12.1.6.2. Products
- 12.1.6.3. Company Financials
- 12.1.6.4. SWOT Analysis
- 12.1.7 Siemens AG
- 12.1.7.1. Company Overview
- 12.1.7.2. Products
- 12.1.7.3. Company Financials
- 12.1.7.4. SWOT Analysis
- 12.1.8 Schneider Electric SE
- 12.1.8.1. Company Overview
- 12.1.8.2. Products
- 12.1.8.3. Company Financials
- 12.1.8.4. SWOT Analysis
- 12.1.9 Rockwell Automation Inc
- 12.1.9.1. Company Overview
- 12.1.9.2. Products
- 12.1.9.3. Company Financials
- 12.1.9.4. SWOT Analysis
- 12.1.10 Eaton Corporation
- 12.1.10.1. Company Overview
- 12.1.10.2. Products
- 12.1.10.3. Company Financials
- 12.1.10.4. SWOT Analysis
- 12.1.1 Honeywell International Inc
- 12.2. Market Entropy
- 12.2.1 Company's Key Areas Served
- 12.2.2 Recent Developments
- 12.3. Company Market Share Analysis 2025
- 12.3.1 Top 5 Companies Market Share Analysis
- 12.3.2 Top 3 Companies Market Share Analysis
- 12.4. List of Potential Customers
- 13. Research Methodology
List of Figures
- Figure 1: Global MEA Energy Management Systems Industry Revenue Breakdown (billion, %) by Region 2025 & 2033
- Figure 2: North America MEA Energy Management Systems Industry Revenue (billion), by Solution Type 2025 & 2033
- Figure 3: North America MEA Energy Management Systems Industry Revenue Share (%), by Solution Type 2025 & 2033
- Figure 4: North America MEA Energy Management Systems Industry Revenue (billion), by Type of Energy Management System 2025 & 2033
- Figure 5: North America MEA Energy Management Systems Industry Revenue Share (%), by Type of Energy Management System 2025 & 2033
- Figure 6: North America MEA Energy Management Systems Industry Revenue (billion), by End-User Industry 2025 & 2033
- Figure 7: North America MEA Energy Management Systems Industry Revenue Share (%), by End-User Industry 2025 & 2033
- Figure 8: North America MEA Energy Management Systems Industry Revenue (billion), by Country 2025 & 2033
- Figure 9: North America MEA Energy Management Systems Industry Revenue Share (%), by Country 2025 & 2033
- Figure 10: South America MEA Energy Management Systems Industry Revenue (billion), by Solution Type 2025 & 2033
- Figure 11: South America MEA Energy Management Systems Industry Revenue Share (%), by Solution Type 2025 & 2033
- Figure 12: South America MEA Energy Management Systems Industry Revenue (billion), by Type of Energy Management System 2025 & 2033
- Figure 13: South America MEA Energy Management Systems Industry Revenue Share (%), by Type of Energy Management System 2025 & 2033
- Figure 14: South America MEA Energy Management Systems Industry Revenue (billion), by End-User Industry 2025 & 2033
- Figure 15: South America MEA Energy Management Systems Industry Revenue Share (%), by End-User Industry 2025 & 2033
- Figure 16: South America MEA Energy Management Systems Industry Revenue (billion), by Country 2025 & 2033
- Figure 17: South America MEA Energy Management Systems Industry Revenue Share (%), by Country 2025 & 2033
- Figure 18: Europe MEA Energy Management Systems Industry Revenue (billion), by Solution Type 2025 & 2033
- Figure 19: Europe MEA Energy Management Systems Industry Revenue Share (%), by Solution Type 2025 & 2033
- Figure 20: Europe MEA Energy Management Systems Industry Revenue (billion), by Type of Energy Management System 2025 & 2033
- Figure 21: Europe MEA Energy Management Systems Industry Revenue Share (%), by Type of Energy Management System 2025 & 2033
- Figure 22: Europe MEA Energy Management Systems Industry Revenue (billion), by End-User Industry 2025 & 2033
- Figure 23: Europe MEA Energy Management Systems Industry Revenue Share (%), by End-User Industry 2025 & 2033
- Figure 24: Europe MEA Energy Management Systems Industry Revenue (billion), by Country 2025 & 2033
- Figure 25: Europe MEA Energy Management Systems Industry Revenue Share (%), by Country 2025 & 2033
- Figure 26: Middle East & Africa MEA Energy Management Systems Industry Revenue (billion), by Solution Type 2025 & 2033
- Figure 27: Middle East & Africa MEA Energy Management Systems Industry Revenue Share (%), by Solution Type 2025 & 2033
- Figure 28: Middle East & Africa MEA Energy Management Systems Industry Revenue (billion), by Type of Energy Management System 2025 & 2033
- Figure 29: Middle East & Africa MEA Energy Management Systems Industry Revenue Share (%), by Type of Energy Management System 2025 & 2033
- Figure 30: Middle East & Africa MEA Energy Management Systems Industry Revenue (billion), by End-User Industry 2025 & 2033
- Figure 31: Middle East & Africa MEA Energy Management Systems Industry Revenue Share (%), by End-User Industry 2025 & 2033
- Figure 32: Middle East & Africa MEA Energy Management Systems Industry Revenue (billion), by Country 2025 & 2033
- Figure 33: Middle East & Africa MEA Energy Management Systems Industry Revenue Share (%), by Country 2025 & 2033
- Figure 34: Asia Pacific MEA Energy Management Systems Industry Revenue (billion), by Solution Type 2025 & 2033
- Figure 35: Asia Pacific MEA Energy Management Systems Industry Revenue Share (%), by Solution Type 2025 & 2033
- Figure 36: Asia Pacific MEA Energy Management Systems Industry Revenue (billion), by Type of Energy Management System 2025 & 2033
- Figure 37: Asia Pacific MEA Energy Management Systems Industry Revenue Share (%), by Type of Energy Management System 2025 & 2033
- Figure 38: Asia Pacific MEA Energy Management Systems Industry Revenue (billion), by End-User Industry 2025 & 2033
- Figure 39: Asia Pacific MEA Energy Management Systems Industry Revenue Share (%), by End-User Industry 2025 & 2033
- Figure 40: Asia Pacific MEA Energy Management Systems Industry Revenue (billion), by Country 2025 & 2033
- Figure 41: Asia Pacific MEA Energy Management Systems Industry Revenue Share (%), by Country 2025 & 2033
List of Tables
- Table 1: Global MEA Energy Management Systems Industry Revenue billion Forecast, by Solution Type 2020 & 2033
- Table 2: Global MEA Energy Management Systems Industry Revenue billion Forecast, by Type of Energy Management System 2020 & 2033
- Table 3: Global MEA Energy Management Systems Industry Revenue billion Forecast, by End-User Industry 2020 & 2033
- Table 4: Global MEA Energy Management Systems Industry Revenue billion Forecast, by Region 2020 & 2033
- Table 5: Global MEA Energy Management Systems Industry Revenue billion Forecast, by Solution Type 2020 & 2033
- Table 6: Global MEA Energy Management Systems Industry Revenue billion Forecast, by Type of Energy Management System 2020 & 2033
- Table 7: Global MEA Energy Management Systems Industry Revenue billion Forecast, by End-User Industry 2020 & 2033
- Table 8: Global MEA Energy Management Systems Industry Revenue billion Forecast, by Country 2020 & 2033
- Table 9: United States MEA Energy Management Systems Industry Revenue (billion) Forecast, by Application 2020 & 2033
- Table 10: Canada MEA Energy Management Systems Industry Revenue (billion) Forecast, by Application 2020 & 2033
- Table 11: Mexico MEA Energy Management Systems Industry Revenue (billion) Forecast, by Application 2020 & 2033
- Table 12: Global MEA Energy Management Systems Industry Revenue billion Forecast, by Solution Type 2020 & 2033
- Table 13: Global MEA Energy Management Systems Industry Revenue billion Forecast, by Type of Energy Management System 2020 & 2033
- Table 14: Global MEA Energy Management Systems Industry Revenue billion Forecast, by End-User Industry 2020 & 2033
- Table 15: Global MEA Energy Management Systems Industry Revenue billion Forecast, by Country 2020 & 2033
- Table 16: Brazil MEA Energy Management Systems Industry Revenue (billion) Forecast, by Application 2020 & 2033
- Table 17: Argentina MEA Energy Management Systems Industry Revenue (billion) Forecast, by Application 2020 & 2033
- Table 18: Rest of South America MEA Energy Management Systems Industry Revenue (billion) Forecast, by Application 2020 & 2033
- Table 19: Global MEA Energy Management Systems Industry Revenue billion Forecast, by Solution Type 2020 & 2033
- Table 20: Global MEA Energy Management Systems Industry Revenue billion Forecast, by Type of Energy Management System 2020 & 2033
- Table 21: Global MEA Energy Management Systems Industry Revenue billion Forecast, by End-User Industry 2020 & 2033
- Table 22: Global MEA Energy Management Systems Industry Revenue billion Forecast, by Country 2020 & 2033
- Table 23: United Kingdom MEA Energy Management Systems Industry Revenue (billion) Forecast, by Application 2020 & 2033
- Table 24: Germany MEA Energy Management Systems Industry Revenue (billion) Forecast, by Application 2020 & 2033
- Table 25: France MEA Energy Management Systems Industry Revenue (billion) Forecast, by Application 2020 & 2033
- Table 26: Italy MEA Energy Management Systems Industry Revenue (billion) Forecast, by Application 2020 & 2033
- Table 27: Spain MEA Energy Management Systems Industry Revenue (billion) Forecast, by Application 2020 & 2033
- Table 28: Russia MEA Energy Management Systems Industry Revenue (billion) Forecast, by Application 2020 & 2033
- Table 29: Benelux MEA Energy Management Systems Industry Revenue (billion) Forecast, by Application 2020 & 2033
- Table 30: Nordics MEA Energy Management Systems Industry Revenue (billion) Forecast, by Application 2020 & 2033
- Table 31: Rest of Europe MEA Energy Management Systems Industry Revenue (billion) Forecast, by Application 2020 & 2033
- Table 32: Global MEA Energy Management Systems Industry Revenue billion Forecast, by Solution Type 2020 & 2033
- Table 33: Global MEA Energy Management Systems Industry Revenue billion Forecast, by Type of Energy Management System 2020 & 2033
- Table 34: Global MEA Energy Management Systems Industry Revenue billion Forecast, by End-User Industry 2020 & 2033
- Table 35: Global MEA Energy Management Systems Industry Revenue billion Forecast, by Country 2020 & 2033
- Table 36: Turkey MEA Energy Management Systems Industry Revenue (billion) Forecast, by Application 2020 & 2033
- Table 37: Israel MEA Energy Management Systems Industry Revenue (billion) Forecast, by Application 2020 & 2033
- Table 38: GCC MEA Energy Management Systems Industry Revenue (billion) Forecast, by Application 2020 & 2033
- Table 39: North Africa MEA Energy Management Systems Industry Revenue (billion) Forecast, by Application 2020 & 2033
- Table 40: South Africa MEA Energy Management Systems Industry Revenue (billion) Forecast, by Application 2020 & 2033
- Table 41: Rest of Middle East & Africa MEA Energy Management Systems Industry Revenue (billion) Forecast, by Application 2020 & 2033
- Table 42: Global MEA Energy Management Systems Industry Revenue billion Forecast, by Solution Type 2020 & 2033
- Table 43: Global MEA Energy Management Systems Industry Revenue billion Forecast, by Type of Energy Management System 2020 & 2033
- Table 44: Global MEA Energy Management Systems Industry Revenue billion Forecast, by End-User Industry 2020 & 2033
- Table 45: Global MEA Energy Management Systems Industry Revenue billion Forecast, by Country 2020 & 2033
- Table 46: China MEA Energy Management Systems Industry Revenue (billion) Forecast, by Application 2020 & 2033
- Table 47: India MEA Energy Management Systems Industry Revenue (billion) Forecast, by Application 2020 & 2033
- Table 48: Japan MEA Energy Management Systems Industry Revenue (billion) Forecast, by Application 2020 & 2033
- Table 49: South Korea MEA Energy Management Systems Industry Revenue (billion) Forecast, by Application 2020 & 2033
- Table 50: ASEAN MEA Energy Management Systems Industry Revenue (billion) Forecast, by Application 2020 & 2033
- Table 51: Oceania MEA Energy Management Systems Industry Revenue (billion) Forecast, by Application 2020 & 2033
- Table 52: Rest of Asia Pacific MEA Energy Management Systems Industry Revenue (billion) Forecast, by Application 2020 & 2033
Frequently Asked Questions
1. What is the projected Compound Annual Growth Rate (CAGR) of the MEA Energy Management Systems Industry?
The projected CAGR is approximately 12.7%.
2. Which companies are prominent players in the MEA Energy Management Systems Industry?
Key companies in the market include Honeywell International Inc, ABB Ltd, IBM Corporation, Wrtsil Oyj Abp*List Not Exhaustive, Mitsubishi Electric Corporation, Cisco Systems Inc, Siemens AG, Schneider Electric SE, Rockwell Automation Inc, Eaton Corporation.
3. What are the main segments of the MEA Energy Management Systems Industry?
The market segments include Solution Type, Type of Energy Management System, End-User Industry.
4. Can you provide details about the market size?
The market size is estimated to be USD 60.61 billion as of 2022.
5. What are some drivers contributing to market growth?
Increasing Usage of Smart Grids and Smart Meters; Government Support Towards Energy Efficiancy.
6. What are the notable trends driving market growth?
Demand for Home Energy Management Systems is on the rise.
7. Are there any restraints impacting market growth?
Concerns Regarding Data Security.
8. Can you provide examples of recent developments in the market?
In March 2021, Rockwell Automation joins hands with Precast FZCO to drive software solutions Across the Middle East. With this collaboration, the company will explore its wide-ranging EMS solutions in this region to capture market share.
9. What pricing options are available for accessing the report?
Pricing options include single-user, multi-user, and enterprise licenses priced at USD 3800, USD 4500, and USD 5800 respectively.
10. Is the market size provided in terms of value or volume?
The market size is provided in terms of value, measured in billion.
11. Are there any specific market keywords associated with the report?
Yes, the market keyword associated with the report is "MEA Energy Management Systems Industry," which aids in identifying and referencing the specific market segment covered.
12. How do I determine which pricing option suits my needs best?
The pricing options vary based on user requirements and access needs. Individual users may opt for single-user licenses, while businesses requiring broader access may choose multi-user or enterprise licenses for cost-effective access to the report.
13. Are there any additional resources or data provided in the MEA Energy Management Systems Industry report?
While the report offers comprehensive insights, it's advisable to review the specific contents or supplementary materials provided to ascertain if additional resources or data are available.
14. How can I stay updated on further developments or reports in the MEA Energy Management Systems Industry?
To stay informed about further developments, trends, and reports in the MEA Energy Management Systems Industry, consider subscribing to industry newsletters, following relevant companies and organizations, or regularly checking reputable industry news sources and publications.
Methodology
Step 1 - Identification of Relevant Samples Size from Population Database


Step 2 - Approaches for Defining Global Market Size (Value, Volume* & Price*)

Note*: In applicable scenarios
Step 3 - Data Sources
Primary Research
- Web Analytics
- Survey Reports
- Research Institute
- Latest Research Reports
- Opinion Leaders
Secondary Research
- Annual Reports
- White Paper
- Latest Press Release
- Industry Association
- Paid Database
- Investor Presentations

Step 4 - Data Triangulation
Involves using different sources of information in order to increase the validity of a study
These sources are likely to be stakeholders in a program - participants, other researchers, program staff, other community members, and so on.
Then we put all data in single framework & apply various statistical tools to find out the dynamic on the market.
During the analysis stage, feedback from the stakeholder groups would be compared to determine areas of agreement as well as areas of divergence