Key Insights
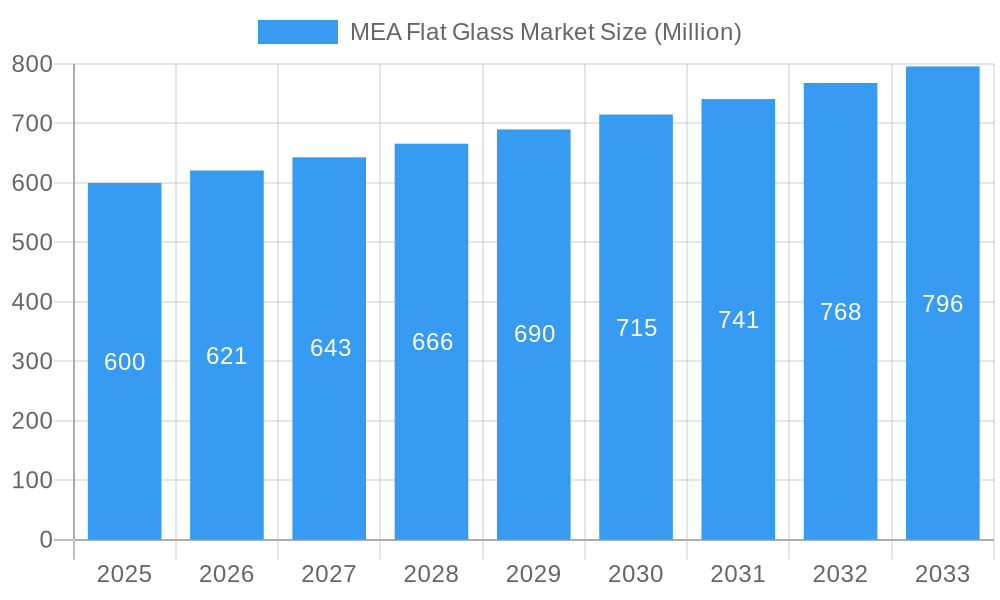
The MEA Flat Glass Market, characterized by a CAGR exceeding 3.50%, presents significant growth opportunities, particularly within the construction and automotive sectors. Driven by robust infrastructure development, particularly in the UAE and Saudi Arabia, and a burgeoning automotive industry across the region, demand for flat glass is projected to rise steadily. The market is segmented by product type (annealed, coated, reflective, processed glass, and mirrors) and end-user industries (building & construction, automotive, solar, and others). While a precise market size for 2025 is unavailable, based on the global CAGR and regional economic growth projections for the MEA region, a reasonable estimate places the 2025 market value in the range of $500-$700 million USD. This is a conservative estimation given the ongoing large-scale construction projects and increasing vehicle production in the region. Growth will be further fueled by increasing investments in renewable energy projects which require large quantities of solar glass. However, challenges such as fluctuating raw material prices and potential supply chain disruptions pose restraints to market expansion. Competitive dynamics are shaped by a mix of both global and regional players, with companies such as Saint-Gobain, AGC Inc., and others vying for market share. The focus on sustainable building practices and energy-efficient solutions is expected to drive demand for energy-efficient glass types in the coming years.
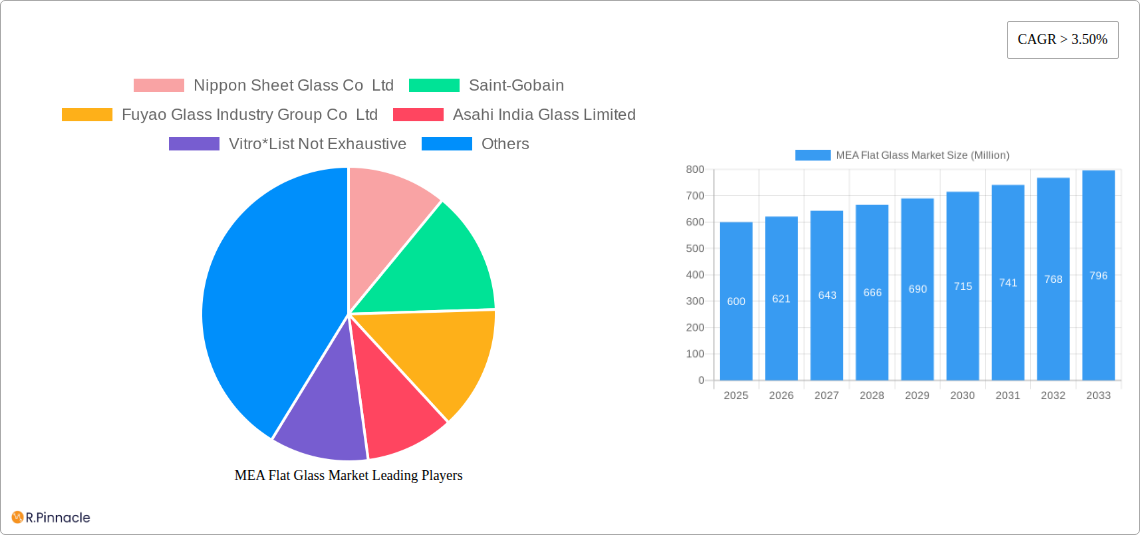
MEA Flat Glass Market Market Size (In Million)
The forecast period (2025-2033) anticipates continued growth, spurred by sustained infrastructure development and a growing middle class leading to increased consumer spending on housing and automobiles. Regional variations in growth will exist, with the UAE and Saudi Arabia expected to lead due to their robust economic activity and large-scale projects. However, countries like South Africa will show moderate growth driven by economic fluctuations. The market's future trajectory hinges on the effective management of supply chain vulnerabilities, successful adoption of innovative glass technologies, and government support for sustainable development initiatives. Further market penetration through new product offerings and targeted marketing strategies will be key for success.
MEA Flat Glass Market Company Market Share
MEA Flat Glass Market Report: 2019-2033
This comprehensive report provides an in-depth analysis of the Middle East and Africa (MEA) flat glass market, offering actionable insights for industry professionals and investors. With a study period spanning 2019-2033, a base year of 2025, and a forecast period of 2025-2033, this report covers historical data (2019-2024) and future projections. The market is segmented by end-user industry (Building and Construction, Automotive, Solar, Other End-user Industries) and product type (Annealed Glass, Coated Glass, Reflective Glass, Processed Glass, Mirrors), providing a granular view of market dynamics. Key players analyzed include Nippon Sheet Glass Co Ltd, Saint-Gobain, Fuyao Glass Industry Group Co Ltd, Asahi India Glass Limited, Vitro, GUARDIAN GLASS LLC, Sisecam Group, AGC Inc, SCHOTT AG, and Phoenicia.
MEA Flat Glass Market Market Structure & Innovation Trends
This section analyzes the MEA flat glass market's competitive landscape, encompassing market concentration, innovation drivers, regulatory frameworks, substitute products, end-user demographics, and merger & acquisition (M&A) activities. The market exhibits a moderately concentrated structure, with the top five players holding an estimated xx% market share in 2025. Innovation is driven by advancements in energy efficiency, sustainability, and aesthetic appeal. Stringent building codes and environmental regulations influence market dynamics. Substitute materials, such as plastics and composites, present competitive pressures. End-user demographics show a strong correlation with construction and automotive growth in the region. M&A activities are expected to increase in the coming years, with an estimated xx Million USD worth of deals in 2025 alone. Examples of these deals could include strategic partnerships to access new technologies or enhance market share.
MEA Flat Glass Market Market Dynamics & Trends
The MEA flat glass market is experiencing a period of substantial expansion, fueled by a confluence of robust growth in the construction sector and a thriving automotive production landscape. Projections indicate a Compound Annual Growth Rate (CAGR) of approximately 6.5% to 7.5% for the forecast period spanning 2025 to 2033. This upward trajectory is particularly pronounced in emerging economies within the region, where market penetration is steadily increasing. Technological innovations are playing a pivotal role in shaping market dynamics. The advent and widespread adoption of energy-efficient coated glass, designed to optimize thermal performance and reduce energy consumption, are becoming a key differentiator. Furthermore, advancements in sophisticated glass processing techniques are enabling the production of high-performance and aesthetically superior products. Consumer preferences are increasingly leaning towards architectural designs that emphasize both visual appeal and significant energy savings, directly stimulating demand for premium, value-added flat glass solutions. The competitive landscape is characterized by a dynamic interplay of price competition, strategic product differentiation, and a relentless pursuit of innovation among market participants. Concurrently, the escalating global focus on renewable energy sources is a significant catalyst, driving a substantial surge in demand for specialized solar glass essential for photovoltaic applications.
Dominant Regions & Segments in MEA Flat Glass Market
The Building and Construction segment stands out as the dominant force within the MEA flat glass market, capturing an estimated 55% to 60% of the total market revenue in 2025. This segment's leadership is primarily attributed to the execution of large-scale infrastructure projects and the rapid pace of urbanization across the region. Within the product segmentation, Annealed Glass continues to hold the largest market share, largely owing to its inherent cost-effectiveness and widespread applicability in various construction and manufacturing processes.
- Key Drivers for Building and Construction: Significant government investments in public infrastructure development, a notable rise in disposable incomes, and the implementation of supportive government policies that encourage construction activities are the primary catalysts for this segment's growth.
- Key Drivers for Automotive: The sustained growth in vehicle production, coupled with an increasing demand for vehicles equipped with advanced driver-assistance systems (ADAS) that necessitate specialized glass components, are propelling the automotive segment forward.
- Key Drivers for Solar: Proactive government initiatives aimed at promoting the adoption of renewable energy sources, alongside the continually declining cost of solar panels, are creating a fertile ground for the expansion of the solar glass market.
The United Arab Emirates (UAE) and Saudi Arabia are recognized as the leading markets within the broader MEA region, collectively accounting for approximately 45% to 50% of the total market revenue. Their preeminent position is underpinned by robust economic performance, substantial investments in infrastructure development, and strong governmental support for both the construction and renewable energy sectors, collectively fostering a conducive environment for market expansion.
MEA Flat Glass Market Product Innovations
Recent product innovations include the development of self-cleaning glass, energy-efficient coated glass, and specialized glass for solar applications. These innovations enhance the functionality and aesthetic appeal of glass products, leading to increased market demand. Companies are also focusing on developing more sustainable glass production methods to minimize their environmental footprint.
Report Scope & Segmentation Analysis
This report provides a detailed analysis of the MEA flat glass market, segmented by end-user industry (Building & Construction, Automotive, Solar, Other) and product type (Annealed Glass, Coated Glass, Reflective Glass, Processed Glass, Mirrors). Each segment's growth projections, market size, and competitive dynamics are analyzed, providing a comprehensive understanding of the market's structure. For example, the Building and Construction segment is projected to experience a CAGR of xx% due to strong infrastructure development across the region. Similarly, the demand for Coated Glass is anticipated to grow due to its energy efficiency benefits.
Key Drivers of MEA Flat Glass Market Growth
The MEA flat glass market's impressive growth trajectory is propelled by a multifaceted array of driving forces. Foremost among these is the ongoing phenomenon of rapid urbanization and the subsequent surge in infrastructure development projects across the diverse nations of the region. In parallel, a burgeoning automotive industry, characterized by increasing production volumes and a growing demand for innovative vehicle features, contributes significantly. The accelerating adoption of solar energy technologies, driven by environmental consciousness and cost-effectiveness, is creating a substantial demand for specialized solar glass. Furthermore, a supportive ecosystem of government policies that actively promote sustainable building practices and incentivize the use of energy-efficient materials further bolsters the market. These interconnected factors collectively ensure a consistently high and growing demand for a wide spectrum of flat glass products throughout the MEA region.
Challenges in the MEA Flat Glass Market Sector
Despite its robust growth, the MEA flat glass market is not without its challenges. Fluctuations in the prices of key raw materials, such as soda ash and silica sand, can significantly impact production costs and profitability. Global supply chain disruptions, exacerbated by geopolitical events and logistical complexities, can lead to shortages and delays. The market faces intense competition from both established domestic players and increasingly competitive international manufacturers, often leading to price pressures. Additionally, volatile energy costs, which are critical for the energy-intensive glass manufacturing process, can affect operational efficiency and overall profitability. In certain markets, navigating complex regulatory hurdles related to import-export procedures and compliance can also present a significant impediment to smoother market operations and expansion.
Emerging Opportunities in MEA Flat Glass Market
The growing demand for energy-efficient and smart glass solutions presents lucrative opportunities. The adoption of sustainable building practices and the expanding solar energy sector create further potential for market growth. Moreover, exploring new markets within the MEA region presents significant expansion opportunities for established players.
Leading Players in the MEA Flat Glass Market Market
- Nippon Sheet Glass Co Ltd
- Saint-Gobain
- Fuyao Glass Industry Group Co Ltd
- Asahi India Glass Limited
- Vitro
- GUARDIAN GLASS LLC
- Sisecam Group
- AGC Inc
- SCHOTT AG
- Phoenicia
Key Developments in MEA Flat Glass Market Industry
- September 2022: Saint-Gobain, a global leader in light and sustainable construction, announced a substantial investment in expanding its operational footprint in Egypt. This strategic move includes the establishment of two new state-of-the-art manufacturing plants dedicated to the production of flat glass, signaling a commitment to enhancing local production capabilities and serving the growing regional demand.
- August 2022: Vitro, a prominent glass manufacturing company, unveiled ambitious plans to construct a new integrated flat and container glass plant in Egypt. This significant undertaking represents a total investment of USD 400 Million, underscoring the strategic importance of the Egyptian market and the broader MEA region for future growth and expansion in the glass industry.
Future Outlook for MEA Flat Glass Market Market
The MEA flat glass market is poised for robust growth, driven by continuous infrastructure development, expanding automotive production, rising adoption of renewable energy, and supportive government policies. Companies focusing on innovation, sustainability, and efficient supply chain management are expected to gain a competitive edge. The market presents significant opportunities for both established players and new entrants.
MEA Flat Glass Market Segmentation
-
1. Product Type
- 1.1. Annealed Glass
- 1.2. Coater Glass
- 1.3. Reflective Glass
- 1.4. Processsed Glass
- 1.5. Mirrors
-
2. End-user Industry
- 2.1. Building and Construction
- 2.2. Automotive
- 2.3. Solar
- 2.4. Other End-user Industries
-
3. Geography
- 3.1. Saudi Arabia
- 3.2. United Arab Emirates
- 3.3. Egypt
- 3.4. Nigeria
- 3.5. South Africa
- 3.6. Rest of Middle East and Africa
MEA Flat Glass Market Segmentation By Geography
- 1. Saudi Arabia
- 2. United Arab Emirates
- 3. Egypt
- 4. Nigeria
- 5. South Africa
- 6. Rest of Middle East and Africa
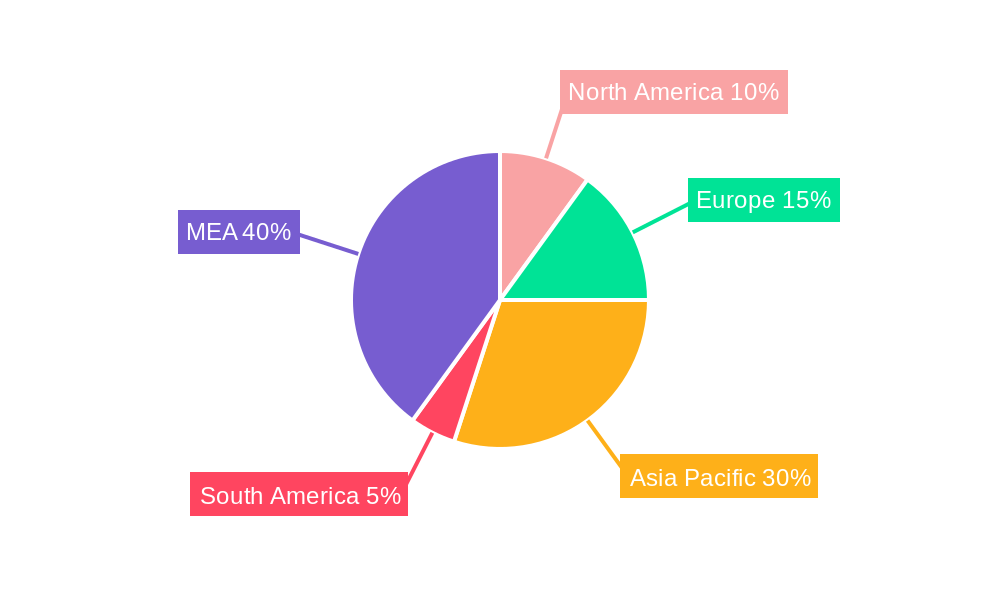
MEA Flat Glass Market Regional Market Share
Geographic Coverage of MEA Flat Glass Market
MEA Flat Glass Market REPORT HIGHLIGHTS
| Aspects | Details |
|---|---|
| Study Period | 2020-2034 |
| Base Year | 2025 |
| Estimated Year | 2026 |
| Forecast Period | 2026-2034 |
| Historical Period | 2020-2025 |
| Growth Rate | CAGR of > 3.50% from 2020-2034 |
| Segmentation |
|
Table of Contents
- 1. Introduction
- 1.1. Research Scope
- 1.2. Market Segmentation
- 1.3. Research Objective
- 1.4. Definitions and Assumptions
- 2. Executive Summary
- 2.1. Market Snapshot
- 3. Market Dynamics
- 3.1. Market Drivers
- 3.2. Market Restrains
- 3.3. Market Trends
- 3.4. Market Opportunities
- 4. Market Factor Analysis
- 4.1. Porters Five Forces
- 4.1.1. Bargaining Power of Suppliers
- 4.1.2. Bargaining Power of Buyers
- 4.1.3. Threat of New Entrants
- 4.1.4. Threat of Substitutes
- 4.1.5. Competitive Rivalry
- 4.2. PESTEL analysis
- 4.3. BCG Analysis
- 4.3.1. Stars (High Growth, High Market Share)
- 4.3.2. Cash Cows (Low Growth, High Market Share)
- 4.3.3. Question Mark (High Growth, Low Market Share)
- 4.3.4. Dogs (Low Growth, Low Market Share)
- 4.4. Ansoff Matrix Analysis
- 4.5. Supply Chain Analysis
- 4.6. Regulatory Landscape
- 4.7. Current Market Potential and Opportunity Assessment (TAM–SAM–SOM Framework)
- 4.8. PRI Analyst Note
- 4.1. Porters Five Forces
- 5. Market Analysis, Insights and Forecast 2021-2033
- 5.1. Market Analysis, Insights and Forecast - by Product Type
- 5.1.1. Annealed Glass
- 5.1.2. Coater Glass
- 5.1.3. Reflective Glass
- 5.1.4. Processsed Glass
- 5.1.5. Mirrors
- 5.2. Market Analysis, Insights and Forecast - by End-user Industry
- 5.2.1. Building and Construction
- 5.2.2. Automotive
- 5.2.3. Solar
- 5.2.4. Other End-user Industries
- 5.3. Market Analysis, Insights and Forecast - by Geography
- 5.3.1. Saudi Arabia
- 5.3.2. United Arab Emirates
- 5.3.3. Egypt
- 5.3.4. Nigeria
- 5.3.5. South Africa
- 5.3.6. Rest of Middle East and Africa
- 5.4. Market Analysis, Insights and Forecast - by Region
- 5.4.1. Saudi Arabia
- 5.4.2. United Arab Emirates
- 5.4.3. Egypt
- 5.4.4. Nigeria
- 5.4.5. South Africa
- 5.4.6. Rest of Middle East and Africa
- 5.1. Market Analysis, Insights and Forecast - by Product Type
- 6. Global MEA Flat Glass Market Analysis, Insights and Forecast, 2021-2033
- 6.1. Market Analysis, Insights and Forecast - by Product Type
- 6.1.1. Annealed Glass
- 6.1.2. Coater Glass
- 6.1.3. Reflective Glass
- 6.1.4. Processsed Glass
- 6.1.5. Mirrors
- 6.2. Market Analysis, Insights and Forecast - by End-user Industry
- 6.2.1. Building and Construction
- 6.2.2. Automotive
- 6.2.3. Solar
- 6.2.4. Other End-user Industries
- 6.3. Market Analysis, Insights and Forecast - by Geography
- 6.3.1. Saudi Arabia
- 6.3.2. United Arab Emirates
- 6.3.3. Egypt
- 6.3.4. Nigeria
- 6.3.5. South Africa
- 6.3.6. Rest of Middle East and Africa
- 6.1. Market Analysis, Insights and Forecast - by Product Type
- 7. Saudi Arabia MEA Flat Glass Market Analysis, Insights and Forecast, 2020-2032
- 7.1. Market Analysis, Insights and Forecast - by Product Type
- 7.1.1. Annealed Glass
- 7.1.2. Coater Glass
- 7.1.3. Reflective Glass
- 7.1.4. Processsed Glass
- 7.1.5. Mirrors
- 7.2. Market Analysis, Insights and Forecast - by End-user Industry
- 7.2.1. Building and Construction
- 7.2.2. Automotive
- 7.2.3. Solar
- 7.2.4. Other End-user Industries
- 7.3. Market Analysis, Insights and Forecast - by Geography
- 7.3.1. Saudi Arabia
- 7.3.2. United Arab Emirates
- 7.3.3. Egypt
- 7.3.4. Nigeria
- 7.3.5. South Africa
- 7.3.6. Rest of Middle East and Africa
- 7.1. Market Analysis, Insights and Forecast - by Product Type
- 8. United Arab Emirates MEA Flat Glass Market Analysis, Insights and Forecast, 2020-2032
- 8.1. Market Analysis, Insights and Forecast - by Product Type
- 8.1.1. Annealed Glass
- 8.1.2. Coater Glass
- 8.1.3. Reflective Glass
- 8.1.4. Processsed Glass
- 8.1.5. Mirrors
- 8.2. Market Analysis, Insights and Forecast - by End-user Industry
- 8.2.1. Building and Construction
- 8.2.2. Automotive
- 8.2.3. Solar
- 8.2.4. Other End-user Industries
- 8.3. Market Analysis, Insights and Forecast - by Geography
- 8.3.1. Saudi Arabia
- 8.3.2. United Arab Emirates
- 8.3.3. Egypt
- 8.3.4. Nigeria
- 8.3.5. South Africa
- 8.3.6. Rest of Middle East and Africa
- 8.1. Market Analysis, Insights and Forecast - by Product Type
- 9. Egypt MEA Flat Glass Market Analysis, Insights and Forecast, 2020-2032
- 9.1. Market Analysis, Insights and Forecast - by Product Type
- 9.1.1. Annealed Glass
- 9.1.2. Coater Glass
- 9.1.3. Reflective Glass
- 9.1.4. Processsed Glass
- 9.1.5. Mirrors
- 9.2. Market Analysis, Insights and Forecast - by End-user Industry
- 9.2.1. Building and Construction
- 9.2.2. Automotive
- 9.2.3. Solar
- 9.2.4. Other End-user Industries
- 9.3. Market Analysis, Insights and Forecast - by Geography
- 9.3.1. Saudi Arabia
- 9.3.2. United Arab Emirates
- 9.3.3. Egypt
- 9.3.4. Nigeria
- 9.3.5. South Africa
- 9.3.6. Rest of Middle East and Africa
- 9.1. Market Analysis, Insights and Forecast - by Product Type
- 10. Nigeria MEA Flat Glass Market Analysis, Insights and Forecast, 2020-2032
- 10.1. Market Analysis, Insights and Forecast - by Product Type
- 10.1.1. Annealed Glass
- 10.1.2. Coater Glass
- 10.1.3. Reflective Glass
- 10.1.4. Processsed Glass
- 10.1.5. Mirrors
- 10.2. Market Analysis, Insights and Forecast - by End-user Industry
- 10.2.1. Building and Construction
- 10.2.2. Automotive
- 10.2.3. Solar
- 10.2.4. Other End-user Industries
- 10.3. Market Analysis, Insights and Forecast - by Geography
- 10.3.1. Saudi Arabia
- 10.3.2. United Arab Emirates
- 10.3.3. Egypt
- 10.3.4. Nigeria
- 10.3.5. South Africa
- 10.3.6. Rest of Middle East and Africa
- 10.1. Market Analysis, Insights and Forecast - by Product Type
- 11. South Africa MEA Flat Glass Market Analysis, Insights and Forecast, 2020-2032
- 11.1. Market Analysis, Insights and Forecast - by Product Type
- 11.1.1. Annealed Glass
- 11.1.2. Coater Glass
- 11.1.3. Reflective Glass
- 11.1.4. Processsed Glass
- 11.1.5. Mirrors
- 11.2. Market Analysis, Insights and Forecast - by End-user Industry
- 11.2.1. Building and Construction
- 11.2.2. Automotive
- 11.2.3. Solar
- 11.2.4. Other End-user Industries
- 11.3. Market Analysis, Insights and Forecast - by Geography
- 11.3.1. Saudi Arabia
- 11.3.2. United Arab Emirates
- 11.3.3. Egypt
- 11.3.4. Nigeria
- 11.3.5. South Africa
- 11.3.6. Rest of Middle East and Africa
- 11.1. Market Analysis, Insights and Forecast - by Product Type
- 12. Rest of Middle East and Africa MEA Flat Glass Market Analysis, Insights and Forecast, 2020-2032
- 12.1. Market Analysis, Insights and Forecast - by Product Type
- 12.1.1. Annealed Glass
- 12.1.2. Coater Glass
- 12.1.3. Reflective Glass
- 12.1.4. Processsed Glass
- 12.1.5. Mirrors
- 12.2. Market Analysis, Insights and Forecast - by End-user Industry
- 12.2.1. Building and Construction
- 12.2.2. Automotive
- 12.2.3. Solar
- 12.2.4. Other End-user Industries
- 12.3. Market Analysis, Insights and Forecast - by Geography
- 12.3.1. Saudi Arabia
- 12.3.2. United Arab Emirates
- 12.3.3. Egypt
- 12.3.4. Nigeria
- 12.3.5. South Africa
- 12.3.6. Rest of Middle East and Africa
- 12.1. Market Analysis, Insights and Forecast - by Product Type
- 13. Competitive Analysis
- 13.1. Company Profiles
- 13.1.1 Nippon Sheet Glass Co Ltd
- 13.1.1.1. Company Overview
- 13.1.1.2. Products
- 13.1.1.3. Company Financials
- 13.1.1.4. SWOT Analysis
- 13.1.2 Saint-Gobain
- 13.1.2.1. Company Overview
- 13.1.2.2. Products
- 13.1.2.3. Company Financials
- 13.1.2.4. SWOT Analysis
- 13.1.3 Fuyao Glass Industry Group Co Ltd
- 13.1.3.1. Company Overview
- 13.1.3.2. Products
- 13.1.3.3. Company Financials
- 13.1.3.4. SWOT Analysis
- 13.1.4 Asahi India Glass Limited
- 13.1.4.1. Company Overview
- 13.1.4.2. Products
- 13.1.4.3. Company Financials
- 13.1.4.4. SWOT Analysis
- 13.1.5 Vitro*List Not Exhaustive
- 13.1.5.1. Company Overview
- 13.1.5.2. Products
- 13.1.5.3. Company Financials
- 13.1.5.4. SWOT Analysis
- 13.1.6 GUARDIAN GLASS LLC
- 13.1.6.1. Company Overview
- 13.1.6.2. Products
- 13.1.6.3. Company Financials
- 13.1.6.4. SWOT Analysis
- 13.1.7 Sisecam Group
- 13.1.7.1. Company Overview
- 13.1.7.2. Products
- 13.1.7.3. Company Financials
- 13.1.7.4. SWOT Analysis
- 13.1.8 AGC Inc
- 13.1.8.1. Company Overview
- 13.1.8.2. Products
- 13.1.8.3. Company Financials
- 13.1.8.4. SWOT Analysis
- 13.1.9 SCHOTT AG
- 13.1.9.1. Company Overview
- 13.1.9.2. Products
- 13.1.9.3. Company Financials
- 13.1.9.4. SWOT Analysis
- 13.1.10 Phoenicia
- 13.1.10.1. Company Overview
- 13.1.10.2. Products
- 13.1.10.3. Company Financials
- 13.1.10.4. SWOT Analysis
- 13.1.1 Nippon Sheet Glass Co Ltd
- 13.2. Market Entropy
- 13.2.1 Company's Key Areas Served
- 13.2.2 Recent Developments
- 13.3. Company Market Share Analysis 2025
- 13.3.1 Top 5 Companies Market Share Analysis
- 13.3.2 Top 3 Companies Market Share Analysis
- 13.4. List of Potential Customers
- 14. Research Methodology
List of Figures
- Figure 1: Global MEA Flat Glass Market Revenue Breakdown (Million, %) by Region 2025 & 2033
- Figure 2: Saudi Arabia MEA Flat Glass Market Revenue (Million), by Product Type 2025 & 2033
- Figure 3: Saudi Arabia MEA Flat Glass Market Revenue Share (%), by Product Type 2025 & 2033
- Figure 4: Saudi Arabia MEA Flat Glass Market Revenue (Million), by End-user Industry 2025 & 2033
- Figure 5: Saudi Arabia MEA Flat Glass Market Revenue Share (%), by End-user Industry 2025 & 2033
- Figure 6: Saudi Arabia MEA Flat Glass Market Revenue (Million), by Geography 2025 & 2033
- Figure 7: Saudi Arabia MEA Flat Glass Market Revenue Share (%), by Geography 2025 & 2033
- Figure 8: Saudi Arabia MEA Flat Glass Market Revenue (Million), by Country 2025 & 2033
- Figure 9: Saudi Arabia MEA Flat Glass Market Revenue Share (%), by Country 2025 & 2033
- Figure 10: United Arab Emirates MEA Flat Glass Market Revenue (Million), by Product Type 2025 & 2033
- Figure 11: United Arab Emirates MEA Flat Glass Market Revenue Share (%), by Product Type 2025 & 2033
- Figure 12: United Arab Emirates MEA Flat Glass Market Revenue (Million), by End-user Industry 2025 & 2033
- Figure 13: United Arab Emirates MEA Flat Glass Market Revenue Share (%), by End-user Industry 2025 & 2033
- Figure 14: United Arab Emirates MEA Flat Glass Market Revenue (Million), by Geography 2025 & 2033
- Figure 15: United Arab Emirates MEA Flat Glass Market Revenue Share (%), by Geography 2025 & 2033
- Figure 16: United Arab Emirates MEA Flat Glass Market Revenue (Million), by Country 2025 & 2033
- Figure 17: United Arab Emirates MEA Flat Glass Market Revenue Share (%), by Country 2025 & 2033
- Figure 18: Egypt MEA Flat Glass Market Revenue (Million), by Product Type 2025 & 2033
- Figure 19: Egypt MEA Flat Glass Market Revenue Share (%), by Product Type 2025 & 2033
- Figure 20: Egypt MEA Flat Glass Market Revenue (Million), by End-user Industry 2025 & 2033
- Figure 21: Egypt MEA Flat Glass Market Revenue Share (%), by End-user Industry 2025 & 2033
- Figure 22: Egypt MEA Flat Glass Market Revenue (Million), by Geography 2025 & 2033
- Figure 23: Egypt MEA Flat Glass Market Revenue Share (%), by Geography 2025 & 2033
- Figure 24: Egypt MEA Flat Glass Market Revenue (Million), by Country 2025 & 2033
- Figure 25: Egypt MEA Flat Glass Market Revenue Share (%), by Country 2025 & 2033
- Figure 26: Nigeria MEA Flat Glass Market Revenue (Million), by Product Type 2025 & 2033
- Figure 27: Nigeria MEA Flat Glass Market Revenue Share (%), by Product Type 2025 & 2033
- Figure 28: Nigeria MEA Flat Glass Market Revenue (Million), by End-user Industry 2025 & 2033
- Figure 29: Nigeria MEA Flat Glass Market Revenue Share (%), by End-user Industry 2025 & 2033
- Figure 30: Nigeria MEA Flat Glass Market Revenue (Million), by Geography 2025 & 2033
- Figure 31: Nigeria MEA Flat Glass Market Revenue Share (%), by Geography 2025 & 2033
- Figure 32: Nigeria MEA Flat Glass Market Revenue (Million), by Country 2025 & 2033
- Figure 33: Nigeria MEA Flat Glass Market Revenue Share (%), by Country 2025 & 2033
- Figure 34: South Africa MEA Flat Glass Market Revenue (Million), by Product Type 2025 & 2033
- Figure 35: South Africa MEA Flat Glass Market Revenue Share (%), by Product Type 2025 & 2033
- Figure 36: South Africa MEA Flat Glass Market Revenue (Million), by End-user Industry 2025 & 2033
- Figure 37: South Africa MEA Flat Glass Market Revenue Share (%), by End-user Industry 2025 & 2033
- Figure 38: South Africa MEA Flat Glass Market Revenue (Million), by Geography 2025 & 2033
- Figure 39: South Africa MEA Flat Glass Market Revenue Share (%), by Geography 2025 & 2033
- Figure 40: South Africa MEA Flat Glass Market Revenue (Million), by Country 2025 & 2033
- Figure 41: South Africa MEA Flat Glass Market Revenue Share (%), by Country 2025 & 2033
- Figure 42: Rest of Middle East and Africa MEA Flat Glass Market Revenue (Million), by Product Type 2025 & 2033
- Figure 43: Rest of Middle East and Africa MEA Flat Glass Market Revenue Share (%), by Product Type 2025 & 2033
- Figure 44: Rest of Middle East and Africa MEA Flat Glass Market Revenue (Million), by End-user Industry 2025 & 2033
- Figure 45: Rest of Middle East and Africa MEA Flat Glass Market Revenue Share (%), by End-user Industry 2025 & 2033
- Figure 46: Rest of Middle East and Africa MEA Flat Glass Market Revenue (Million), by Geography 2025 & 2033
- Figure 47: Rest of Middle East and Africa MEA Flat Glass Market Revenue Share (%), by Geography 2025 & 2033
- Figure 48: Rest of Middle East and Africa MEA Flat Glass Market Revenue (Million), by Country 2025 & 2033
- Figure 49: Rest of Middle East and Africa MEA Flat Glass Market Revenue Share (%), by Country 2025 & 2033
List of Tables
- Table 1: Global MEA Flat Glass Market Revenue Million Forecast, by Product Type 2020 & 2033
- Table 2: Global MEA Flat Glass Market Revenue Million Forecast, by End-user Industry 2020 & 2033
- Table 3: Global MEA Flat Glass Market Revenue Million Forecast, by Geography 2020 & 2033
- Table 4: Global MEA Flat Glass Market Revenue Million Forecast, by Region 2020 & 2033
- Table 5: Global MEA Flat Glass Market Revenue Million Forecast, by Product Type 2020 & 2033
- Table 6: Global MEA Flat Glass Market Revenue Million Forecast, by End-user Industry 2020 & 2033
- Table 7: Global MEA Flat Glass Market Revenue Million Forecast, by Geography 2020 & 2033
- Table 8: Global MEA Flat Glass Market Revenue Million Forecast, by Country 2020 & 2033
- Table 9: Global MEA Flat Glass Market Revenue Million Forecast, by Product Type 2020 & 2033
- Table 10: Global MEA Flat Glass Market Revenue Million Forecast, by End-user Industry 2020 & 2033
- Table 11: Global MEA Flat Glass Market Revenue Million Forecast, by Geography 2020 & 2033
- Table 12: Global MEA Flat Glass Market Revenue Million Forecast, by Country 2020 & 2033
- Table 13: Global MEA Flat Glass Market Revenue Million Forecast, by Product Type 2020 & 2033
- Table 14: Global MEA Flat Glass Market Revenue Million Forecast, by End-user Industry 2020 & 2033
- Table 15: Global MEA Flat Glass Market Revenue Million Forecast, by Geography 2020 & 2033
- Table 16: Global MEA Flat Glass Market Revenue Million Forecast, by Country 2020 & 2033
- Table 17: Global MEA Flat Glass Market Revenue Million Forecast, by Product Type 2020 & 2033
- Table 18: Global MEA Flat Glass Market Revenue Million Forecast, by End-user Industry 2020 & 2033
- Table 19: Global MEA Flat Glass Market Revenue Million Forecast, by Geography 2020 & 2033
- Table 20: Global MEA Flat Glass Market Revenue Million Forecast, by Country 2020 & 2033
- Table 21: Global MEA Flat Glass Market Revenue Million Forecast, by Product Type 2020 & 2033
- Table 22: Global MEA Flat Glass Market Revenue Million Forecast, by End-user Industry 2020 & 2033
- Table 23: Global MEA Flat Glass Market Revenue Million Forecast, by Geography 2020 & 2033
- Table 24: Global MEA Flat Glass Market Revenue Million Forecast, by Country 2020 & 2033
- Table 25: Global MEA Flat Glass Market Revenue Million Forecast, by Product Type 2020 & 2033
- Table 26: Global MEA Flat Glass Market Revenue Million Forecast, by End-user Industry 2020 & 2033
- Table 27: Global MEA Flat Glass Market Revenue Million Forecast, by Geography 2020 & 2033
- Table 28: Global MEA Flat Glass Market Revenue Million Forecast, by Country 2020 & 2033
Frequently Asked Questions
1. What is the projected Compound Annual Growth Rate (CAGR) of the MEA Flat Glass Market?
The projected CAGR is approximately > 3.50%.
2. Which companies are prominent players in the MEA Flat Glass Market?
Key companies in the market include Nippon Sheet Glass Co Ltd, Saint-Gobain, Fuyao Glass Industry Group Co Ltd, Asahi India Glass Limited, Vitro*List Not Exhaustive, GUARDIAN GLASS LLC, Sisecam Group, AGC Inc, SCHOTT AG, Phoenicia.
3. What are the main segments of the MEA Flat Glass Market?
The market segments include Product Type, End-user Industry, Geography.
4. Can you provide details about the market size?
The market size is estimated to be USD XX Million as of 2022.
5. What are some drivers contributing to market growth?
Growing Demand for Electronic Displays; Increasing Demand from the Construction Industry.
6. What are the notable trends driving market growth?
Increasing Usage in the Construction Industry.
7. Are there any restraints impacting market growth?
Fluctuating Raw Material Prices.
8. Can you provide examples of recent developments in the market?
In September 2022, Saint-Gobain announced to invest in new production facilities in Egypt. Investments will be made in manufacturing plants for flat glass. The multinational company plans to build two new manufacturing plants for flat glass, gypsum, and sustainable building materials over the next three years.
9. What pricing options are available for accessing the report?
Pricing options include single-user, multi-user, and enterprise licenses priced at USD 4750, USD 5250, and USD 8750 respectively.
10. Is the market size provided in terms of value or volume?
The market size is provided in terms of value, measured in Million.
11. Are there any specific market keywords associated with the report?
Yes, the market keyword associated with the report is "MEA Flat Glass Market," which aids in identifying and referencing the specific market segment covered.
12. How do I determine which pricing option suits my needs best?
The pricing options vary based on user requirements and access needs. Individual users may opt for single-user licenses, while businesses requiring broader access may choose multi-user or enterprise licenses for cost-effective access to the report.
13. Are there any additional resources or data provided in the MEA Flat Glass Market report?
While the report offers comprehensive insights, it's advisable to review the specific contents or supplementary materials provided to ascertain if additional resources or data are available.
14. How can I stay updated on further developments or reports in the MEA Flat Glass Market?
To stay informed about further developments, trends, and reports in the MEA Flat Glass Market, consider subscribing to industry newsletters, following relevant companies and organizations, or regularly checking reputable industry news sources and publications.
Methodology
Step 1 - Identification of Relevant Samples Size from Population Database


Step 2 - Approaches for Defining Global Market Size (Value, Volume* & Price*)

Note*: In applicable scenarios
Step 3 - Data Sources
Primary Research
- Web Analytics
- Survey Reports
- Research Institute
- Latest Research Reports
- Opinion Leaders
Secondary Research
- Annual Reports
- White Paper
- Latest Press Release
- Industry Association
- Paid Database
- Investor Presentations

Step 4 - Data Triangulation
Involves using different sources of information in order to increase the validity of a study
These sources are likely to be stakeholders in a program - participants, other researchers, program staff, other community members, and so on.
Then we put all data in single framework & apply various statistical tools to find out the dynamic on the market.
During the analysis stage, feedback from the stakeholder groups would be compared to determine areas of agreement as well as areas of divergence

