
Key Insights
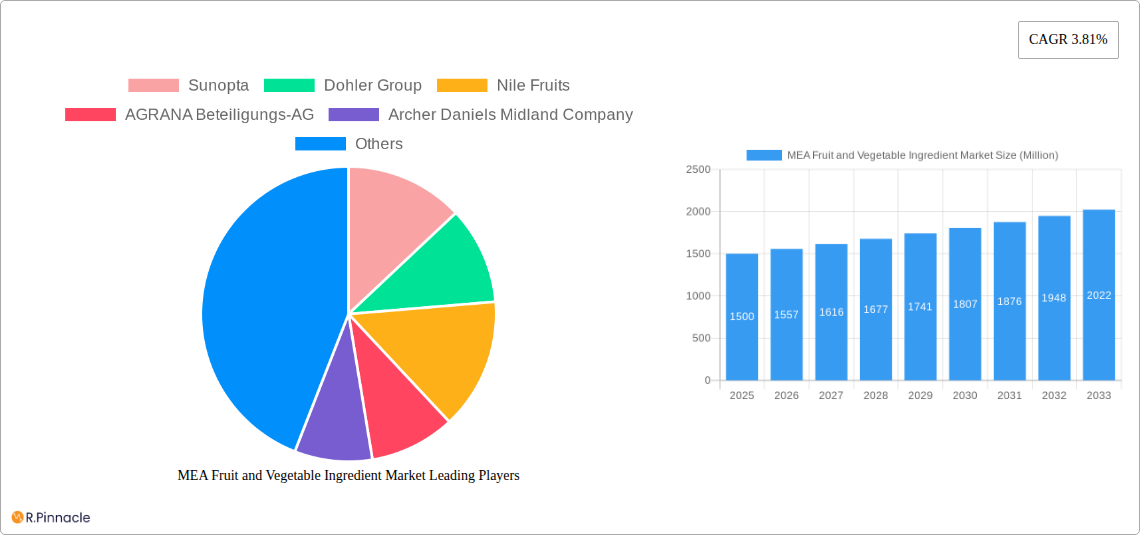
The Middle East and Africa (MEA) fruit and vegetable ingredient market is experiencing robust growth, driven by increasing demand for processed foods, health-conscious consumers seeking natural ingredients, and the expanding food and beverage industry across the region. The market's compound annual growth rate (CAGR) of 3.81% from 2019 to 2024 indicates a steady upward trajectory. Key segments like concentrates, pastes, and purees are witnessing significant traction, fueled by their convenience and extended shelf life. The beverage industry remains a major application area, with fruit and vegetable ingredients enhancing flavor, color, and nutritional value in various drinks. However, factors like fluctuating raw material prices and stringent food safety regulations pose challenges to market expansion. The increasing adoption of convenient ready-to-eat (RTE) meals and the rising popularity of confectionery products are contributing significantly to market growth. Furthermore, the growing awareness of health and wellness is driving the demand for natural and minimally processed fruit and vegetable ingredients, creating opportunities for ingredient suppliers focusing on organic and sustainably sourced products. Major players like Sunopta, Dohler Group, and Archer Daniels Midland are actively shaping the market landscape through innovation and strategic partnerships, focusing on product diversification and regional expansion to capitalize on this growth.
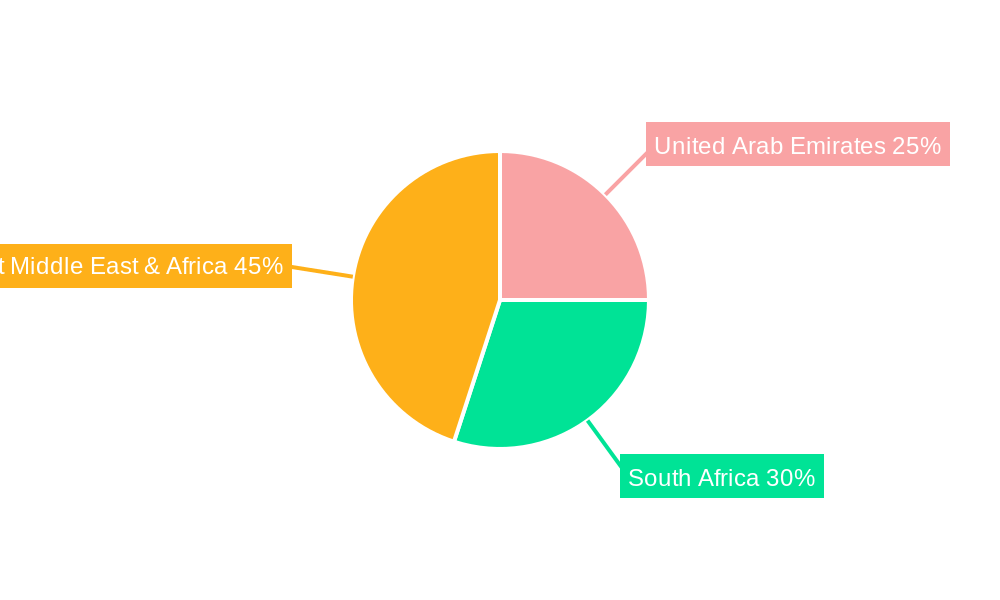
The regional distribution of the market within MEA suggests strong growth potential in countries like the United Arab Emirates and South Africa, reflecting their expanding economies and rising middle classes. The "Rest of Middle East & Africa" segment also contributes significantly, indicating considerable untapped opportunities across the diverse range of countries in the region. Future growth will be further influenced by the development of advanced processing technologies, increased investments in the food processing sector, and the evolving consumer preferences towards natural and functional foods. The market's segmentation by ingredient type (fruits, vegetables), product type (concentrates, pastes, purees, pieces, powders, NFC juices), and application (beverages, confectionery, bakery, soups, sauces, dairy, RTE) provides a detailed understanding of the market’s dynamics. Analyzing these segments allows for better identification of growth drivers and potential areas for investment.
MEA Fruit and Vegetable Ingredient Market: A Comprehensive Report (2019-2033)
This in-depth report provides a comprehensive analysis of the Middle East and Africa (MEA) fruit and vegetable ingredient market, offering invaluable insights for industry professionals, investors, and strategic decision-makers. The report covers the period 2019-2033, with a focus on the estimated year 2025 and a forecast period spanning 2025-2033. The market is segmented by ingredient type (Fruits, Vegetables), product type (Concentrates, Pastes and Purees, Pieces and Powders, NFC Juices), and application (Beverages, Confectionery Products, Bakery Products, Soups and Sauces, Dairy Products, RTE Products). Key players such as Sunopta, Dohler Group, Nile Fruits, AGRANA Beteiligungs-AG, Archer Daniels Midland Company, Kanegrade Ltd, Sensient Technologies Corporation, and NRTC Nassar Al Refaee are analyzed for their market share and strategic initiatives. The total market size is estimated at xx Million in 2025.
MEA Fruit and Vegetable Ingredient Market Market Structure & Innovation Trends
This section analyzes the MEA fruit and vegetable ingredient market's competitive landscape, innovation drivers, and regulatory environment. Market concentration is assessed, revealing the dominance of key players and the presence of smaller, niche players. The report explores the impact of mergers and acquisitions (M&A) activities, including deal values and their influence on market share. Innovation drivers such as technological advancements in processing and preservation techniques are examined, alongside evolving consumer preferences and regulatory frameworks impacting ingredient sourcing and labeling. The analysis includes a detailed overview of product substitutes and their market penetration. End-user demographics and their evolving demands are also considered, providing a holistic understanding of market structure and future trends. For instance, the growing demand for convenient and healthy food options is driving innovation in this sector. The total market value in 2025 is estimated at xx Million.
- Market Concentration: xx% controlled by top 5 players.
- M&A Activity: xx deals recorded between 2019-2024, with a total value of xx Million.
- Innovation Drivers: Technological advancements in extraction, preservation, and packaging.
- Regulatory Frameworks: Focus on food safety, labeling, and sustainability.
MEA Fruit and Vegetable Ingredient Market Market Dynamics & Trends
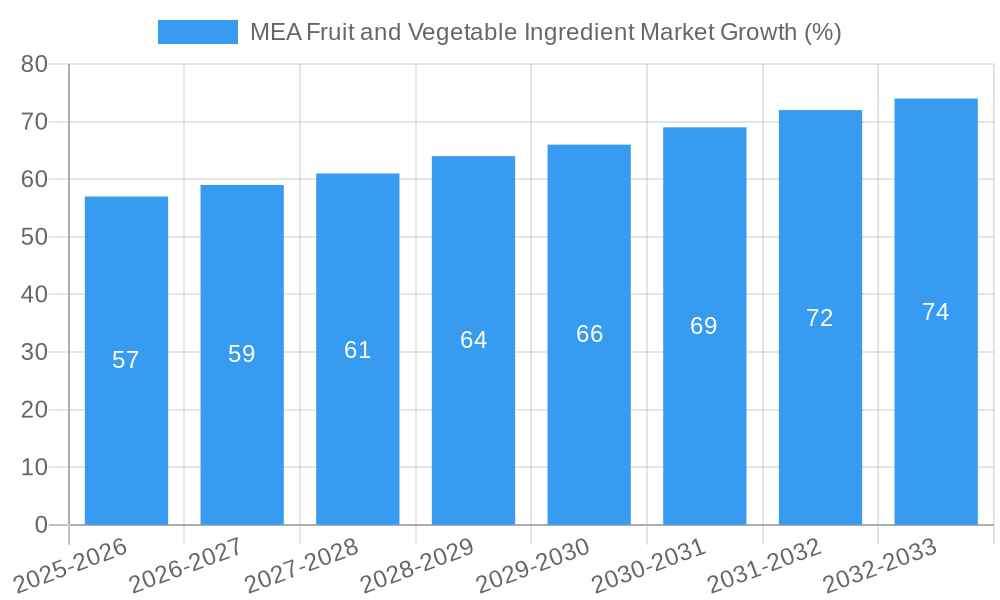
This section delves into the market's dynamic growth drivers, technological advancements, shifting consumer preferences, and the competitive intensity impacting the MEA fruit and vegetable ingredient sector. It examines the Compound Annual Growth Rate (CAGR) during the historical period (2019-2024) and projects the CAGR for the forecast period (2025-2033). The analysis incorporates factors such as increasing disposable incomes, changing dietary habits, and the rise of health-conscious consumers. The impact of technological disruptions, such as automation in processing and advanced preservation methods, on production efficiency and cost reduction is thoroughly analyzed. The competitive landscape is evaluated, considering strategies adopted by leading players, including pricing, product differentiation, and market expansion. Market penetration rates for different product types and applications are also presented. The impact of government policies, infrastructure, and economic factors will also be examined.
Dominant Regions & Segments in MEA Fruit and Vegetable Ingredient Market
This section identifies the leading regions and segments within the MEA fruit and vegetable ingredient market, analyzing their growth trajectories and underlying factors. The analysis covers both regional variations and segment-specific dynamics.
Dominant Regions: [Detailed analysis of specific countries within MEA, highlighting reasons for dominance - e.g., favorable climate for fruit/vegetable production, strong food processing industry, supportive government policies].
Dominant Segments:
Ingredient Type: [Analysis of Fruit vs. Vegetable dominance, reasons, and future growth potential].
Product Type: [Analysis of the most successful product types—Concentrates, Pastes and Purees, Pieces and Powders, NFC Juices—based on market size, growth rate, and drivers].
Application: [Analysis of the most dominant applications—Beverages, Confectionery Products, Bakery Products, Soups and Sauces, Dairy Products, RTE Products—and their growth drivers].
Key Drivers for Dominant Regions/Segments:
- Favorable climatic conditions
- Robust food processing infrastructure
- Supportive government policies and incentives
- High consumer demand for specific products
- Established distribution networks
MEA Fruit and Vegetable Ingredient Market Product Innovations
This section summarizes recent product developments, highlighting innovations in processing technologies, packaging, and formulations to enhance product quality, shelf life, and consumer appeal. New applications of fruit and vegetable ingredients in emerging food categories are also discussed. The competitive advantages offered by these innovations are analyzed, with a focus on their impact on market share and growth. Technological trends, such as the incorporation of natural preservatives and sustainable sourcing practices, are emphasized.
Report Scope & Segmentation Analysis
This report comprehensively segments the MEA fruit and vegetable ingredient market by ingredient type (Fruits, Vegetables), product type (Concentrates, Pastes and Purees, Pieces and Powders, NFC Juices), and application (Beverages, Confectionery Products, Bakery Products, Soups and Sauces, Dairy Products, RTE Products). Each segment's market size, growth projections, and competitive dynamics are analyzed, providing a granular understanding of the market landscape. Growth projections for each segment are detailed, accounting for market size variations and projected changes.
Key Drivers of MEA Fruit and Vegetable Ingredient Market Growth
The growth of the MEA fruit and vegetable ingredient market is propelled by several key factors. The rising demand for convenient, healthy, and processed foods is a major driver, coupled with the increasing adoption of fruit and vegetable-based products in diverse food applications. Technological advancements in processing and preservation contribute significantly to enhancing product quality and shelf life, thereby expanding market reach. Favorable government policies and investments in infrastructure further stimulate market growth.
Challenges in the MEA Fruit and Vegetable Ingredient Market Sector
Despite the significant growth potential, the MEA fruit and vegetable ingredient market faces certain challenges. Supply chain inefficiencies and logistical hurdles can impact the availability and cost of raw materials. Stringent regulatory requirements related to food safety and labeling standards may pose compliance challenges for businesses. Intense competition among established players and new entrants may create pricing pressures. Climate change and its impact on agricultural yields also pose a significant risk to the supply of raw materials.
Emerging Opportunities in MEA Fruit and Vegetable Ingredient Market
The MEA fruit and vegetable ingredient market presents several exciting opportunities. The growing demand for functional foods and nutraceuticals creates scope for innovation in ingredient formulations and product development. The increasing adoption of sustainable and ethical sourcing practices opens new avenues for businesses to enhance their brand image and attract environmentally conscious consumers. Expansion into untapped regional markets with high growth potential offers further opportunities for market penetration.
Leading Players in the MEA Fruit and Vegetable Ingredient Market Market
- Sunopta
- Dohler Group
- Nile Fruits
- AGRANA Beteiligungs-AG
- Archer Daniels Midland Company
- Kanegrade Ltd
- Sensient Technologies Corporation
- NRTC Nassar Al Refaee
Key Developments in MEA Fruit and Vegetable Ingredient Market Industry
- [Month/Year]: Launch of a new fruit concentrate with extended shelf life by [Company Name].
- [Month/Year]: Acquisition of a key fruit processing facility by [Company Name].
- [Month/Year]: Introduction of a new line of organic vegetable purees by [Company Name].
- [Month/Year]: Investment in sustainable sourcing practices by [Company Name].
Future Outlook for MEA Fruit and Vegetable Ingredient Market Market
The MEA fruit and vegetable ingredient market is poised for continued expansion driven by factors such as rising consumer demand, technological advancements, and favorable regulatory support. Strategic investments in infrastructure, sustainable practices, and product innovation will be crucial for businesses to capitalize on emerging opportunities and achieve sustainable growth. The market's future trajectory is highly promising, with significant potential for expansion across different product segments and geographical locations.
MEA Fruit and Vegetable Ingredient Market Segmentation
-
1. Ingredient Type
- 1.1. Fruits
- 1.2. Vegetables
-
2. Product Type
- 2.1. Concentrates
- 2.2. Pastes and Purees
- 2.3. Pieces and Powders
- 2.4. NFC Juices
-
3. Application
- 3.1. Beverages
- 3.2. Confectionery Products
- 3.3. Bakery Products
- 3.4. Soups and Sauces
- 3.5. Dairy Products
- 3.6. RTE Products
MEA Fruit and Vegetable Ingredient Market Segmentation By Geography
-
1. North America
- 1.1. United States
- 1.2. Canada
- 1.3. Mexico
-
2. South America
- 2.1. Brazil
- 2.2. Argentina
- 2.3. Rest of South America
-
3. Europe
- 3.1. United Kingdom
- 3.2. Germany
- 3.3. France
- 3.4. Italy
- 3.5. Spain
- 3.6. Russia
- 3.7. Benelux
- 3.8. Nordics
- 3.9. Rest of Europe
-
4. Middle East & Africa
- 4.1. Turkey
- 4.2. Israel
- 4.3. GCC
- 4.4. North Africa
- 4.5. South Africa
- 4.6. Rest of Middle East & Africa
-
5. Asia Pacific
- 5.1. China
- 5.2. India
- 5.3. Japan
- 5.4. South Korea
- 5.5. ASEAN
- 5.6. Oceania
- 5.7. Rest of Asia Pacific
MEA Fruit and Vegetable Ingredient Market REPORT HIGHLIGHTS
| Aspects | Details |
|---|---|
| Study Period | 2019-2033 |
| Base Year | 2024 |
| Estimated Year | 2025 |
| Forecast Period | 2025-2033 |
| Historical Period | 2019-2024 |
| Growth Rate | CAGR of 3.81% from 2019-2033 |
| Segmentation |
|
Table of Contents
- 1. Introduction
- 1.1. Research Scope
- 1.2. Market Segmentation
- 1.3. Research Methodology
- 1.4. Definitions and Assumptions
- 2. Executive Summary
- 2.1. Introduction
- 3. Market Dynamics
- 3.1. Introduction
- 3.2. Market Drivers
- 3.2.1. Increasing Demand for Protein-Rich Food; Increasing Demand for Plant-Based and Organic Ingredients
- 3.3. Market Restrains
- 3.3.1. Presence of Alternative Proteins
- 3.4. Market Trends
- 3.4.1. Innovative Use of Fruit and Vegetable Ingredients in Food and Beverage
- 4. Market Factor Analysis
- 4.1. Porters Five Forces
- 4.2. Supply/Value Chain
- 4.3. PESTEL analysis
- 4.4. Market Entropy
- 4.5. Patent/Trademark Analysis
- 5. Global MEA Fruit and Vegetable Ingredient Market Analysis, Insights and Forecast, 2019-2031
- 5.1. Market Analysis, Insights and Forecast - by Ingredient Type
- 5.1.1. Fruits
- 5.1.2. Vegetables
- 5.2. Market Analysis, Insights and Forecast - by Product Type
- 5.2.1. Concentrates
- 5.2.2. Pastes and Purees
- 5.2.3. Pieces and Powders
- 5.2.4. NFC Juices
- 5.3. Market Analysis, Insights and Forecast - by Application
- 5.3.1. Beverages
- 5.3.2. Confectionery Products
- 5.3.3. Bakery Products
- 5.3.4. Soups and Sauces
- 5.3.5. Dairy Products
- 5.3.6. RTE Products
- 5.4. Market Analysis, Insights and Forecast - by Region
- 5.4.1. North America
- 5.4.2. South America
- 5.4.3. Europe
- 5.4.4. Middle East & Africa
- 5.4.5. Asia Pacific
- 5.1. Market Analysis, Insights and Forecast - by Ingredient Type
- 6. North America MEA Fruit and Vegetable Ingredient Market Analysis, Insights and Forecast, 2019-2031
- 6.1. Market Analysis, Insights and Forecast - by Ingredient Type
- 6.1.1. Fruits
- 6.1.2. Vegetables
- 6.2. Market Analysis, Insights and Forecast - by Product Type
- 6.2.1. Concentrates
- 6.2.2. Pastes and Purees
- 6.2.3. Pieces and Powders
- 6.2.4. NFC Juices
- 6.3. Market Analysis, Insights and Forecast - by Application
- 6.3.1. Beverages
- 6.3.2. Confectionery Products
- 6.3.3. Bakery Products
- 6.3.4. Soups and Sauces
- 6.3.5. Dairy Products
- 6.3.6. RTE Products
- 6.1. Market Analysis, Insights and Forecast - by Ingredient Type
- 7. South America MEA Fruit and Vegetable Ingredient Market Analysis, Insights and Forecast, 2019-2031
- 7.1. Market Analysis, Insights and Forecast - by Ingredient Type
- 7.1.1. Fruits
- 7.1.2. Vegetables
- 7.2. Market Analysis, Insights and Forecast - by Product Type
- 7.2.1. Concentrates
- 7.2.2. Pastes and Purees
- 7.2.3. Pieces and Powders
- 7.2.4. NFC Juices
- 7.3. Market Analysis, Insights and Forecast - by Application
- 7.3.1. Beverages
- 7.3.2. Confectionery Products
- 7.3.3. Bakery Products
- 7.3.4. Soups and Sauces
- 7.3.5. Dairy Products
- 7.3.6. RTE Products
- 7.1. Market Analysis, Insights and Forecast - by Ingredient Type
- 8. Europe MEA Fruit and Vegetable Ingredient Market Analysis, Insights and Forecast, 2019-2031
- 8.1. Market Analysis, Insights and Forecast - by Ingredient Type
- 8.1.1. Fruits
- 8.1.2. Vegetables
- 8.2. Market Analysis, Insights and Forecast - by Product Type
- 8.2.1. Concentrates
- 8.2.2. Pastes and Purees
- 8.2.3. Pieces and Powders
- 8.2.4. NFC Juices
- 8.3. Market Analysis, Insights and Forecast - by Application
- 8.3.1. Beverages
- 8.3.2. Confectionery Products
- 8.3.3. Bakery Products
- 8.3.4. Soups and Sauces
- 8.3.5. Dairy Products
- 8.3.6. RTE Products
- 8.1. Market Analysis, Insights and Forecast - by Ingredient Type
- 9. Middle East & Africa MEA Fruit and Vegetable Ingredient Market Analysis, Insights and Forecast, 2019-2031
- 9.1. Market Analysis, Insights and Forecast - by Ingredient Type
- 9.1.1. Fruits
- 9.1.2. Vegetables
- 9.2. Market Analysis, Insights and Forecast - by Product Type
- 9.2.1. Concentrates
- 9.2.2. Pastes and Purees
- 9.2.3. Pieces and Powders
- 9.2.4. NFC Juices
- 9.3. Market Analysis, Insights and Forecast - by Application
- 9.3.1. Beverages
- 9.3.2. Confectionery Products
- 9.3.3. Bakery Products
- 9.3.4. Soups and Sauces
- 9.3.5. Dairy Products
- 9.3.6. RTE Products
- 9.1. Market Analysis, Insights and Forecast - by Ingredient Type
- 10. Asia Pacific MEA Fruit and Vegetable Ingredient Market Analysis, Insights and Forecast, 2019-2031
- 10.1. Market Analysis, Insights and Forecast - by Ingredient Type
- 10.1.1. Fruits
- 10.1.2. Vegetables
- 10.2. Market Analysis, Insights and Forecast - by Product Type
- 10.2.1. Concentrates
- 10.2.2. Pastes and Purees
- 10.2.3. Pieces and Powders
- 10.2.4. NFC Juices
- 10.3. Market Analysis, Insights and Forecast - by Application
- 10.3.1. Beverages
- 10.3.2. Confectionery Products
- 10.3.3. Bakery Products
- 10.3.4. Soups and Sauces
- 10.3.5. Dairy Products
- 10.3.6. RTE Products
- 10.1. Market Analysis, Insights and Forecast - by Ingredient Type
- 11. United Arab Emirates MEA Fruit and Vegetable Ingredient Market Analysis, Insights and Forecast, 2019-2031
- 12. South Africa MEA Fruit and Vegetable Ingredient Market Analysis, Insights and Forecast, 2019-2031
- 13. Rest Middle East & Africa MEA Fruit and Vegetable Ingredient Market Analysis, Insights and Forecast, 2019-2031
- 14. Competitive Analysis
- 14.1. Global Market Share Analysis 2024
- 14.2. Company Profiles
- 14.2.1 Sunopta
- 14.2.1.1. Overview
- 14.2.1.2. Products
- 14.2.1.3. SWOT Analysis
- 14.2.1.4. Recent Developments
- 14.2.1.5. Financials (Based on Availability)
- 14.2.2 Dohler Group
- 14.2.2.1. Overview
- 14.2.2.2. Products
- 14.2.2.3. SWOT Analysis
- 14.2.2.4. Recent Developments
- 14.2.2.5. Financials (Based on Availability)
- 14.2.3 Nile Fruits
- 14.2.3.1. Overview
- 14.2.3.2. Products
- 14.2.3.3. SWOT Analysis
- 14.2.3.4. Recent Developments
- 14.2.3.5. Financials (Based on Availability)
- 14.2.4 AGRANA Beteiligungs-AG
- 14.2.4.1. Overview
- 14.2.4.2. Products
- 14.2.4.3. SWOT Analysis
- 14.2.4.4. Recent Developments
- 14.2.4.5. Financials (Based on Availability)
- 14.2.5 Archer Daniels Midland Company
- 14.2.5.1. Overview
- 14.2.5.2. Products
- 14.2.5.3. SWOT Analysis
- 14.2.5.4. Recent Developments
- 14.2.5.5. Financials (Based on Availability)
- 14.2.6 Kanegrade Ltd*List Not Exhaustive
- 14.2.6.1. Overview
- 14.2.6.2. Products
- 14.2.6.3. SWOT Analysis
- 14.2.6.4. Recent Developments
- 14.2.6.5. Financials (Based on Availability)
- 14.2.7 Sensient Technologies Corporation
- 14.2.7.1. Overview
- 14.2.7.2. Products
- 14.2.7.3. SWOT Analysis
- 14.2.7.4. Recent Developments
- 14.2.7.5. Financials (Based on Availability)
- 14.2.8 NRTC Nassar Al Refaee
- 14.2.8.1. Overview
- 14.2.8.2. Products
- 14.2.8.3. SWOT Analysis
- 14.2.8.4. Recent Developments
- 14.2.8.5. Financials (Based on Availability)
- 14.2.1 Sunopta
List of Figures
- Figure 1: Global MEA Fruit and Vegetable Ingredient Market Revenue Breakdown (Million, %) by Region 2024 & 2032
- Figure 2: Global MEA Fruit and Vegetable Ingredient Market Volume Breakdown (K Tons, %) by Region 2024 & 2032
- Figure 3: Country MEA Fruit and Vegetable Ingredient Market Revenue (Million), by Country 2024 & 2032
- Figure 4: Country MEA Fruit and Vegetable Ingredient Market Volume (K Tons), by Country 2024 & 2032
- Figure 5: Country MEA Fruit and Vegetable Ingredient Market Revenue Share (%), by Country 2024 & 2032
- Figure 6: Country MEA Fruit and Vegetable Ingredient Market Volume Share (%), by Country 2024 & 2032
- Figure 7: North America MEA Fruit and Vegetable Ingredient Market Revenue (Million), by Ingredient Type 2024 & 2032
- Figure 8: North America MEA Fruit and Vegetable Ingredient Market Volume (K Tons), by Ingredient Type 2024 & 2032
- Figure 9: North America MEA Fruit and Vegetable Ingredient Market Revenue Share (%), by Ingredient Type 2024 & 2032
- Figure 10: North America MEA Fruit and Vegetable Ingredient Market Volume Share (%), by Ingredient Type 2024 & 2032
- Figure 11: North America MEA Fruit and Vegetable Ingredient Market Revenue (Million), by Product Type 2024 & 2032
- Figure 12: North America MEA Fruit and Vegetable Ingredient Market Volume (K Tons), by Product Type 2024 & 2032
- Figure 13: North America MEA Fruit and Vegetable Ingredient Market Revenue Share (%), by Product Type 2024 & 2032
- Figure 14: North America MEA Fruit and Vegetable Ingredient Market Volume Share (%), by Product Type 2024 & 2032
- Figure 15: North America MEA Fruit and Vegetable Ingredient Market Revenue (Million), by Application 2024 & 2032
- Figure 16: North America MEA Fruit and Vegetable Ingredient Market Volume (K Tons), by Application 2024 & 2032
- Figure 17: North America MEA Fruit and Vegetable Ingredient Market Revenue Share (%), by Application 2024 & 2032
- Figure 18: North America MEA Fruit and Vegetable Ingredient Market Volume Share (%), by Application 2024 & 2032
- Figure 19: North America MEA Fruit and Vegetable Ingredient Market Revenue (Million), by Country 2024 & 2032
- Figure 20: North America MEA Fruit and Vegetable Ingredient Market Volume (K Tons), by Country 2024 & 2032
- Figure 21: North America MEA Fruit and Vegetable Ingredient Market Revenue Share (%), by Country 2024 & 2032
- Figure 22: North America MEA Fruit and Vegetable Ingredient Market Volume Share (%), by Country 2024 & 2032
- Figure 23: South America MEA Fruit and Vegetable Ingredient Market Revenue (Million), by Ingredient Type 2024 & 2032
- Figure 24: South America MEA Fruit and Vegetable Ingredient Market Volume (K Tons), by Ingredient Type 2024 & 2032
- Figure 25: South America MEA Fruit and Vegetable Ingredient Market Revenue Share (%), by Ingredient Type 2024 & 2032
- Figure 26: South America MEA Fruit and Vegetable Ingredient Market Volume Share (%), by Ingredient Type 2024 & 2032
- Figure 27: South America MEA Fruit and Vegetable Ingredient Market Revenue (Million), by Product Type 2024 & 2032
- Figure 28: South America MEA Fruit and Vegetable Ingredient Market Volume (K Tons), by Product Type 2024 & 2032
- Figure 29: South America MEA Fruit and Vegetable Ingredient Market Revenue Share (%), by Product Type 2024 & 2032
- Figure 30: South America MEA Fruit and Vegetable Ingredient Market Volume Share (%), by Product Type 2024 & 2032
- Figure 31: South America MEA Fruit and Vegetable Ingredient Market Revenue (Million), by Application 2024 & 2032
- Figure 32: South America MEA Fruit and Vegetable Ingredient Market Volume (K Tons), by Application 2024 & 2032
- Figure 33: South America MEA Fruit and Vegetable Ingredient Market Revenue Share (%), by Application 2024 & 2032
- Figure 34: South America MEA Fruit and Vegetable Ingredient Market Volume Share (%), by Application 2024 & 2032
- Figure 35: South America MEA Fruit and Vegetable Ingredient Market Revenue (Million), by Country 2024 & 2032
- Figure 36: South America MEA Fruit and Vegetable Ingredient Market Volume (K Tons), by Country 2024 & 2032
- Figure 37: South America MEA Fruit and Vegetable Ingredient Market Revenue Share (%), by Country 2024 & 2032
- Figure 38: South America MEA Fruit and Vegetable Ingredient Market Volume Share (%), by Country 2024 & 2032
- Figure 39: Europe MEA Fruit and Vegetable Ingredient Market Revenue (Million), by Ingredient Type 2024 & 2032
- Figure 40: Europe MEA Fruit and Vegetable Ingredient Market Volume (K Tons), by Ingredient Type 2024 & 2032
- Figure 41: Europe MEA Fruit and Vegetable Ingredient Market Revenue Share (%), by Ingredient Type 2024 & 2032
- Figure 42: Europe MEA Fruit and Vegetable Ingredient Market Volume Share (%), by Ingredient Type 2024 & 2032
- Figure 43: Europe MEA Fruit and Vegetable Ingredient Market Revenue (Million), by Product Type 2024 & 2032
- Figure 44: Europe MEA Fruit and Vegetable Ingredient Market Volume (K Tons), by Product Type 2024 & 2032
- Figure 45: Europe MEA Fruit and Vegetable Ingredient Market Revenue Share (%), by Product Type 2024 & 2032
- Figure 46: Europe MEA Fruit and Vegetable Ingredient Market Volume Share (%), by Product Type 2024 & 2032
- Figure 47: Europe MEA Fruit and Vegetable Ingredient Market Revenue (Million), by Application 2024 & 2032
- Figure 48: Europe MEA Fruit and Vegetable Ingredient Market Volume (K Tons), by Application 2024 & 2032
- Figure 49: Europe MEA Fruit and Vegetable Ingredient Market Revenue Share (%), by Application 2024 & 2032
- Figure 50: Europe MEA Fruit and Vegetable Ingredient Market Volume Share (%), by Application 2024 & 2032
- Figure 51: Europe MEA Fruit and Vegetable Ingredient Market Revenue (Million), by Country 2024 & 2032
- Figure 52: Europe MEA Fruit and Vegetable Ingredient Market Volume (K Tons), by Country 2024 & 2032
- Figure 53: Europe MEA Fruit and Vegetable Ingredient Market Revenue Share (%), by Country 2024 & 2032
- Figure 54: Europe MEA Fruit and Vegetable Ingredient Market Volume Share (%), by Country 2024 & 2032
- Figure 55: Middle East & Africa MEA Fruit and Vegetable Ingredient Market Revenue (Million), by Ingredient Type 2024 & 2032
- Figure 56: Middle East & Africa MEA Fruit and Vegetable Ingredient Market Volume (K Tons), by Ingredient Type 2024 & 2032
- Figure 57: Middle East & Africa MEA Fruit and Vegetable Ingredient Market Revenue Share (%), by Ingredient Type 2024 & 2032
- Figure 58: Middle East & Africa MEA Fruit and Vegetable Ingredient Market Volume Share (%), by Ingredient Type 2024 & 2032
- Figure 59: Middle East & Africa MEA Fruit and Vegetable Ingredient Market Revenue (Million), by Product Type 2024 & 2032
- Figure 60: Middle East & Africa MEA Fruit and Vegetable Ingredient Market Volume (K Tons), by Product Type 2024 & 2032
- Figure 61: Middle East & Africa MEA Fruit and Vegetable Ingredient Market Revenue Share (%), by Product Type 2024 & 2032
- Figure 62: Middle East & Africa MEA Fruit and Vegetable Ingredient Market Volume Share (%), by Product Type 2024 & 2032
- Figure 63: Middle East & Africa MEA Fruit and Vegetable Ingredient Market Revenue (Million), by Application 2024 & 2032
- Figure 64: Middle East & Africa MEA Fruit and Vegetable Ingredient Market Volume (K Tons), by Application 2024 & 2032
- Figure 65: Middle East & Africa MEA Fruit and Vegetable Ingredient Market Revenue Share (%), by Application 2024 & 2032
- Figure 66: Middle East & Africa MEA Fruit and Vegetable Ingredient Market Volume Share (%), by Application 2024 & 2032
- Figure 67: Middle East & Africa MEA Fruit and Vegetable Ingredient Market Revenue (Million), by Country 2024 & 2032
- Figure 68: Middle East & Africa MEA Fruit and Vegetable Ingredient Market Volume (K Tons), by Country 2024 & 2032
- Figure 69: Middle East & Africa MEA Fruit and Vegetable Ingredient Market Revenue Share (%), by Country 2024 & 2032
- Figure 70: Middle East & Africa MEA Fruit and Vegetable Ingredient Market Volume Share (%), by Country 2024 & 2032
- Figure 71: Asia Pacific MEA Fruit and Vegetable Ingredient Market Revenue (Million), by Ingredient Type 2024 & 2032
- Figure 72: Asia Pacific MEA Fruit and Vegetable Ingredient Market Volume (K Tons), by Ingredient Type 2024 & 2032
- Figure 73: Asia Pacific MEA Fruit and Vegetable Ingredient Market Revenue Share (%), by Ingredient Type 2024 & 2032
- Figure 74: Asia Pacific MEA Fruit and Vegetable Ingredient Market Volume Share (%), by Ingredient Type 2024 & 2032
- Figure 75: Asia Pacific MEA Fruit and Vegetable Ingredient Market Revenue (Million), by Product Type 2024 & 2032
- Figure 76: Asia Pacific MEA Fruit and Vegetable Ingredient Market Volume (K Tons), by Product Type 2024 & 2032
- Figure 77: Asia Pacific MEA Fruit and Vegetable Ingredient Market Revenue Share (%), by Product Type 2024 & 2032
- Figure 78: Asia Pacific MEA Fruit and Vegetable Ingredient Market Volume Share (%), by Product Type 2024 & 2032
- Figure 79: Asia Pacific MEA Fruit and Vegetable Ingredient Market Revenue (Million), by Application 2024 & 2032
- Figure 80: Asia Pacific MEA Fruit and Vegetable Ingredient Market Volume (K Tons), by Application 2024 & 2032
- Figure 81: Asia Pacific MEA Fruit and Vegetable Ingredient Market Revenue Share (%), by Application 2024 & 2032
- Figure 82: Asia Pacific MEA Fruit and Vegetable Ingredient Market Volume Share (%), by Application 2024 & 2032
- Figure 83: Asia Pacific MEA Fruit and Vegetable Ingredient Market Revenue (Million), by Country 2024 & 2032
- Figure 84: Asia Pacific MEA Fruit and Vegetable Ingredient Market Volume (K Tons), by Country 2024 & 2032
- Figure 85: Asia Pacific MEA Fruit and Vegetable Ingredient Market Revenue Share (%), by Country 2024 & 2032
- Figure 86: Asia Pacific MEA Fruit and Vegetable Ingredient Market Volume Share (%), by Country 2024 & 2032
List of Tables
- Table 1: Global MEA Fruit and Vegetable Ingredient Market Revenue Million Forecast, by Region 2019 & 2032
- Table 2: Global MEA Fruit and Vegetable Ingredient Market Volume K Tons Forecast, by Region 2019 & 2032
- Table 3: Global MEA Fruit and Vegetable Ingredient Market Revenue Million Forecast, by Ingredient Type 2019 & 2032
- Table 4: Global MEA Fruit and Vegetable Ingredient Market Volume K Tons Forecast, by Ingredient Type 2019 & 2032
- Table 5: Global MEA Fruit and Vegetable Ingredient Market Revenue Million Forecast, by Product Type 2019 & 2032
- Table 6: Global MEA Fruit and Vegetable Ingredient Market Volume K Tons Forecast, by Product Type 2019 & 2032
- Table 7: Global MEA Fruit and Vegetable Ingredient Market Revenue Million Forecast, by Application 2019 & 2032
- Table 8: Global MEA Fruit and Vegetable Ingredient Market Volume K Tons Forecast, by Application 2019 & 2032
- Table 9: Global MEA Fruit and Vegetable Ingredient Market Revenue Million Forecast, by Region 2019 & 2032
- Table 10: Global MEA Fruit and Vegetable Ingredient Market Volume K Tons Forecast, by Region 2019 & 2032
- Table 11: Global MEA Fruit and Vegetable Ingredient Market Revenue Million Forecast, by Country 2019 & 2032
- Table 12: Global MEA Fruit and Vegetable Ingredient Market Volume K Tons Forecast, by Country 2019 & 2032
- Table 13: United Arab Emirates MEA Fruit and Vegetable Ingredient Market Revenue (Million) Forecast, by Application 2019 & 2032
- Table 14: United Arab Emirates MEA Fruit and Vegetable Ingredient Market Volume (K Tons) Forecast, by Application 2019 & 2032
- Table 15: South Africa MEA Fruit and Vegetable Ingredient Market Revenue (Million) Forecast, by Application 2019 & 2032
- Table 16: South Africa MEA Fruit and Vegetable Ingredient Market Volume (K Tons) Forecast, by Application 2019 & 2032
- Table 17: Rest Middle East & Africa MEA Fruit and Vegetable Ingredient Market Revenue (Million) Forecast, by Application 2019 & 2032
- Table 18: Rest Middle East & Africa MEA Fruit and Vegetable Ingredient Market Volume (K Tons) Forecast, by Application 2019 & 2032
- Table 19: Global MEA Fruit and Vegetable Ingredient Market Revenue Million Forecast, by Ingredient Type 2019 & 2032
- Table 20: Global MEA Fruit and Vegetable Ingredient Market Volume K Tons Forecast, by Ingredient Type 2019 & 2032
- Table 21: Global MEA Fruit and Vegetable Ingredient Market Revenue Million Forecast, by Product Type 2019 & 2032
- Table 22: Global MEA Fruit and Vegetable Ingredient Market Volume K Tons Forecast, by Product Type 2019 & 2032
- Table 23: Global MEA Fruit and Vegetable Ingredient Market Revenue Million Forecast, by Application 2019 & 2032
- Table 24: Global MEA Fruit and Vegetable Ingredient Market Volume K Tons Forecast, by Application 2019 & 2032
- Table 25: Global MEA Fruit and Vegetable Ingredient Market Revenue Million Forecast, by Country 2019 & 2032
- Table 26: Global MEA Fruit and Vegetable Ingredient Market Volume K Tons Forecast, by Country 2019 & 2032
- Table 27: United States MEA Fruit and Vegetable Ingredient Market Revenue (Million) Forecast, by Application 2019 & 2032
- Table 28: United States MEA Fruit and Vegetable Ingredient Market Volume (K Tons) Forecast, by Application 2019 & 2032
- Table 29: Canada MEA Fruit and Vegetable Ingredient Market Revenue (Million) Forecast, by Application 2019 & 2032
- Table 30: Canada MEA Fruit and Vegetable Ingredient Market Volume (K Tons) Forecast, by Application 2019 & 2032
- Table 31: Mexico MEA Fruit and Vegetable Ingredient Market Revenue (Million) Forecast, by Application 2019 & 2032
- Table 32: Mexico MEA Fruit and Vegetable Ingredient Market Volume (K Tons) Forecast, by Application 2019 & 2032
- Table 33: Global MEA Fruit and Vegetable Ingredient Market Revenue Million Forecast, by Ingredient Type 2019 & 2032
- Table 34: Global MEA Fruit and Vegetable Ingredient Market Volume K Tons Forecast, by Ingredient Type 2019 & 2032
- Table 35: Global MEA Fruit and Vegetable Ingredient Market Revenue Million Forecast, by Product Type 2019 & 2032
- Table 36: Global MEA Fruit and Vegetable Ingredient Market Volume K Tons Forecast, by Product Type 2019 & 2032
- Table 37: Global MEA Fruit and Vegetable Ingredient Market Revenue Million Forecast, by Application 2019 & 2032
- Table 38: Global MEA Fruit and Vegetable Ingredient Market Volume K Tons Forecast, by Application 2019 & 2032
- Table 39: Global MEA Fruit and Vegetable Ingredient Market Revenue Million Forecast, by Country 2019 & 2032
- Table 40: Global MEA Fruit and Vegetable Ingredient Market Volume K Tons Forecast, by Country 2019 & 2032
- Table 41: Brazil MEA Fruit and Vegetable Ingredient Market Revenue (Million) Forecast, by Application 2019 & 2032
- Table 42: Brazil MEA Fruit and Vegetable Ingredient Market Volume (K Tons) Forecast, by Application 2019 & 2032
- Table 43: Argentina MEA Fruit and Vegetable Ingredient Market Revenue (Million) Forecast, by Application 2019 & 2032
- Table 44: Argentina MEA Fruit and Vegetable Ingredient Market Volume (K Tons) Forecast, by Application 2019 & 2032
- Table 45: Rest of South America MEA Fruit and Vegetable Ingredient Market Revenue (Million) Forecast, by Application 2019 & 2032
- Table 46: Rest of South America MEA Fruit and Vegetable Ingredient Market Volume (K Tons) Forecast, by Application 2019 & 2032
- Table 47: Global MEA Fruit and Vegetable Ingredient Market Revenue Million Forecast, by Ingredient Type 2019 & 2032
- Table 48: Global MEA Fruit and Vegetable Ingredient Market Volume K Tons Forecast, by Ingredient Type 2019 & 2032
- Table 49: Global MEA Fruit and Vegetable Ingredient Market Revenue Million Forecast, by Product Type 2019 & 2032
- Table 50: Global MEA Fruit and Vegetable Ingredient Market Volume K Tons Forecast, by Product Type 2019 & 2032
- Table 51: Global MEA Fruit and Vegetable Ingredient Market Revenue Million Forecast, by Application 2019 & 2032
- Table 52: Global MEA Fruit and Vegetable Ingredient Market Volume K Tons Forecast, by Application 2019 & 2032
- Table 53: Global MEA Fruit and Vegetable Ingredient Market Revenue Million Forecast, by Country 2019 & 2032
- Table 54: Global MEA Fruit and Vegetable Ingredient Market Volume K Tons Forecast, by Country 2019 & 2032
- Table 55: United Kingdom MEA Fruit and Vegetable Ingredient Market Revenue (Million) Forecast, by Application 2019 & 2032
- Table 56: United Kingdom MEA Fruit and Vegetable Ingredient Market Volume (K Tons) Forecast, by Application 2019 & 2032
- Table 57: Germany MEA Fruit and Vegetable Ingredient Market Revenue (Million) Forecast, by Application 2019 & 2032
- Table 58: Germany MEA Fruit and Vegetable Ingredient Market Volume (K Tons) Forecast, by Application 2019 & 2032
- Table 59: France MEA Fruit and Vegetable Ingredient Market Revenue (Million) Forecast, by Application 2019 & 2032
- Table 60: France MEA Fruit and Vegetable Ingredient Market Volume (K Tons) Forecast, by Application 2019 & 2032
- Table 61: Italy MEA Fruit and Vegetable Ingredient Market Revenue (Million) Forecast, by Application 2019 & 2032
- Table 62: Italy MEA Fruit and Vegetable Ingredient Market Volume (K Tons) Forecast, by Application 2019 & 2032
- Table 63: Spain MEA Fruit and Vegetable Ingredient Market Revenue (Million) Forecast, by Application 2019 & 2032
- Table 64: Spain MEA Fruit and Vegetable Ingredient Market Volume (K Tons) Forecast, by Application 2019 & 2032
- Table 65: Russia MEA Fruit and Vegetable Ingredient Market Revenue (Million) Forecast, by Application 2019 & 2032
- Table 66: Russia MEA Fruit and Vegetable Ingredient Market Volume (K Tons) Forecast, by Application 2019 & 2032
- Table 67: Benelux MEA Fruit and Vegetable Ingredient Market Revenue (Million) Forecast, by Application 2019 & 2032
- Table 68: Benelux MEA Fruit and Vegetable Ingredient Market Volume (K Tons) Forecast, by Application 2019 & 2032
- Table 69: Nordics MEA Fruit and Vegetable Ingredient Market Revenue (Million) Forecast, by Application 2019 & 2032
- Table 70: Nordics MEA Fruit and Vegetable Ingredient Market Volume (K Tons) Forecast, by Application 2019 & 2032
- Table 71: Rest of Europe MEA Fruit and Vegetable Ingredient Market Revenue (Million) Forecast, by Application 2019 & 2032
- Table 72: Rest of Europe MEA Fruit and Vegetable Ingredient Market Volume (K Tons) Forecast, by Application 2019 & 2032
- Table 73: Global MEA Fruit and Vegetable Ingredient Market Revenue Million Forecast, by Ingredient Type 2019 & 2032
- Table 74: Global MEA Fruit and Vegetable Ingredient Market Volume K Tons Forecast, by Ingredient Type 2019 & 2032
- Table 75: Global MEA Fruit and Vegetable Ingredient Market Revenue Million Forecast, by Product Type 2019 & 2032
- Table 76: Global MEA Fruit and Vegetable Ingredient Market Volume K Tons Forecast, by Product Type 2019 & 2032
- Table 77: Global MEA Fruit and Vegetable Ingredient Market Revenue Million Forecast, by Application 2019 & 2032
- Table 78: Global MEA Fruit and Vegetable Ingredient Market Volume K Tons Forecast, by Application 2019 & 2032
- Table 79: Global MEA Fruit and Vegetable Ingredient Market Revenue Million Forecast, by Country 2019 & 2032
- Table 80: Global MEA Fruit and Vegetable Ingredient Market Volume K Tons Forecast, by Country 2019 & 2032
- Table 81: Turkey MEA Fruit and Vegetable Ingredient Market Revenue (Million) Forecast, by Application 2019 & 2032
- Table 82: Turkey MEA Fruit and Vegetable Ingredient Market Volume (K Tons) Forecast, by Application 2019 & 2032
- Table 83: Israel MEA Fruit and Vegetable Ingredient Market Revenue (Million) Forecast, by Application 2019 & 2032
- Table 84: Israel MEA Fruit and Vegetable Ingredient Market Volume (K Tons) Forecast, by Application 2019 & 2032
- Table 85: GCC MEA Fruit and Vegetable Ingredient Market Revenue (Million) Forecast, by Application 2019 & 2032
- Table 86: GCC MEA Fruit and Vegetable Ingredient Market Volume (K Tons) Forecast, by Application 2019 & 2032
- Table 87: North Africa MEA Fruit and Vegetable Ingredient Market Revenue (Million) Forecast, by Application 2019 & 2032
- Table 88: North Africa MEA Fruit and Vegetable Ingredient Market Volume (K Tons) Forecast, by Application 2019 & 2032
- Table 89: South Africa MEA Fruit and Vegetable Ingredient Market Revenue (Million) Forecast, by Application 2019 & 2032
- Table 90: South Africa MEA Fruit and Vegetable Ingredient Market Volume (K Tons) Forecast, by Application 2019 & 2032
- Table 91: Rest of Middle East & Africa MEA Fruit and Vegetable Ingredient Market Revenue (Million) Forecast, by Application 2019 & 2032
- Table 92: Rest of Middle East & Africa MEA Fruit and Vegetable Ingredient Market Volume (K Tons) Forecast, by Application 2019 & 2032
- Table 93: Global MEA Fruit and Vegetable Ingredient Market Revenue Million Forecast, by Ingredient Type 2019 & 2032
- Table 94: Global MEA Fruit and Vegetable Ingredient Market Volume K Tons Forecast, by Ingredient Type 2019 & 2032
- Table 95: Global MEA Fruit and Vegetable Ingredient Market Revenue Million Forecast, by Product Type 2019 & 2032
- Table 96: Global MEA Fruit and Vegetable Ingredient Market Volume K Tons Forecast, by Product Type 2019 & 2032
- Table 97: Global MEA Fruit and Vegetable Ingredient Market Revenue Million Forecast, by Application 2019 & 2032
- Table 98: Global MEA Fruit and Vegetable Ingredient Market Volume K Tons Forecast, by Application 2019 & 2032
- Table 99: Global MEA Fruit and Vegetable Ingredient Market Revenue Million Forecast, by Country 2019 & 2032
- Table 100: Global MEA Fruit and Vegetable Ingredient Market Volume K Tons Forecast, by Country 2019 & 2032
- Table 101: China MEA Fruit and Vegetable Ingredient Market Revenue (Million) Forecast, by Application 2019 & 2032
- Table 102: China MEA Fruit and Vegetable Ingredient Market Volume (K Tons) Forecast, by Application 2019 & 2032
- Table 103: India MEA Fruit and Vegetable Ingredient Market Revenue (Million) Forecast, by Application 2019 & 2032
- Table 104: India MEA Fruit and Vegetable Ingredient Market Volume (K Tons) Forecast, by Application 2019 & 2032
- Table 105: Japan MEA Fruit and Vegetable Ingredient Market Revenue (Million) Forecast, by Application 2019 & 2032
- Table 106: Japan MEA Fruit and Vegetable Ingredient Market Volume (K Tons) Forecast, by Application 2019 & 2032
- Table 107: South Korea MEA Fruit and Vegetable Ingredient Market Revenue (Million) Forecast, by Application 2019 & 2032
- Table 108: South Korea MEA Fruit and Vegetable Ingredient Market Volume (K Tons) Forecast, by Application 2019 & 2032
- Table 109: ASEAN MEA Fruit and Vegetable Ingredient Market Revenue (Million) Forecast, by Application 2019 & 2032
- Table 110: ASEAN MEA Fruit and Vegetable Ingredient Market Volume (K Tons) Forecast, by Application 2019 & 2032
- Table 111: Oceania MEA Fruit and Vegetable Ingredient Market Revenue (Million) Forecast, by Application 2019 & 2032
- Table 112: Oceania MEA Fruit and Vegetable Ingredient Market Volume (K Tons) Forecast, by Application 2019 & 2032
- Table 113: Rest of Asia Pacific MEA Fruit and Vegetable Ingredient Market Revenue (Million) Forecast, by Application 2019 & 2032
- Table 114: Rest of Asia Pacific MEA Fruit and Vegetable Ingredient Market Volume (K Tons) Forecast, by Application 2019 & 2032
Frequently Asked Questions
1. What is the projected Compound Annual Growth Rate (CAGR) of the MEA Fruit and Vegetable Ingredient Market?
The projected CAGR is approximately 3.81%.
2. Which companies are prominent players in the MEA Fruit and Vegetable Ingredient Market?
Key companies in the market include Sunopta, Dohler Group, Nile Fruits, AGRANA Beteiligungs-AG, Archer Daniels Midland Company, Kanegrade Ltd*List Not Exhaustive, Sensient Technologies Corporation, NRTC Nassar Al Refaee.
3. What are the main segments of the MEA Fruit and Vegetable Ingredient Market?
The market segments include Ingredient Type, Product Type, Application.
4. Can you provide details about the market size?
The market size is estimated to be USD XX Million as of 2022.
5. What are some drivers contributing to market growth?
Increasing Demand for Protein-Rich Food; Increasing Demand for Plant-Based and Organic Ingredients.
6. What are the notable trends driving market growth?
Innovative Use of Fruit and Vegetable Ingredients in Food and Beverage.
7. Are there any restraints impacting market growth?
Presence of Alternative Proteins.
8. Can you provide examples of recent developments in the market?
N/A
9. What pricing options are available for accessing the report?
Pricing options include single-user, multi-user, and enterprise licenses priced at USD 4750, USD 5250, and USD 8750 respectively.
10. Is the market size provided in terms of value or volume?
The market size is provided in terms of value, measured in Million and volume, measured in K Tons.
11. Are there any specific market keywords associated with the report?
Yes, the market keyword associated with the report is "MEA Fruit and Vegetable Ingredient Market," which aids in identifying and referencing the specific market segment covered.
12. How do I determine which pricing option suits my needs best?
The pricing options vary based on user requirements and access needs. Individual users may opt for single-user licenses, while businesses requiring broader access may choose multi-user or enterprise licenses for cost-effective access to the report.
13. Are there any additional resources or data provided in the MEA Fruit and Vegetable Ingredient Market report?
While the report offers comprehensive insights, it's advisable to review the specific contents or supplementary materials provided to ascertain if additional resources or data are available.
14. How can I stay updated on further developments or reports in the MEA Fruit and Vegetable Ingredient Market?
To stay informed about further developments, trends, and reports in the MEA Fruit and Vegetable Ingredient Market, consider subscribing to industry newsletters, following relevant companies and organizations, or regularly checking reputable industry news sources and publications.
Methodology
Step 1 - Identification of Relevant Samples Size from Population Database


Step 2 - Approaches for Defining Global Market Size (Value, Volume* & Price*)

Note*: In applicable scenarios
Step 3 - Data Sources
Primary Research
- Web Analytics
- Survey Reports
- Research Institute
- Latest Research Reports
- Opinion Leaders
Secondary Research
- Annual Reports
- White Paper
- Latest Press Release
- Industry Association
- Paid Database
- Investor Presentations

Step 4 - Data Triangulation
Involves using different sources of information in order to increase the validity of a study
These sources are likely to be stakeholders in a program - participants, other researchers, program staff, other community members, and so on.
Then we put all data in single framework & apply various statistical tools to find out the dynamic on the market.
During the analysis stage, feedback from the stakeholder groups would be compared to determine areas of agreement as well as areas of divergence


