

Key Insights
The Middle East and Africa (MEA) waterborne adhesives market is projected for significant expansion, with an estimated market size of 38.63 billion by 2024, driven by a compound annual growth rate (CAGR) of 9.5%. This growth is largely attributed to the thriving building and construction sector, supported by ongoing infrastructure development and urbanization. The increasing adoption of sustainable, eco-friendly adhesive solutions, replacing solvent-based alternatives due to stringent environmental regulations and heightened consumer awareness, is a key market driver. Innovations in resin technologies, including Acrylics, Polyvinyl Acetate (PVA) Emulsion, and Ethylene Vinyl Acetate (EVA) Emulsion, are enhancing performance and expanding application scope. The paper, board, and packaging industry also presents a substantial growth opportunity, fueled by e-commerce expansion and the demand for sustainable packaging.
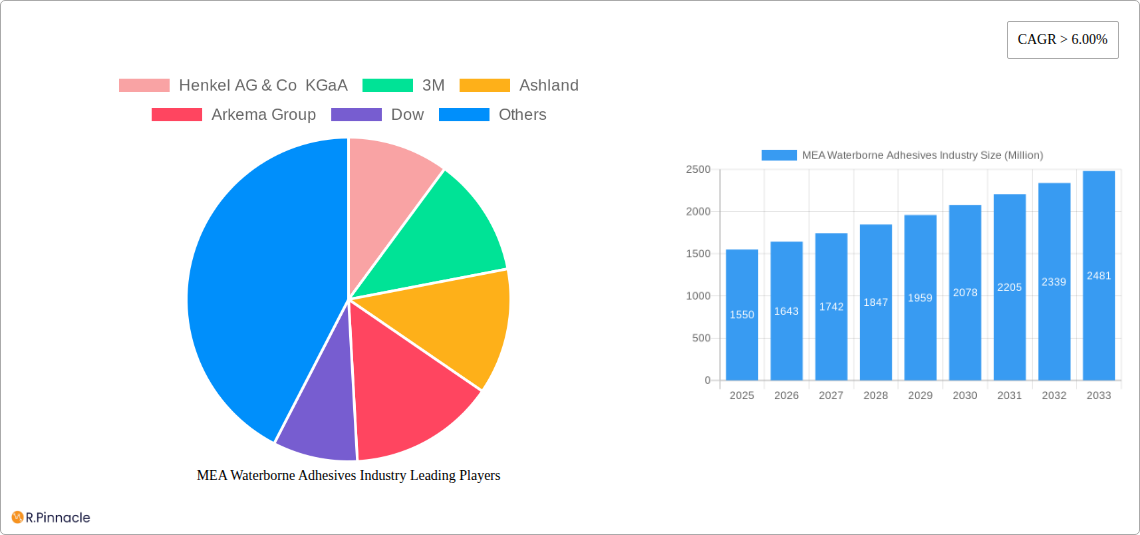
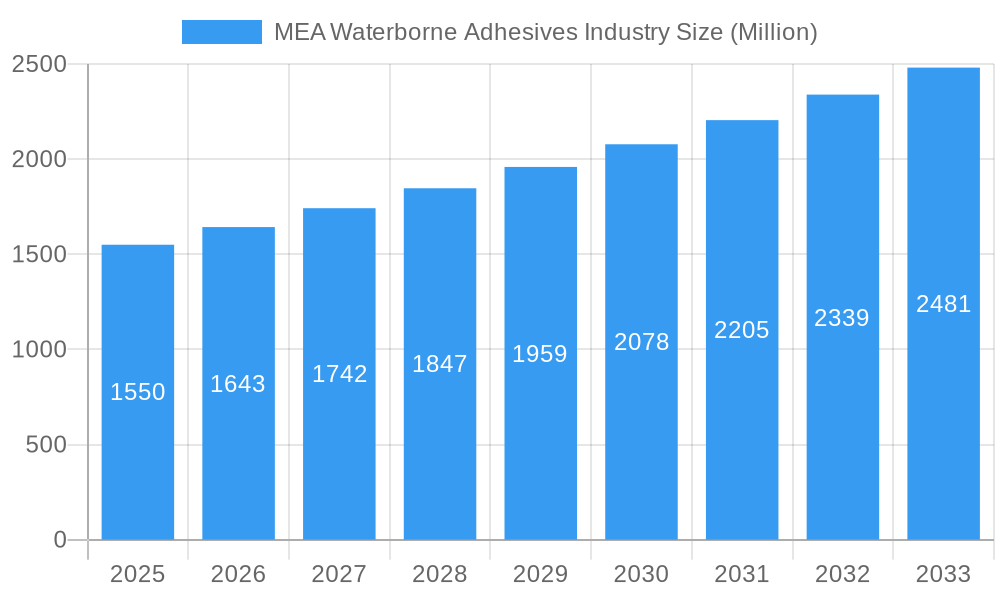
MEA Waterborne Adhesives Industry Market Size (In Billion)
Market challenges, such as the initial cost of advanced waterborne adhesive formulations and the requirement for specialized application equipment, are being mitigated by long-term cost efficiencies and environmental benefits. Geographically, Saudi Arabia is anticipated to dominate the market value, driven by its Vision 2030 initiatives and extensive construction projects. South Africa and the broader Rest of MEA region are also demonstrating strong growth potential, propelled by industrialization and the increasing uptake of advanced materials. Leading companies, including Henkel AG & Co KGaA, 3M, Ashland, Arkema Group, and Dow, are actively investing in R&D to meet the evolving demands of end-user industries such as woodworking & joinery, transportation, healthcare, and electrical & electronics.
MEA Waterborne Adhesives Industry Company Market Share
This comprehensive report offers in-depth analysis of the MEA waterborne adhesives market, providing critical insights into its current status, future projections, and strategic opportunities. Spanning from 2019 to 2033, with a base year of 2024, and a forecast period from 2024 to 2033, this report equips stakeholders with actionable intelligence for this dynamic sector.
MEA Waterborne Adhesives Industry Market Structure & Innovation Trends
The MEA waterborne adhesives market exhibits a moderately concentrated structure, with key global players like Henkel AG & Co KGaA, 3M, and Ashland holding significant market share, estimated to be around 45% combined in the base year 2025. Innovation is primarily driven by the increasing demand for sustainable and eco-friendly adhesive solutions, spurred by stringent environmental regulations and growing consumer awareness. Regulatory frameworks are progressively evolving to favor low-VOC (Volatile Organic Compound) products, pushing manufacturers towards water-based formulations. Product substitutes, such as solvent-based adhesives and mechanical fastening methods, continue to pose a challenge, but the inherent advantages of waterborne adhesives, including safety and ease of use, are gradually eroding their market penetration. End-user demographics are shifting, with a growing preference for adhesives in the building & construction and paper, board, and packaging sectors. Mergers and acquisitions (M&A) activities, while not as prevalent as in more mature markets, are expected to increase as companies seek to expand their geographical reach and product portfolios. Estimated M&A deal values in the past three years have ranged from xx Million to xx Million.
MEA Waterborne Adhesives Industry Market Dynamics & Trends
The MEA waterborne adhesives market is poised for robust growth, with an estimated Compound Annual Growth Rate (CAGR) of approximately 6.8% during the forecast period (2025–2033). This expansion is fueled by a confluence of factors, including rapid urbanization and infrastructure development across various MEA nations, particularly in the building and construction sector, which is a primary consumer of waterborne adhesives. The escalating demand for sustainable packaging solutions, driven by e-commerce growth and increasing environmental consciousness, further propels the adoption of waterborne adhesives in the paper, board, and packaging segment. Technological advancements are continuously improving the performance characteristics of waterborne adhesives, such as enhanced bond strength, faster drying times, and improved water resistance, making them increasingly competitive with traditional solvent-based alternatives. Consumer preferences are shifting towards safer and more environmentally friendly products, directly benefiting the waterborne adhesives market. Competitive dynamics are characterized by a mix of global chemical giants and regional manufacturers, all vying for market share through product innovation, strategic partnerships, and competitive pricing. Market penetration is projected to reach xx% by 2033, driven by increased awareness of the benefits of waterborne adhesives and their expanding application range. The shift from traditional solvent-based adhesives to waterborne alternatives is a significant trend, supported by favorable government policies aimed at reducing industrial pollution and promoting greener alternatives. Furthermore, the growing automotive industry in certain MEA regions is creating new avenues for waterborne adhesives in lightweighting and assembly processes. The healthcare sector's increasing reliance on specialized adhesives for medical devices and packaging also contributes to market expansion.
Dominant Regions & Segments in MEA Waterborne Adhesives Industry
The MEA waterborne adhesives industry is characterized by significant regional variations in demand and application. Saudi Arabia emerges as a dominant region, driven by its ambitious infrastructure projects and substantial investments in the construction sector, creating a strong demand for adhesives in building and construction applications.
- Key Drivers in Saudi Arabia:
- Vision 2030 initiatives fueling mega-projects in construction and real estate.
- Government focus on diversification away from oil, leading to industrial growth.
- Increasing adoption of sustainable building materials and practices.
Among the resin types, Acrylics hold a dominant position, accounting for an estimated xx% of the market share in 2025. This is attributed to their versatility, excellent adhesion properties, and wide range of applications across various end-user industries.
- Dominance of Acrylics:
- Superior weatherability and UV resistance make them ideal for outdoor applications in construction.
- Versatile formulations cater to diverse bonding needs in paper, packaging, and woodworking.
- Continuous innovation in acrylic resin technology enhances performance and reduces costs.
In terms of end-user industries, Building & Construction is the leading segment, projected to account for xx% of the total MEA waterborne adhesives market by 2025. The ongoing urban development, coupled with a growing emphasis on sustainable and energy-efficient buildings, significantly boosts the demand for high-performance waterborne adhesives.
- Dominance of Building & Construction:
- Extensive use in flooring, tiling, window and door sealing, and structural bonding.
- Demand for adhesives that can withstand harsh environmental conditions, prevalent in parts of the MEA region.
- Growth in residential, commercial, and industrial construction projects.
The Rest of Middle-East and Africa collectively represents a significant and rapidly growing market. This sub-region is experiencing increased industrialization, particularly in countries like the UAE, Egypt, and Nigeria, which are driving demand across multiple sectors.
- Key Drivers in Rest of Middle-East and Africa:
- Growing manufacturing base for consumer goods and packaging.
- Emerging opportunities in the automotive assembly and repair sectors.
- Increasing disposable incomes leading to higher demand for packaged goods.
Polyvinyl Acetate (PVA) Emulsion also holds a substantial market share, particularly in the paper, board, and packaging, and woodworking segments, due to its cost-effectiveness and good performance in these applications.
- Significance of PVA Emulsion:
- Cost-effective bonding solution for paper-based products and packaging.
- Widely used in furniture manufacturing and joinery.
- Environmentally friendly profile aligns with growing sustainability concerns.
MEA Waterborne Adhesives Industry Product Innovations
Product innovations in the MEA waterborne adhesives industry are primarily focused on enhancing sustainability, performance, and application efficiency. Manufacturers are developing low-VOC and formaldehyde-free formulations to meet stringent environmental regulations and consumer demand for safer products. Advancements in acrylic and polyurethane-based waterborne adhesives are yielding improved adhesion to challenging substrates, faster curing times, and enhanced durability, expanding their applicability in sectors like transportation and electronics. Innovations are also targeting ease of application, with a focus on sprayable and high-tack formulations for automated processes. These developments are creating competitive advantages by offering superior performance characteristics and cost-effectiveness compared to traditional adhesive technologies, catering to evolving market needs for greener and more efficient bonding solutions.
Report Scope & Segmentation Analysis
This report segments the MEA waterborne adhesives market by Resin Type into Acrylics, Polyvinyl Acetate (PVA) Emulsion, Ethylene Vinyl Acetate (EVA) Emulsion, Polyurethane, and Other Resin Types. Growth projections for Acrylics are strong due to their versatility, while PVA Emulsion continues to dominate in cost-sensitive applications. The End-user Industry segmentation includes Building & Construction, Paper, Board, and Packaging, Woodworking & Joinery, Transportation, Healthcare, Electrical & Electronics, and Other End-user Industries. Building & Construction is expected to maintain its leading position, driven by infrastructure development. The Geography segmentation covers Saudi Arabia, South Africa, and the Rest of Middle-East and Africa. Saudi Arabia is a key growth market due to its construction boom, while the Rest of MEA presents significant untapped potential across various industries. Market sizes and competitive dynamics are analyzed within each segment, with a focus on identifying growth opportunities and challenges.
Key Drivers of MEA Waterborne Adhesives Industry Growth
The MEA waterborne adhesives industry is propelled by several key drivers. Economic growth and infrastructure development across the region, particularly in Saudi Arabia and the UAE, significantly boost demand in the building & construction sector. The escalating demand for sustainable and eco-friendly products, driven by government regulations and increasing consumer awareness, favors waterborne adhesives over solvent-based alternatives. Technological advancements are leading to improved performance characteristics, such as enhanced bond strength and faster curing times, making waterborne adhesives more competitive. The growth of the packaging industry, fueled by e-commerce expansion and changing consumer lifestyles, is another critical driver. Additionally, a shift towards safer working environments in manufacturing and construction further promotes the adoption of low-VOC waterborne adhesives.
Challenges in the MEA Waterborne Adhesives Industry Sector
Despite robust growth prospects, the MEA waterborne adhesives industry faces several challenges. High initial investment costs for R&D and production can be a barrier for smaller regional players. Price volatility of raw materials, such as petrochemical derivatives, can impact profit margins. The presence of established solvent-based adhesive markets and a degree of inertia in adoption rates present competitive pressure. Limited awareness and technical expertise in certain sub-sectors and less developed regions can hinder market penetration. Furthermore, inadequate infrastructure and logistical challenges in some parts of Africa can affect supply chain efficiency. Ensuring consistent product quality across diverse environmental conditions also poses a challenge.
Emerging Opportunities in MEA Waterborne Adhesives Industry
Emerging opportunities within the MEA waterborne adhesives industry are diverse and promising. The growing demand for sustainable packaging solutions in the booming e-commerce sector presents a significant avenue for growth. The automotive industry's expansion, particularly in countries like Egypt and South Africa, offers opportunities for lightweighting and assembly adhesives. The increasing focus on renewable energy projects, such as solar panel installations, requires specialized adhesives. The healthcare sector's growth, with its rising demand for medical devices and sterile packaging, opens new application frontiers. Furthermore, advancements in bio-based waterborne adhesives offer a strong niche for environmentally conscious consumers and industries. The increasing disposable income across the region is also driving demand for higher-quality consumer goods, indirectly benefiting the adhesives market.
Leading Players in the MEA Waterborne Adhesives Industry Market
- Henkel AG & Co KGaA
- 3M
- Ashland
- Arkema Group
- Dow
- Avery Dennison Corporation
- Sika AG
- Wacker Chemie AG
Key Developments in MEA Waterborne Adhesives Industry Industry
- 2024: Launch of a new range of low-VOC acrylic-based adhesives by Arkema Group for improved sustainability in construction applications.
- 2023: Dow expands its waterborne adhesive portfolio with advanced solutions for flexible packaging in the Middle East.
- 2022: Henkel AG & Co KGaA invests in R&D for enhanced polyurethane waterborne adhesives to cater to the transportation sector in MEA.
- 2021: Ashland introduces innovative PVA emulsions with improved performance characteristics for the paper and packaging industry in Africa.
- 2020: Sika AG announces strategic partnerships to bolster its presence in the Saudi Arabian construction adhesives market.
Future Outlook for MEA Waterborne Adhesives Industry Market
The future outlook for the MEA waterborne adhesives industry is exceptionally bright, characterized by sustained high growth rates driven by a confluence of megatrends. The increasing emphasis on sustainability and circular economy principles will continue to favor waterborne formulations, leading to a gradual displacement of solvent-based alternatives. Infrastructure development and urbanization projects across the region will remain a primary growth engine for the construction sector. The expanding middle class and rising disposable incomes will fuel demand for packaged goods and durable consumer products, thereby boosting the paper, board, and packaging, and woodworking segments. Continuous innovation in product performance and application technologies will unlock new market segments and solidify the competitive advantage of waterborne adhesives. Strategic investments in regional manufacturing capabilities and distribution networks will be crucial for market leaders to capitalize on the untapped potential across the diverse MEA landscape. The market is projected to witness increased collaboration and potential consolidation as companies seek to leverage synergies and expand their market footprint.
MEA Waterborne Adhesives Industry Segmentation
-
1. Resin Type
- 1.1. Acrylics
- 1.2. Polyvinyl Acetate (PVA) Emulsion
- 1.3. Ethylene Vinyl Acetate (EVA) Emulsion
- 1.4. Polyuret
- 1.5. Other Resin Types
-
2. End-user Industry
- 2.1. Building & Construction
- 2.2. Paper, Board, and Packaging
- 2.3. Woodworking & Joinery
- 2.4. Transportation
- 2.5. Healthcare
- 2.6. Electrical & Electronics
- 2.7. Other End-user Industries
-
3. Geography
- 3.1. Saudi Arabia
- 3.2. South Africa
- 3.3. Rest of Middle-East and Africa
MEA Waterborne Adhesives Industry Segmentation By Geography
- 1. Saudi Arabia
- 2. South Africa
- 3. Rest of Middle East and Africa
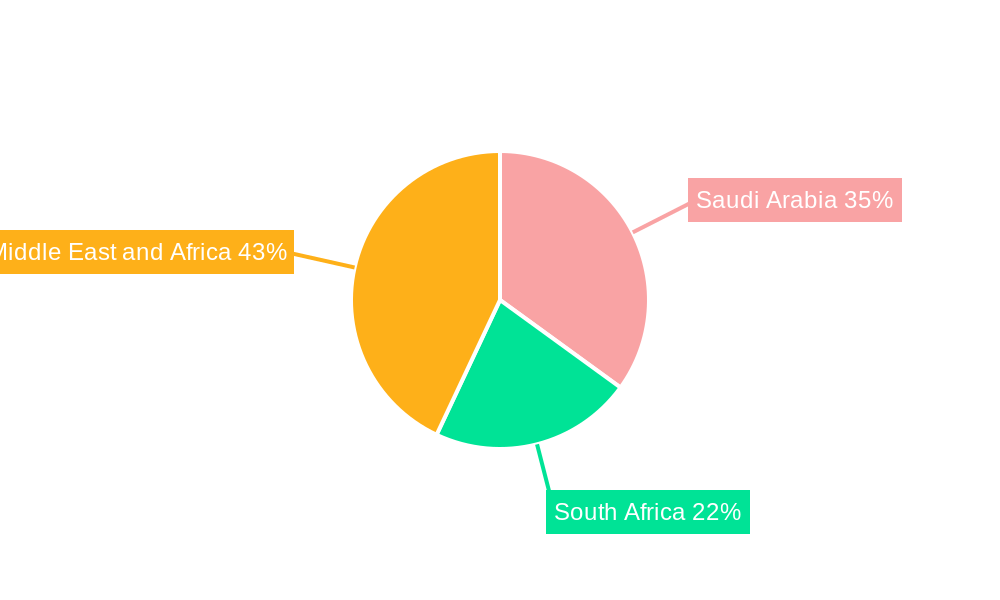
MEA Waterborne Adhesives Industry Regional Market Share
Geographic Coverage of MEA Waterborne Adhesives Industry
MEA Waterborne Adhesives Industry REPORT HIGHLIGHTS
| Aspects | Details |
|---|---|
| Study Period | 2020-2034 |
| Base Year | 2025 |
| Estimated Year | 2026 |
| Forecast Period | 2026-2034 |
| Historical Period | 2020-2025 |
| Growth Rate | CAGR of 9.5% from 2020-2034 |
| Segmentation |
|
Table of Contents
- 1. Introduction
- 1.1. Research Scope
- 1.2. Market Segmentation
- 1.3. Research Objective
- 1.4. Definitions and Assumptions
- 2. Executive Summary
- 2.1. Market Snapshot
- 3. Market Dynamics
- 3.1. Market Drivers
- 3.2. Market Restrains
- 3.3. Market Trends
- 3.4. Market Opportunities
- 4. Market Factor Analysis
- 4.1. Porters Five Forces
- 4.1.1. Bargaining Power of Suppliers
- 4.1.2. Bargaining Power of Buyers
- 4.1.3. Threat of New Entrants
- 4.1.4. Threat of Substitutes
- 4.1.5. Competitive Rivalry
- 4.2. PESTEL analysis
- 4.3. BCG Analysis
- 4.3.1. Stars (High Growth, High Market Share)
- 4.3.2. Cash Cows (Low Growth, High Market Share)
- 4.3.3. Question Mark (High Growth, Low Market Share)
- 4.3.4. Dogs (Low Growth, Low Market Share)
- 4.4. Ansoff Matrix Analysis
- 4.5. Supply Chain Analysis
- 4.6. Regulatory Landscape
- 4.7. Current Market Potential and Opportunity Assessment (TAM–SAM–SOM Framework)
- 4.8. PRI Analyst Note
- 4.1. Porters Five Forces
- 5. Market Analysis, Insights and Forecast 2021-2033
- 5.1. Market Analysis, Insights and Forecast - by Resin Type
- 5.1.1. Acrylics
- 5.1.2. Polyvinyl Acetate (PVA) Emulsion
- 5.1.3. Ethylene Vinyl Acetate (EVA) Emulsion
- 5.1.4. Polyuret
- 5.1.5. Other Resin Types
- 5.2. Market Analysis, Insights and Forecast - by End-user Industry
- 5.2.1. Building & Construction
- 5.2.2. Paper, Board, and Packaging
- 5.2.3. Woodworking & Joinery
- 5.2.4. Transportation
- 5.2.5. Healthcare
- 5.2.6. Electrical & Electronics
- 5.2.7. Other End-user Industries
- 5.3. Market Analysis, Insights and Forecast - by Geography
- 5.3.1. Saudi Arabia
- 5.3.2. South Africa
- 5.3.3. Rest of Middle-East and Africa
- 5.4. Market Analysis, Insights and Forecast - by Region
- 5.4.1. Saudi Arabia
- 5.4.2. South Africa
- 5.4.3. Rest of Middle East and Africa
- 5.1. Market Analysis, Insights and Forecast - by Resin Type
- 6. Global MEA Waterborne Adhesives Industry Analysis, Insights and Forecast, 2021-2033
- 6.1. Market Analysis, Insights and Forecast - by Resin Type
- 6.1.1. Acrylics
- 6.1.2. Polyvinyl Acetate (PVA) Emulsion
- 6.1.3. Ethylene Vinyl Acetate (EVA) Emulsion
- 6.1.4. Polyuret
- 6.1.5. Other Resin Types
- 6.2. Market Analysis, Insights and Forecast - by End-user Industry
- 6.2.1. Building & Construction
- 6.2.2. Paper, Board, and Packaging
- 6.2.3. Woodworking & Joinery
- 6.2.4. Transportation
- 6.2.5. Healthcare
- 6.2.6. Electrical & Electronics
- 6.2.7. Other End-user Industries
- 6.3. Market Analysis, Insights and Forecast - by Geography
- 6.3.1. Saudi Arabia
- 6.3.2. South Africa
- 6.3.3. Rest of Middle-East and Africa
- 6.1. Market Analysis, Insights and Forecast - by Resin Type
- 7. Saudi Arabia MEA Waterborne Adhesives Industry Analysis, Insights and Forecast, 2020-2032
- 7.1. Market Analysis, Insights and Forecast - by Resin Type
- 7.1.1. Acrylics
- 7.1.2. Polyvinyl Acetate (PVA) Emulsion
- 7.1.3. Ethylene Vinyl Acetate (EVA) Emulsion
- 7.1.4. Polyuret
- 7.1.5. Other Resin Types
- 7.2. Market Analysis, Insights and Forecast - by End-user Industry
- 7.2.1. Building & Construction
- 7.2.2. Paper, Board, and Packaging
- 7.2.3. Woodworking & Joinery
- 7.2.4. Transportation
- 7.2.5. Healthcare
- 7.2.6. Electrical & Electronics
- 7.2.7. Other End-user Industries
- 7.3. Market Analysis, Insights and Forecast - by Geography
- 7.3.1. Saudi Arabia
- 7.3.2. South Africa
- 7.3.3. Rest of Middle-East and Africa
- 7.1. Market Analysis, Insights and Forecast - by Resin Type
- 8. South Africa MEA Waterborne Adhesives Industry Analysis, Insights and Forecast, 2020-2032
- 8.1. Market Analysis, Insights and Forecast - by Resin Type
- 8.1.1. Acrylics
- 8.1.2. Polyvinyl Acetate (PVA) Emulsion
- 8.1.3. Ethylene Vinyl Acetate (EVA) Emulsion
- 8.1.4. Polyuret
- 8.1.5. Other Resin Types
- 8.2. Market Analysis, Insights and Forecast - by End-user Industry
- 8.2.1. Building & Construction
- 8.2.2. Paper, Board, and Packaging
- 8.2.3. Woodworking & Joinery
- 8.2.4. Transportation
- 8.2.5. Healthcare
- 8.2.6. Electrical & Electronics
- 8.2.7. Other End-user Industries
- 8.3. Market Analysis, Insights and Forecast - by Geography
- 8.3.1. Saudi Arabia
- 8.3.2. South Africa
- 8.3.3. Rest of Middle-East and Africa
- 8.1. Market Analysis, Insights and Forecast - by Resin Type
- 9. Rest of Middle East and Africa MEA Waterborne Adhesives Industry Analysis, Insights and Forecast, 2020-2032
- 9.1. Market Analysis, Insights and Forecast - by Resin Type
- 9.1.1. Acrylics
- 9.1.2. Polyvinyl Acetate (PVA) Emulsion
- 9.1.3. Ethylene Vinyl Acetate (EVA) Emulsion
- 9.1.4. Polyuret
- 9.1.5. Other Resin Types
- 9.2. Market Analysis, Insights and Forecast - by End-user Industry
- 9.2.1. Building & Construction
- 9.2.2. Paper, Board, and Packaging
- 9.2.3. Woodworking & Joinery
- 9.2.4. Transportation
- 9.2.5. Healthcare
- 9.2.6. Electrical & Electronics
- 9.2.7. Other End-user Industries
- 9.3. Market Analysis, Insights and Forecast - by Geography
- 9.3.1. Saudi Arabia
- 9.3.2. South Africa
- 9.3.3. Rest of Middle-East and Africa
- 9.1. Market Analysis, Insights and Forecast - by Resin Type
- 10. Competitive Analysis
- 10.1. Company Profiles
- 10.1.1 Henkel AG & Co KGaA
- 10.1.1.1. Company Overview
- 10.1.1.2. Products
- 10.1.1.3. Company Financials
- 10.1.1.4. SWOT Analysis
- 10.1.2 3M
- 10.1.2.1. Company Overview
- 10.1.2.2. Products
- 10.1.2.3. Company Financials
- 10.1.2.4. SWOT Analysis
- 10.1.3 Ashland
- 10.1.3.1. Company Overview
- 10.1.3.2. Products
- 10.1.3.3. Company Financials
- 10.1.3.4. SWOT Analysis
- 10.1.4 Arkema Group
- 10.1.4.1. Company Overview
- 10.1.4.2. Products
- 10.1.4.3. Company Financials
- 10.1.4.4. SWOT Analysis
- 10.1.5 Dow
- 10.1.5.1. Company Overview
- 10.1.5.2. Products
- 10.1.5.3. Company Financials
- 10.1.5.4. SWOT Analysis
- 10.1.6 Avery Dennison Corporation
- 10.1.6.1. Company Overview
- 10.1.6.2. Products
- 10.1.6.3. Company Financials
- 10.1.6.4. SWOT Analysis
- 10.1.7 Sika AG
- 10.1.7.1. Company Overview
- 10.1.7.2. Products
- 10.1.7.3. Company Financials
- 10.1.7.4. SWOT Analysis
- 10.1.8 Wacker Chemie AG*List Not Exhaustive
- 10.1.8.1. Company Overview
- 10.1.8.2. Products
- 10.1.8.3. Company Financials
- 10.1.8.4. SWOT Analysis
- 10.1.1 Henkel AG & Co KGaA
- 10.2. Market Entropy
- 10.2.1 Company's Key Areas Served
- 10.2.2 Recent Developments
- 10.3. Company Market Share Analysis 2025
- 10.3.1 Top 5 Companies Market Share Analysis
- 10.3.2 Top 3 Companies Market Share Analysis
- 10.4. List of Potential Customers
- 11. Research Methodology
List of Figures
- Figure 1: Global MEA Waterborne Adhesives Industry Revenue Breakdown (billion, %) by Region 2025 & 2033
- Figure 2: Saudi Arabia MEA Waterborne Adhesives Industry Revenue (billion), by Resin Type 2025 & 2033
- Figure 3: Saudi Arabia MEA Waterborne Adhesives Industry Revenue Share (%), by Resin Type 2025 & 2033
- Figure 4: Saudi Arabia MEA Waterborne Adhesives Industry Revenue (billion), by End-user Industry 2025 & 2033
- Figure 5: Saudi Arabia MEA Waterborne Adhesives Industry Revenue Share (%), by End-user Industry 2025 & 2033
- Figure 6: Saudi Arabia MEA Waterborne Adhesives Industry Revenue (billion), by Geography 2025 & 2033
- Figure 7: Saudi Arabia MEA Waterborne Adhesives Industry Revenue Share (%), by Geography 2025 & 2033
- Figure 8: Saudi Arabia MEA Waterborne Adhesives Industry Revenue (billion), by Country 2025 & 2033
- Figure 9: Saudi Arabia MEA Waterborne Adhesives Industry Revenue Share (%), by Country 2025 & 2033
- Figure 10: South Africa MEA Waterborne Adhesives Industry Revenue (billion), by Resin Type 2025 & 2033
- Figure 11: South Africa MEA Waterborne Adhesives Industry Revenue Share (%), by Resin Type 2025 & 2033
- Figure 12: South Africa MEA Waterborne Adhesives Industry Revenue (billion), by End-user Industry 2025 & 2033
- Figure 13: South Africa MEA Waterborne Adhesives Industry Revenue Share (%), by End-user Industry 2025 & 2033
- Figure 14: South Africa MEA Waterborne Adhesives Industry Revenue (billion), by Geography 2025 & 2033
- Figure 15: South Africa MEA Waterborne Adhesives Industry Revenue Share (%), by Geography 2025 & 2033
- Figure 16: South Africa MEA Waterborne Adhesives Industry Revenue (billion), by Country 2025 & 2033
- Figure 17: South Africa MEA Waterborne Adhesives Industry Revenue Share (%), by Country 2025 & 2033
- Figure 18: Rest of Middle East and Africa MEA Waterborne Adhesives Industry Revenue (billion), by Resin Type 2025 & 2033
- Figure 19: Rest of Middle East and Africa MEA Waterborne Adhesives Industry Revenue Share (%), by Resin Type 2025 & 2033
- Figure 20: Rest of Middle East and Africa MEA Waterborne Adhesives Industry Revenue (billion), by End-user Industry 2025 & 2033
- Figure 21: Rest of Middle East and Africa MEA Waterborne Adhesives Industry Revenue Share (%), by End-user Industry 2025 & 2033
- Figure 22: Rest of Middle East and Africa MEA Waterborne Adhesives Industry Revenue (billion), by Geography 2025 & 2033
- Figure 23: Rest of Middle East and Africa MEA Waterborne Adhesives Industry Revenue Share (%), by Geography 2025 & 2033
- Figure 24: Rest of Middle East and Africa MEA Waterborne Adhesives Industry Revenue (billion), by Country 2025 & 2033
- Figure 25: Rest of Middle East and Africa MEA Waterborne Adhesives Industry Revenue Share (%), by Country 2025 & 2033
List of Tables
- Table 1: Global MEA Waterborne Adhesives Industry Revenue billion Forecast, by Resin Type 2020 & 2033
- Table 2: Global MEA Waterborne Adhesives Industry Revenue billion Forecast, by End-user Industry 2020 & 2033
- Table 3: Global MEA Waterborne Adhesives Industry Revenue billion Forecast, by Geography 2020 & 2033
- Table 4: Global MEA Waterborne Adhesives Industry Revenue billion Forecast, by Region 2020 & 2033
- Table 5: Global MEA Waterborne Adhesives Industry Revenue billion Forecast, by Resin Type 2020 & 2033
- Table 6: Global MEA Waterborne Adhesives Industry Revenue billion Forecast, by End-user Industry 2020 & 2033
- Table 7: Global MEA Waterborne Adhesives Industry Revenue billion Forecast, by Geography 2020 & 2033
- Table 8: Global MEA Waterborne Adhesives Industry Revenue billion Forecast, by Country 2020 & 2033
- Table 9: Global MEA Waterborne Adhesives Industry Revenue billion Forecast, by Resin Type 2020 & 2033
- Table 10: Global MEA Waterborne Adhesives Industry Revenue billion Forecast, by End-user Industry 2020 & 2033
- Table 11: Global MEA Waterborne Adhesives Industry Revenue billion Forecast, by Geography 2020 & 2033
- Table 12: Global MEA Waterborne Adhesives Industry Revenue billion Forecast, by Country 2020 & 2033
- Table 13: Global MEA Waterborne Adhesives Industry Revenue billion Forecast, by Resin Type 2020 & 2033
- Table 14: Global MEA Waterborne Adhesives Industry Revenue billion Forecast, by End-user Industry 2020 & 2033
- Table 15: Global MEA Waterborne Adhesives Industry Revenue billion Forecast, by Geography 2020 & 2033
- Table 16: Global MEA Waterborne Adhesives Industry Revenue billion Forecast, by Country 2020 & 2033
Frequently Asked Questions
1. What is the projected Compound Annual Growth Rate (CAGR) of the MEA Waterborne Adhesives Industry?
The projected CAGR is approximately 9.5%.
2. Which companies are prominent players in the MEA Waterborne Adhesives Industry?
Key companies in the market include Henkel AG & Co KGaA, 3M, Ashland, Arkema Group, Dow, Avery Dennison Corporation, Sika AG, Wacker Chemie AG*List Not Exhaustive.
3. What are the main segments of the MEA Waterborne Adhesives Industry?
The market segments include Resin Type, End-user Industry, Geography.
4. Can you provide details about the market size?
The market size is estimated to be USD 38.63 billion as of 2022.
5. What are some drivers contributing to market growth?
; Availability of Raw Materials and Low Production Cost; Increasing Demand from Construction Industry.
6. What are the notable trends driving market growth?
Building & Construction to Dominate the Market.
7. Are there any restraints impacting market growth?
; Limited Usage in High End Applications; Other Restraints.
8. Can you provide examples of recent developments in the market?
N/A
9. What pricing options are available for accessing the report?
Pricing options include single-user, multi-user, and enterprise licenses priced at USD 4750, USD 5250, and USD 8750 respectively.
10. Is the market size provided in terms of value or volume?
The market size is provided in terms of value, measured in billion.
11. Are there any specific market keywords associated with the report?
Yes, the market keyword associated with the report is "MEA Waterborne Adhesives Industry," which aids in identifying and referencing the specific market segment covered.
12. How do I determine which pricing option suits my needs best?
The pricing options vary based on user requirements and access needs. Individual users may opt for single-user licenses, while businesses requiring broader access may choose multi-user or enterprise licenses for cost-effective access to the report.
13. Are there any additional resources or data provided in the MEA Waterborne Adhesives Industry report?
While the report offers comprehensive insights, it's advisable to review the specific contents or supplementary materials provided to ascertain if additional resources or data are available.
14. How can I stay updated on further developments or reports in the MEA Waterborne Adhesives Industry?
To stay informed about further developments, trends, and reports in the MEA Waterborne Adhesives Industry, consider subscribing to industry newsletters, following relevant companies and organizations, or regularly checking reputable industry news sources and publications.
Methodology
Step 1 - Identification of Relevant Samples Size from Population Database


Step 2 - Approaches for Defining Global Market Size (Value, Volume* & Price*)

Note*: In applicable scenarios
Step 3 - Data Sources
Primary Research
- Web Analytics
- Survey Reports
- Research Institute
- Latest Research Reports
- Opinion Leaders
Secondary Research
- Annual Reports
- White Paper
- Latest Press Release
- Industry Association
- Paid Database
- Investor Presentations

Step 4 - Data Triangulation
Involves using different sources of information in order to increase the validity of a study
These sources are likely to be stakeholders in a program - participants, other researchers, program staff, other community members, and so on.
Then we put all data in single framework & apply various statistical tools to find out the dynamic on the market.
During the analysis stage, feedback from the stakeholder groups would be compared to determine areas of agreement as well as areas of divergence