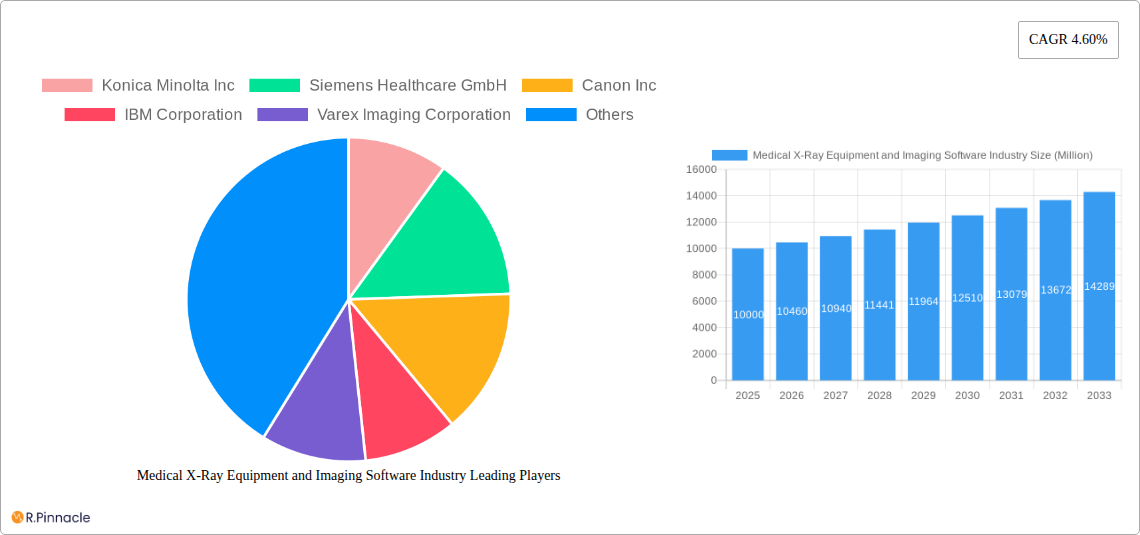
Key Insights
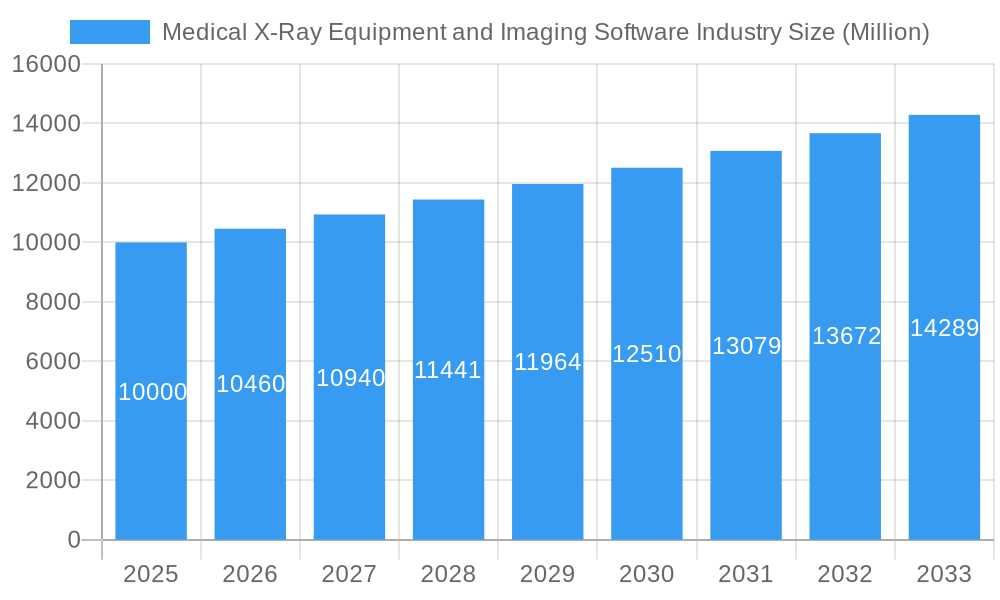
The global medical X-ray equipment and imaging software market is experiencing robust growth, projected to expand at a compound annual growth rate (CAGR) of 4.60% from 2025 to 2033. This expansion is fueled by several key factors. Technological advancements, such as the development of more sophisticated and precise 3D imaging systems and AI-powered diagnostic tools, are significantly enhancing the accuracy and efficiency of medical diagnosis. The rising prevalence of chronic diseases, an aging global population requiring increased healthcare services, and the increasing adoption of minimally invasive procedures are all contributing to heightened demand. Furthermore, government initiatives aimed at improving healthcare infrastructure and increasing access to advanced medical technologies in developing economies are stimulating market growth. The market is segmented by type (equipment vs. software, 2D vs. 3D), technology (radiography/mammography, computed tomography, fluoroscopy/angiography), and end-user (hospitals, diagnostic centers, research centers). The competitive landscape is characterized by a mix of established multinational corporations and specialized smaller players. While the North American market currently holds a significant share, substantial growth opportunities are emerging in the Asia-Pacific region, driven by rising healthcare expenditure and infrastructure development in countries like China and India.
Medical X-Ray Equipment and Imaging Software Industry Market Size (In Billion)
However, several factors could restrain market growth. The high cost of advanced X-ray equipment and software, coupled with the need for specialized training and maintenance, poses a challenge for smaller healthcare facilities in both developed and developing nations. Stringent regulatory requirements for medical device approval and a potential shortage of qualified radiologists and technicians could also impede market expansion. Nevertheless, the long-term outlook for the medical X-ray equipment and imaging software market remains positive, driven by continuous technological innovation, improving healthcare access, and the increasing focus on early and accurate diagnosis of diseases. The market is expected to witness further consolidation, with mergers and acquisitions playing a significant role in shaping the competitive landscape. The integration of artificial intelligence and machine learning in image analysis is anticipated to further accelerate market expansion in the coming years.
Medical X-Ray Equipment and Imaging Software Industry Company Market Share
Medical X-Ray Equipment and Imaging Software Industry Market Report: 2019-2033
This comprehensive report provides an in-depth analysis of the Medical X-Ray Equipment and Imaging Software industry, offering valuable insights for industry professionals, investors, and stakeholders. The report covers the period 2019-2033, with a focus on the forecast period 2025-2033 and a base year of 2025. The market is segmented by type (Equipment, Software), dimensionality (2-Dimensional, 3-Dimensional), technology (Radiography/Mammography, Computed Tomography, Fluoroscopy/Angiography), and end-user (Hospitals, Diagnostic Centers, Research Centers). Key players analyzed include Konica Minolta Inc, Siemens Healthcare GmbH, Canon Inc, IBM Corporation, Varex Imaging Corporation, Hitachi Ltd, Shimadzu Corporation, Hologic Inc, Koninklijke Philips NV, GE Healthcare Inc, Carestream Health Inc, and Fujifilm Holdings Corporation. The report projects a market size of xx Million by 2033, exhibiting a CAGR of xx% during the forecast period.
Medical X-Ray Equipment and Imaging Software Industry Market Structure & Innovation Trends
The Medical X-Ray Equipment and Imaging Software market is characterized by a moderately concentrated structure, with a few major players holding significant market share. Konica Minolta, Siemens Healthcare, and GE Healthcare are among the leading companies, collectively accounting for an estimated xx% of the global market in 2024. Market concentration is influenced by factors such as substantial R&D investments, stringent regulatory approvals, and economies of scale in manufacturing and distribution. Innovation is driven by the constant need for improved image quality, faster processing speeds, reduced radiation exposure, and the integration of AI and machine learning for enhanced diagnostic capabilities. Regulatory frameworks, particularly those related to safety and efficacy, play a crucial role in shaping market dynamics. Product substitutes, such as ultrasound and MRI, exert competitive pressure, while the market also sees ongoing mergers and acquisitions (M&A) activities. In the historical period (2019-2024), M&A deal values totaled approximately xx Million, reflecting industry consolidation and expansion strategies. End-user demographics, particularly the aging global population and rising prevalence of chronic diseases, are key growth drivers.
- Market Share (2024): Top 3 players – xx%; Others – xx%
- M&A Deal Value (2019-2024): xx Million
- Key Innovation Drivers: AI integration, improved image quality, reduced radiation dose.
Medical X-Ray Equipment and Imaging Software Industry Market Dynamics & Trends
The Medical X-Ray Equipment and Imaging Software market is experiencing robust growth, fueled by several key factors. The increasing prevalence of chronic diseases globally, coupled with an aging population, is significantly driving demand for advanced diagnostic imaging solutions. Technological advancements, such as the development of 3D imaging technologies and AI-powered diagnostic tools, are revolutionizing the industry, offering higher image quality, faster processing, and improved accuracy. Furthermore, the rising adoption of minimally invasive procedures and the expanding healthcare infrastructure in emerging economies are contributing to market expansion. However, the market is also influenced by factors such as the high cost of equipment and software, stringent regulatory requirements, and competition from alternative imaging modalities. Consumer preferences are shifting towards portable and mobile X-ray systems, driven by the need for increased accessibility and efficiency. Competitive dynamics are intense, with leading players constantly striving to improve their product offerings, expand their market reach, and develop strategic partnerships. The market is projected to grow at a CAGR of xx% from 2025 to 2033, reaching an estimated xx Million by 2033. Market penetration for advanced imaging technologies, such as 3D and AI-powered systems, is increasing steadily, further contributing to market expansion.
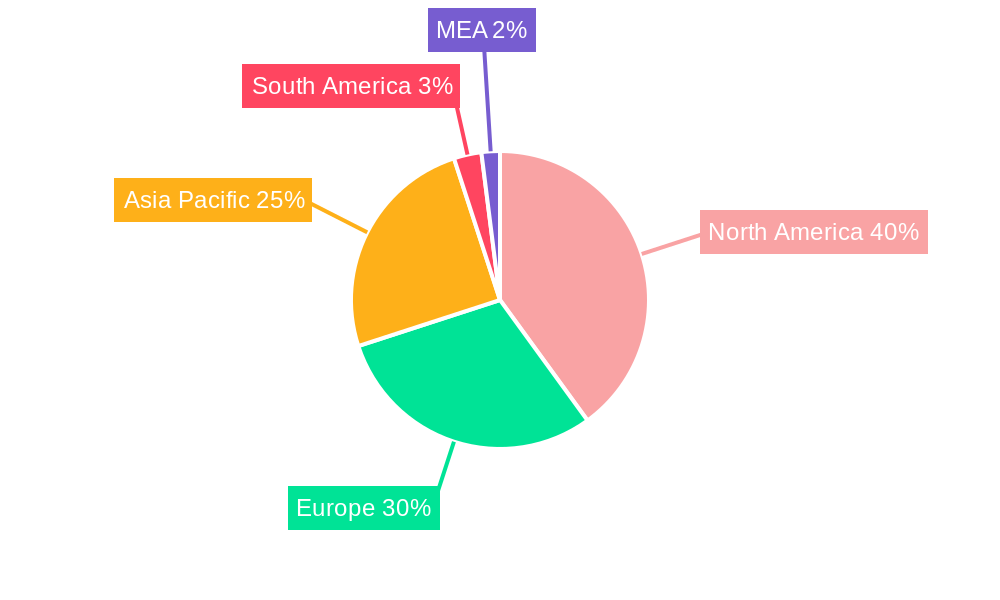
Dominant Regions & Segments in Medical X-Ray Equipment and Imaging Software Industry
North America currently holds the largest market share in the Medical X-Ray Equipment and Imaging Software industry, driven by factors such as advanced healthcare infrastructure, high adoption rates of advanced imaging technologies, and robust R&D activities. Europe follows as a significant market, with strong growth prospects in emerging economies within the region. Asia-Pacific is also experiencing rapid expansion, fueled by increasing healthcare spending and a growing population.
Key Drivers:
- North America: Strong healthcare infrastructure, high adoption of advanced technologies.
- Europe: Growing healthcare spending, technological advancements.
- Asia-Pacific: Rising population, increasing healthcare expenditure.
Segment Dominance:
- By Type: The Equipment segment dominates the market, accounting for a larger share compared to the Software segment. This is due to the significant investment required for purchasing advanced X-ray equipment.
- By Dimensionality: 2-Dimensional systems currently hold a larger market share due to their established presence and cost-effectiveness, although 3-Dimensional systems are exhibiting faster growth due to technological advancements and improvements in image quality.
- By Technology: Computed Tomography (CT) holds a significant share due to its diagnostic capabilities, but Radiography/Mammography remains dominant in terms of overall volume. Fluoroscopy/Angiography represents a smaller but growing segment.
- By End-user: Hospitals constitute the largest end-user segment, driven by their extensive diagnostic needs and large patient volumes. Diagnostic Centers and Research Centers also represent significant market segments.
Medical X-Ray Equipment and Imaging Software Industry Product Innovations
Recent innovations in the Medical X-Ray Equipment and Imaging Software industry focus on enhancing image quality, reducing radiation exposure, improving workflow efficiency, and integrating advanced analytical capabilities. Technological trends include the integration of artificial intelligence (AI) and machine learning (ML) for automated image analysis, advanced 3D imaging techniques for improved diagnostic accuracy, and the development of portable and mobile X-ray systems for enhanced accessibility. These innovations are designed to improve patient care, reduce costs, and increase efficiency in healthcare settings, creating a strong market fit for these advanced technologies.
Report Scope & Segmentation Analysis
This report comprehensively analyzes the Medical X-Ray Equipment and Imaging Software market across various segments. The market is segmented by:
- By Type: Equipment and Software, with growth projections and competitive dynamics for each.
- By Dimensionality: 2-Dimensional and 3-Dimensional, assessing market sizes and future growth potential.
- By Technology: Radiography/Mammography, Computed Tomography (CT), and Fluoroscopy/Angiography, examining individual technology market shares.
- By End-user: Hospitals, Diagnostic Centers, and Research Centers, exploring market size and growth forecasts for each sector.
Key Drivers of Medical X-Ray Equipment and Imaging Software Industry Growth
Several factors contribute to the growth of the Medical X-Ray Equipment and Imaging Software market. Technological advancements, such as AI-powered image analysis and 3D imaging, are improving diagnostic accuracy and efficiency. The aging global population and rising prevalence of chronic diseases are increasing the demand for diagnostic imaging services. Government initiatives to improve healthcare infrastructure and expand access to quality healthcare also stimulate market growth. Furthermore, the increasing adoption of minimally invasive procedures necessitates advanced imaging capabilities.
Challenges in the Medical X-Ray Equipment and Imaging Software Industry Sector
The Medical X-Ray Equipment and Imaging Software industry faces several challenges. Stringent regulatory requirements for medical devices increase development costs and time to market. High equipment costs and ongoing maintenance expenses can limit adoption, particularly in resource-constrained settings. The supply chain disruptions experienced in recent years have affected the availability of critical components. Competition from alternative imaging modalities, such as ultrasound and MRI, further presents a challenge. These challenges impact market growth and profitability.
Emerging Opportunities in Medical X-Ray Equipment and Imaging Software Industry
Several opportunities exist for growth in the Medical X-Ray Equipment and Imaging Software market. The increasing demand for AI-powered diagnostic tools creates opportunities for developing innovative solutions for image analysis and disease detection. Expansion into emerging markets with growing healthcare infrastructure presents significant potential. The development of portable and mobile X-ray systems caters to the increasing need for improved accessibility and efficiency in healthcare delivery. Furthermore, the development of advanced imaging techniques focusing on reduced radiation exposure and improved image quality is likely to drive market growth.
Leading Players in the Medical X-Ray Equipment and Imaging Software Industry Market
- Konica Minolta Inc
- Siemens Healthcare GmbH
- Canon Inc
- IBM Corporation
- Varex Imaging Corporation
- Hitachi Ltd
- Shimazdu Corporation
- Hologic Inc
- Koninklijke Philips NV
- GE Healthcare Inc
- Carestream Health Inc
- Fujifilm Holdings Corporation
Key Developments in Medical X-Ray Equipment and Imaging Software Industry Industry
- July 2023: Shimadzu Corporation launched the MobileDaRt Evolution MX8 version k type mobile X-ray system with Dynamic Digital Radiography (DDR).
- May 2023: Carestream Health introduced the DRX-Rise Mobile X-ray System, expanding its mobile X-ray portfolio.
Future Outlook for Medical X-Ray Equipment and Imaging Software Industry Market
The future of the Medical X-Ray Equipment and Imaging Software market is promising. Continued technological advancements, particularly in AI and 3D imaging, will drive improvements in diagnostic accuracy and efficiency. The growing demand for advanced imaging solutions in emerging markets presents significant growth potential. Strategic partnerships and collaborations between manufacturers and healthcare providers will play a crucial role in market expansion. Focus on developing cost-effective and portable systems will enhance market accessibility. The overall market outlook is positive, with substantial growth expected in the coming years.
Medical X-Ray Equipment and Imaging Software Industry Segmentation
-
1. Type
- 1.1. Equipment
- 1.2. Software
-
2. Technology
- 2.1. Radiography/Mammography
- 2.2. Computed Tomography
- 2.3. Fluoroscopy/Angiography
-
3. Image Type
- 3.1. 2-Dimensional
- 3.2. 3-Dimensional
-
4. End-user
- 4.1. Hospitals
- 4.2. Diagnostic Centers
- 4.3. Research Centers
Medical X-Ray Equipment and Imaging Software Industry Segmentation By Geography
- 1. North America
- 2. Europe
- 3. Asia
- 4. Australia and New Zealand
- 5. Middle East and Africa
- 6. Latin America
Medical X-Ray Equipment and Imaging Software Industry Regional Market Share
Geographic Coverage of Medical X-Ray Equipment and Imaging Software Industry
Medical X-Ray Equipment and Imaging Software Industry REPORT HIGHLIGHTS
| Aspects | Details |
|---|---|
| Study Period | 2020-2034 |
| Base Year | 2025 |
| Estimated Year | 2026 |
| Forecast Period | 2026-2034 |
| Historical Period | 2020-2025 |
| Growth Rate | CAGR of 4.60% from 2020-2034 |
| Segmentation |
|
Table of Contents
- 1. Introduction
- 1.1. Research Scope
- 1.2. Market Segmentation
- 1.3. Research Objective
- 1.4. Definitions and Assumptions
- 2. Executive Summary
- 2.1. Market Snapshot
- 3. Market Dynamics
- 3.1. Market Drivers
- 3.2. Market Restrains
- 3.3. Market Trends
- 3.4. Market Opportunities
- 4. Market Factor Analysis
- 4.1. Porters Five Forces
- 4.1.1. Bargaining Power of Suppliers
- 4.1.2. Bargaining Power of Buyers
- 4.1.3. Threat of New Entrants
- 4.1.4. Threat of Substitutes
- 4.1.5. Competitive Rivalry
- 4.2. PESTEL analysis
- 4.3. BCG Analysis
- 4.3.1. Stars (High Growth, High Market Share)
- 4.3.2. Cash Cows (Low Growth, High Market Share)
- 4.3.3. Question Mark (High Growth, Low Market Share)
- 4.3.4. Dogs (Low Growth, Low Market Share)
- 4.4. Ansoff Matrix Analysis
- 4.5. Supply Chain Analysis
- 4.6. Regulatory Landscape
- 4.7. Current Market Potential and Opportunity Assessment (TAM–SAM–SOM Framework)
- 4.8. PRI Analyst Note
- 4.1. Porters Five Forces
- 5. Market Analysis, Insights and Forecast 2021-2033
- 5.1. Market Analysis, Insights and Forecast - by Type
- 5.1.1. Equipment
- 5.1.2. Software
- 5.2. Market Analysis, Insights and Forecast - by Technology
- 5.2.1. Radiography/Mammography
- 5.2.2. Computed Tomography
- 5.2.3. Fluoroscopy/Angiography
- 5.3. Market Analysis, Insights and Forecast - by Image Type
- 5.3.1. 2-Dimensional
- 5.3.2. 3-Dimensional
- 5.4. Market Analysis, Insights and Forecast - by End-user
- 5.4.1. Hospitals
- 5.4.2. Diagnostic Centers
- 5.4.3. Research Centers
- 5.5. Market Analysis, Insights and Forecast - by Region
- 5.5.1. North America
- 5.5.2. Europe
- 5.5.3. Asia
- 5.5.4. Australia and New Zealand
- 5.5.5. Middle East and Africa
- 5.5.6. Latin America
- 5.1. Market Analysis, Insights and Forecast - by Type
- 6. Global Medical X-Ray Equipment and Imaging Software Industry Analysis, Insights and Forecast, 2021-2033
- 6.1. Market Analysis, Insights and Forecast - by Type
- 6.1.1. Equipment
- 6.1.2. Software
- 6.2. Market Analysis, Insights and Forecast - by Technology
- 6.2.1. Radiography/Mammography
- 6.2.2. Computed Tomography
- 6.2.3. Fluoroscopy/Angiography
- 6.3. Market Analysis, Insights and Forecast - by Image Type
- 6.3.1. 2-Dimensional
- 6.3.2. 3-Dimensional
- 6.4. Market Analysis, Insights and Forecast - by End-user
- 6.4.1. Hospitals
- 6.4.2. Diagnostic Centers
- 6.4.3. Research Centers
- 6.1. Market Analysis, Insights and Forecast - by Type
- 7. North America Medical X-Ray Equipment and Imaging Software Industry Analysis, Insights and Forecast, 2020-2032
- 7.1. Market Analysis, Insights and Forecast - by Type
- 7.1.1. Equipment
- 7.1.2. Software
- 7.2. Market Analysis, Insights and Forecast - by Technology
- 7.2.1. Radiography/Mammography
- 7.2.2. Computed Tomography
- 7.2.3. Fluoroscopy/Angiography
- 7.3. Market Analysis, Insights and Forecast - by Image Type
- 7.3.1. 2-Dimensional
- 7.3.2. 3-Dimensional
- 7.4. Market Analysis, Insights and Forecast - by End-user
- 7.4.1. Hospitals
- 7.4.2. Diagnostic Centers
- 7.4.3. Research Centers
- 7.1. Market Analysis, Insights and Forecast - by Type
- 8. Europe Medical X-Ray Equipment and Imaging Software Industry Analysis, Insights and Forecast, 2020-2032
- 8.1. Market Analysis, Insights and Forecast - by Type
- 8.1.1. Equipment
- 8.1.2. Software
- 8.2. Market Analysis, Insights and Forecast - by Technology
- 8.2.1. Radiography/Mammography
- 8.2.2. Computed Tomography
- 8.2.3. Fluoroscopy/Angiography
- 8.3. Market Analysis, Insights and Forecast - by Image Type
- 8.3.1. 2-Dimensional
- 8.3.2. 3-Dimensional
- 8.4. Market Analysis, Insights and Forecast - by End-user
- 8.4.1. Hospitals
- 8.4.2. Diagnostic Centers
- 8.4.3. Research Centers
- 8.1. Market Analysis, Insights and Forecast - by Type
- 9. Asia Medical X-Ray Equipment and Imaging Software Industry Analysis, Insights and Forecast, 2020-2032
- 9.1. Market Analysis, Insights and Forecast - by Type
- 9.1.1. Equipment
- 9.1.2. Software
- 9.2. Market Analysis, Insights and Forecast - by Technology
- 9.2.1. Radiography/Mammography
- 9.2.2. Computed Tomography
- 9.2.3. Fluoroscopy/Angiography
- 9.3. Market Analysis, Insights and Forecast - by Image Type
- 9.3.1. 2-Dimensional
- 9.3.2. 3-Dimensional
- 9.4. Market Analysis, Insights and Forecast - by End-user
- 9.4.1. Hospitals
- 9.4.2. Diagnostic Centers
- 9.4.3. Research Centers
- 9.1. Market Analysis, Insights and Forecast - by Type
- 10. Australia and New Zealand Medical X-Ray Equipment and Imaging Software Industry Analysis, Insights and Forecast, 2020-2032
- 10.1. Market Analysis, Insights and Forecast - by Type
- 10.1.1. Equipment
- 10.1.2. Software
- 10.2. Market Analysis, Insights and Forecast - by Technology
- 10.2.1. Radiography/Mammography
- 10.2.2. Computed Tomography
- 10.2.3. Fluoroscopy/Angiography
- 10.3. Market Analysis, Insights and Forecast - by Image Type
- 10.3.1. 2-Dimensional
- 10.3.2. 3-Dimensional
- 10.4. Market Analysis, Insights and Forecast - by End-user
- 10.4.1. Hospitals
- 10.4.2. Diagnostic Centers
- 10.4.3. Research Centers
- 10.1. Market Analysis, Insights and Forecast - by Type
- 11. Middle East and Africa Medical X-Ray Equipment and Imaging Software Industry Analysis, Insights and Forecast, 2020-2032
- 11.1. Market Analysis, Insights and Forecast - by Type
- 11.1.1. Equipment
- 11.1.2. Software
- 11.2. Market Analysis, Insights and Forecast - by Technology
- 11.2.1. Radiography/Mammography
- 11.2.2. Computed Tomography
- 11.2.3. Fluoroscopy/Angiography
- 11.3. Market Analysis, Insights and Forecast - by Image Type
- 11.3.1. 2-Dimensional
- 11.3.2. 3-Dimensional
- 11.4. Market Analysis, Insights and Forecast - by End-user
- 11.4.1. Hospitals
- 11.4.2. Diagnostic Centers
- 11.4.3. Research Centers
- 11.1. Market Analysis, Insights and Forecast - by Type
- 12. Latin America Medical X-Ray Equipment and Imaging Software Industry Analysis, Insights and Forecast, 2020-2032
- 12.1. Market Analysis, Insights and Forecast - by Type
- 12.1.1. Equipment
- 12.1.2. Software
- 12.2. Market Analysis, Insights and Forecast - by Technology
- 12.2.1. Radiography/Mammography
- 12.2.2. Computed Tomography
- 12.2.3. Fluoroscopy/Angiography
- 12.3. Market Analysis, Insights and Forecast - by Image Type
- 12.3.1. 2-Dimensional
- 12.3.2. 3-Dimensional
- 12.4. Market Analysis, Insights and Forecast - by End-user
- 12.4.1. Hospitals
- 12.4.2. Diagnostic Centers
- 12.4.3. Research Centers
- 12.1. Market Analysis, Insights and Forecast - by Type
- 13. Competitive Analysis
- 13.1. Company Profiles
- 13.1.1 Konica Minolta Inc
- 13.1.1.1. Company Overview
- 13.1.1.2. Products
- 13.1.1.3. Company Financials
- 13.1.1.4. SWOT Analysis
- 13.1.2 Siemens Healthcare GmbH
- 13.1.2.1. Company Overview
- 13.1.2.2. Products
- 13.1.2.3. Company Financials
- 13.1.2.4. SWOT Analysis
- 13.1.3 Canon Inc
- 13.1.3.1. Company Overview
- 13.1.3.2. Products
- 13.1.3.3. Company Financials
- 13.1.3.4. SWOT Analysis
- 13.1.4 IBM Corporation
- 13.1.4.1. Company Overview
- 13.1.4.2. Products
- 13.1.4.3. Company Financials
- 13.1.4.4. SWOT Analysis
- 13.1.5 Varex Imaging Corporation
- 13.1.5.1. Company Overview
- 13.1.5.2. Products
- 13.1.5.3. Company Financials
- 13.1.5.4. SWOT Analysis
- 13.1.6 Hitachi Ltd
- 13.1.6.1. Company Overview
- 13.1.6.2. Products
- 13.1.6.3. Company Financials
- 13.1.6.4. SWOT Analysis
- 13.1.7 Shimazdu Corporation
- 13.1.7.1. Company Overview
- 13.1.7.2. Products
- 13.1.7.3. Company Financials
- 13.1.7.4. SWOT Analysis
- 13.1.8 Hologic Inc
- 13.1.8.1. Company Overview
- 13.1.8.2. Products
- 13.1.8.3. Company Financials
- 13.1.8.4. SWOT Analysis
- 13.1.9 Koninklijke Philips NV
- 13.1.9.1. Company Overview
- 13.1.9.2. Products
- 13.1.9.3. Company Financials
- 13.1.9.4. SWOT Analysis
- 13.1.10 GE Healthcare Inc
- 13.1.10.1. Company Overview
- 13.1.10.2. Products
- 13.1.10.3. Company Financials
- 13.1.10.4. SWOT Analysis
- 13.1.11 Carestream Health Inc
- 13.1.11.1. Company Overview
- 13.1.11.2. Products
- 13.1.11.3. Company Financials
- 13.1.11.4. SWOT Analysis
- 13.1.12 Fujifilm Holdings Corporation
- 13.1.12.1. Company Overview
- 13.1.12.2. Products
- 13.1.12.3. Company Financials
- 13.1.12.4. SWOT Analysis
- 13.1.1 Konica Minolta Inc
- 13.2. Market Entropy
- 13.2.1 Company's Key Areas Served
- 13.2.2 Recent Developments
- 13.3. Company Market Share Analysis 2025
- 13.3.1 Top 5 Companies Market Share Analysis
- 13.3.2 Top 3 Companies Market Share Analysis
- 13.4. List of Potential Customers
- 14. Research Methodology
List of Figures
- Figure 1: Global Medical X-Ray Equipment and Imaging Software Industry Revenue Breakdown (Million, %) by Region 2025 & 2033
- Figure 2: Global Medical X-Ray Equipment and Imaging Software Industry Volume Breakdown (K Unit, %) by Region 2025 & 2033
- Figure 3: North America Medical X-Ray Equipment and Imaging Software Industry Revenue (Million), by Type 2025 & 2033
- Figure 4: North America Medical X-Ray Equipment and Imaging Software Industry Volume (K Unit), by Type 2025 & 2033
- Figure 5: North America Medical X-Ray Equipment and Imaging Software Industry Revenue Share (%), by Type 2025 & 2033
- Figure 6: North America Medical X-Ray Equipment and Imaging Software Industry Volume Share (%), by Type 2025 & 2033
- Figure 7: North America Medical X-Ray Equipment and Imaging Software Industry Revenue (Million), by Technology 2025 & 2033
- Figure 8: North America Medical X-Ray Equipment and Imaging Software Industry Volume (K Unit), by Technology 2025 & 2033
- Figure 9: North America Medical X-Ray Equipment and Imaging Software Industry Revenue Share (%), by Technology 2025 & 2033
- Figure 10: North America Medical X-Ray Equipment and Imaging Software Industry Volume Share (%), by Technology 2025 & 2033
- Figure 11: North America Medical X-Ray Equipment and Imaging Software Industry Revenue (Million), by Image Type 2025 & 2033
- Figure 12: North America Medical X-Ray Equipment and Imaging Software Industry Volume (K Unit), by Image Type 2025 & 2033
- Figure 13: North America Medical X-Ray Equipment and Imaging Software Industry Revenue Share (%), by Image Type 2025 & 2033
- Figure 14: North America Medical X-Ray Equipment and Imaging Software Industry Volume Share (%), by Image Type 2025 & 2033
- Figure 15: North America Medical X-Ray Equipment and Imaging Software Industry Revenue (Million), by End-user 2025 & 2033
- Figure 16: North America Medical X-Ray Equipment and Imaging Software Industry Volume (K Unit), by End-user 2025 & 2033
- Figure 17: North America Medical X-Ray Equipment and Imaging Software Industry Revenue Share (%), by End-user 2025 & 2033
- Figure 18: North America Medical X-Ray Equipment and Imaging Software Industry Volume Share (%), by End-user 2025 & 2033
- Figure 19: North America Medical X-Ray Equipment and Imaging Software Industry Revenue (Million), by Country 2025 & 2033
- Figure 20: North America Medical X-Ray Equipment and Imaging Software Industry Volume (K Unit), by Country 2025 & 2033
- Figure 21: North America Medical X-Ray Equipment and Imaging Software Industry Revenue Share (%), by Country 2025 & 2033
- Figure 22: North America Medical X-Ray Equipment and Imaging Software Industry Volume Share (%), by Country 2025 & 2033
- Figure 23: Europe Medical X-Ray Equipment and Imaging Software Industry Revenue (Million), by Type 2025 & 2033
- Figure 24: Europe Medical X-Ray Equipment and Imaging Software Industry Volume (K Unit), by Type 2025 & 2033
- Figure 25: Europe Medical X-Ray Equipment and Imaging Software Industry Revenue Share (%), by Type 2025 & 2033
- Figure 26: Europe Medical X-Ray Equipment and Imaging Software Industry Volume Share (%), by Type 2025 & 2033
- Figure 27: Europe Medical X-Ray Equipment and Imaging Software Industry Revenue (Million), by Technology 2025 & 2033
- Figure 28: Europe Medical X-Ray Equipment and Imaging Software Industry Volume (K Unit), by Technology 2025 & 2033
- Figure 29: Europe Medical X-Ray Equipment and Imaging Software Industry Revenue Share (%), by Technology 2025 & 2033
- Figure 30: Europe Medical X-Ray Equipment and Imaging Software Industry Volume Share (%), by Technology 2025 & 2033
- Figure 31: Europe Medical X-Ray Equipment and Imaging Software Industry Revenue (Million), by Image Type 2025 & 2033
- Figure 32: Europe Medical X-Ray Equipment and Imaging Software Industry Volume (K Unit), by Image Type 2025 & 2033
- Figure 33: Europe Medical X-Ray Equipment and Imaging Software Industry Revenue Share (%), by Image Type 2025 & 2033
- Figure 34: Europe Medical X-Ray Equipment and Imaging Software Industry Volume Share (%), by Image Type 2025 & 2033
- Figure 35: Europe Medical X-Ray Equipment and Imaging Software Industry Revenue (Million), by End-user 2025 & 2033
- Figure 36: Europe Medical X-Ray Equipment and Imaging Software Industry Volume (K Unit), by End-user 2025 & 2033
- Figure 37: Europe Medical X-Ray Equipment and Imaging Software Industry Revenue Share (%), by End-user 2025 & 2033
- Figure 38: Europe Medical X-Ray Equipment and Imaging Software Industry Volume Share (%), by End-user 2025 & 2033
- Figure 39: Europe Medical X-Ray Equipment and Imaging Software Industry Revenue (Million), by Country 2025 & 2033
- Figure 40: Europe Medical X-Ray Equipment and Imaging Software Industry Volume (K Unit), by Country 2025 & 2033
- Figure 41: Europe Medical X-Ray Equipment and Imaging Software Industry Revenue Share (%), by Country 2025 & 2033
- Figure 42: Europe Medical X-Ray Equipment and Imaging Software Industry Volume Share (%), by Country 2025 & 2033
- Figure 43: Asia Medical X-Ray Equipment and Imaging Software Industry Revenue (Million), by Type 2025 & 2033
- Figure 44: Asia Medical X-Ray Equipment and Imaging Software Industry Volume (K Unit), by Type 2025 & 2033
- Figure 45: Asia Medical X-Ray Equipment and Imaging Software Industry Revenue Share (%), by Type 2025 & 2033
- Figure 46: Asia Medical X-Ray Equipment and Imaging Software Industry Volume Share (%), by Type 2025 & 2033
- Figure 47: Asia Medical X-Ray Equipment and Imaging Software Industry Revenue (Million), by Technology 2025 & 2033
- Figure 48: Asia Medical X-Ray Equipment and Imaging Software Industry Volume (K Unit), by Technology 2025 & 2033
- Figure 49: Asia Medical X-Ray Equipment and Imaging Software Industry Revenue Share (%), by Technology 2025 & 2033
- Figure 50: Asia Medical X-Ray Equipment and Imaging Software Industry Volume Share (%), by Technology 2025 & 2033
- Figure 51: Asia Medical X-Ray Equipment and Imaging Software Industry Revenue (Million), by Image Type 2025 & 2033
- Figure 52: Asia Medical X-Ray Equipment and Imaging Software Industry Volume (K Unit), by Image Type 2025 & 2033
- Figure 53: Asia Medical X-Ray Equipment and Imaging Software Industry Revenue Share (%), by Image Type 2025 & 2033
- Figure 54: Asia Medical X-Ray Equipment and Imaging Software Industry Volume Share (%), by Image Type 2025 & 2033
- Figure 55: Asia Medical X-Ray Equipment and Imaging Software Industry Revenue (Million), by End-user 2025 & 2033
- Figure 56: Asia Medical X-Ray Equipment and Imaging Software Industry Volume (K Unit), by End-user 2025 & 2033
- Figure 57: Asia Medical X-Ray Equipment and Imaging Software Industry Revenue Share (%), by End-user 2025 & 2033
- Figure 58: Asia Medical X-Ray Equipment and Imaging Software Industry Volume Share (%), by End-user 2025 & 2033
- Figure 59: Asia Medical X-Ray Equipment and Imaging Software Industry Revenue (Million), by Country 2025 & 2033
- Figure 60: Asia Medical X-Ray Equipment and Imaging Software Industry Volume (K Unit), by Country 2025 & 2033
- Figure 61: Asia Medical X-Ray Equipment and Imaging Software Industry Revenue Share (%), by Country 2025 & 2033
- Figure 62: Asia Medical X-Ray Equipment and Imaging Software Industry Volume Share (%), by Country 2025 & 2033
- Figure 63: Australia and New Zealand Medical X-Ray Equipment and Imaging Software Industry Revenue (Million), by Type 2025 & 2033
- Figure 64: Australia and New Zealand Medical X-Ray Equipment and Imaging Software Industry Volume (K Unit), by Type 2025 & 2033
- Figure 65: Australia and New Zealand Medical X-Ray Equipment and Imaging Software Industry Revenue Share (%), by Type 2025 & 2033
- Figure 66: Australia and New Zealand Medical X-Ray Equipment and Imaging Software Industry Volume Share (%), by Type 2025 & 2033
- Figure 67: Australia and New Zealand Medical X-Ray Equipment and Imaging Software Industry Revenue (Million), by Technology 2025 & 2033
- Figure 68: Australia and New Zealand Medical X-Ray Equipment and Imaging Software Industry Volume (K Unit), by Technology 2025 & 2033
- Figure 69: Australia and New Zealand Medical X-Ray Equipment and Imaging Software Industry Revenue Share (%), by Technology 2025 & 2033
- Figure 70: Australia and New Zealand Medical X-Ray Equipment and Imaging Software Industry Volume Share (%), by Technology 2025 & 2033
- Figure 71: Australia and New Zealand Medical X-Ray Equipment and Imaging Software Industry Revenue (Million), by Image Type 2025 & 2033
- Figure 72: Australia and New Zealand Medical X-Ray Equipment and Imaging Software Industry Volume (K Unit), by Image Type 2025 & 2033
- Figure 73: Australia and New Zealand Medical X-Ray Equipment and Imaging Software Industry Revenue Share (%), by Image Type 2025 & 2033
- Figure 74: Australia and New Zealand Medical X-Ray Equipment and Imaging Software Industry Volume Share (%), by Image Type 2025 & 2033
- Figure 75: Australia and New Zealand Medical X-Ray Equipment and Imaging Software Industry Revenue (Million), by End-user 2025 & 2033
- Figure 76: Australia and New Zealand Medical X-Ray Equipment and Imaging Software Industry Volume (K Unit), by End-user 2025 & 2033
- Figure 77: Australia and New Zealand Medical X-Ray Equipment and Imaging Software Industry Revenue Share (%), by End-user 2025 & 2033
- Figure 78: Australia and New Zealand Medical X-Ray Equipment and Imaging Software Industry Volume Share (%), by End-user 2025 & 2033
- Figure 79: Australia and New Zealand Medical X-Ray Equipment and Imaging Software Industry Revenue (Million), by Country 2025 & 2033
- Figure 80: Australia and New Zealand Medical X-Ray Equipment and Imaging Software Industry Volume (K Unit), by Country 2025 & 2033
- Figure 81: Australia and New Zealand Medical X-Ray Equipment and Imaging Software Industry Revenue Share (%), by Country 2025 & 2033
- Figure 82: Australia and New Zealand Medical X-Ray Equipment and Imaging Software Industry Volume Share (%), by Country 2025 & 2033
- Figure 83: Middle East and Africa Medical X-Ray Equipment and Imaging Software Industry Revenue (Million), by Type 2025 & 2033
- Figure 84: Middle East and Africa Medical X-Ray Equipment and Imaging Software Industry Volume (K Unit), by Type 2025 & 2033
- Figure 85: Middle East and Africa Medical X-Ray Equipment and Imaging Software Industry Revenue Share (%), by Type 2025 & 2033
- Figure 86: Middle East and Africa Medical X-Ray Equipment and Imaging Software Industry Volume Share (%), by Type 2025 & 2033
- Figure 87: Middle East and Africa Medical X-Ray Equipment and Imaging Software Industry Revenue (Million), by Technology 2025 & 2033
- Figure 88: Middle East and Africa Medical X-Ray Equipment and Imaging Software Industry Volume (K Unit), by Technology 2025 & 2033
- Figure 89: Middle East and Africa Medical X-Ray Equipment and Imaging Software Industry Revenue Share (%), by Technology 2025 & 2033
- Figure 90: Middle East and Africa Medical X-Ray Equipment and Imaging Software Industry Volume Share (%), by Technology 2025 & 2033
- Figure 91: Middle East and Africa Medical X-Ray Equipment and Imaging Software Industry Revenue (Million), by Image Type 2025 & 2033
- Figure 92: Middle East and Africa Medical X-Ray Equipment and Imaging Software Industry Volume (K Unit), by Image Type 2025 & 2033
- Figure 93: Middle East and Africa Medical X-Ray Equipment and Imaging Software Industry Revenue Share (%), by Image Type 2025 & 2033
- Figure 94: Middle East and Africa Medical X-Ray Equipment and Imaging Software Industry Volume Share (%), by Image Type 2025 & 2033
- Figure 95: Middle East and Africa Medical X-Ray Equipment and Imaging Software Industry Revenue (Million), by End-user 2025 & 2033
- Figure 96: Middle East and Africa Medical X-Ray Equipment and Imaging Software Industry Volume (K Unit), by End-user 2025 & 2033
- Figure 97: Middle East and Africa Medical X-Ray Equipment and Imaging Software Industry Revenue Share (%), by End-user 2025 & 2033
- Figure 98: Middle East and Africa Medical X-Ray Equipment and Imaging Software Industry Volume Share (%), by End-user 2025 & 2033
- Figure 99: Middle East and Africa Medical X-Ray Equipment and Imaging Software Industry Revenue (Million), by Country 2025 & 2033
- Figure 100: Middle East and Africa Medical X-Ray Equipment and Imaging Software Industry Volume (K Unit), by Country 2025 & 2033
- Figure 101: Middle East and Africa Medical X-Ray Equipment and Imaging Software Industry Revenue Share (%), by Country 2025 & 2033
- Figure 102: Middle East and Africa Medical X-Ray Equipment and Imaging Software Industry Volume Share (%), by Country 2025 & 2033
- Figure 103: Latin America Medical X-Ray Equipment and Imaging Software Industry Revenue (Million), by Type 2025 & 2033
- Figure 104: Latin America Medical X-Ray Equipment and Imaging Software Industry Volume (K Unit), by Type 2025 & 2033
- Figure 105: Latin America Medical X-Ray Equipment and Imaging Software Industry Revenue Share (%), by Type 2025 & 2033
- Figure 106: Latin America Medical X-Ray Equipment and Imaging Software Industry Volume Share (%), by Type 2025 & 2033
- Figure 107: Latin America Medical X-Ray Equipment and Imaging Software Industry Revenue (Million), by Technology 2025 & 2033
- Figure 108: Latin America Medical X-Ray Equipment and Imaging Software Industry Volume (K Unit), by Technology 2025 & 2033
- Figure 109: Latin America Medical X-Ray Equipment and Imaging Software Industry Revenue Share (%), by Technology 2025 & 2033
- Figure 110: Latin America Medical X-Ray Equipment and Imaging Software Industry Volume Share (%), by Technology 2025 & 2033
- Figure 111: Latin America Medical X-Ray Equipment and Imaging Software Industry Revenue (Million), by Image Type 2025 & 2033
- Figure 112: Latin America Medical X-Ray Equipment and Imaging Software Industry Volume (K Unit), by Image Type 2025 & 2033
- Figure 113: Latin America Medical X-Ray Equipment and Imaging Software Industry Revenue Share (%), by Image Type 2025 & 2033
- Figure 114: Latin America Medical X-Ray Equipment and Imaging Software Industry Volume Share (%), by Image Type 2025 & 2033
- Figure 115: Latin America Medical X-Ray Equipment and Imaging Software Industry Revenue (Million), by End-user 2025 & 2033
- Figure 116: Latin America Medical X-Ray Equipment and Imaging Software Industry Volume (K Unit), by End-user 2025 & 2033
- Figure 117: Latin America Medical X-Ray Equipment and Imaging Software Industry Revenue Share (%), by End-user 2025 & 2033
- Figure 118: Latin America Medical X-Ray Equipment and Imaging Software Industry Volume Share (%), by End-user 2025 & 2033
- Figure 119: Latin America Medical X-Ray Equipment and Imaging Software Industry Revenue (Million), by Country 2025 & 2033
- Figure 120: Latin America Medical X-Ray Equipment and Imaging Software Industry Volume (K Unit), by Country 2025 & 2033
- Figure 121: Latin America Medical X-Ray Equipment and Imaging Software Industry Revenue Share (%), by Country 2025 & 2033
- Figure 122: Latin America Medical X-Ray Equipment and Imaging Software Industry Volume Share (%), by Country 2025 & 2033
List of Tables
- Table 1: Global Medical X-Ray Equipment and Imaging Software Industry Revenue Million Forecast, by Type 2020 & 2033
- Table 2: Global Medical X-Ray Equipment and Imaging Software Industry Volume K Unit Forecast, by Type 2020 & 2033
- Table 3: Global Medical X-Ray Equipment and Imaging Software Industry Revenue Million Forecast, by Technology 2020 & 2033
- Table 4: Global Medical X-Ray Equipment and Imaging Software Industry Volume K Unit Forecast, by Technology 2020 & 2033
- Table 5: Global Medical X-Ray Equipment and Imaging Software Industry Revenue Million Forecast, by Image Type 2020 & 2033
- Table 6: Global Medical X-Ray Equipment and Imaging Software Industry Volume K Unit Forecast, by Image Type 2020 & 2033
- Table 7: Global Medical X-Ray Equipment and Imaging Software Industry Revenue Million Forecast, by End-user 2020 & 2033
- Table 8: Global Medical X-Ray Equipment and Imaging Software Industry Volume K Unit Forecast, by End-user 2020 & 2033
- Table 9: Global Medical X-Ray Equipment and Imaging Software Industry Revenue Million Forecast, by Region 2020 & 2033
- Table 10: Global Medical X-Ray Equipment and Imaging Software Industry Volume K Unit Forecast, by Region 2020 & 2033
- Table 11: Global Medical X-Ray Equipment and Imaging Software Industry Revenue Million Forecast, by Type 2020 & 2033
- Table 12: Global Medical X-Ray Equipment and Imaging Software Industry Volume K Unit Forecast, by Type 2020 & 2033
- Table 13: Global Medical X-Ray Equipment and Imaging Software Industry Revenue Million Forecast, by Technology 2020 & 2033
- Table 14: Global Medical X-Ray Equipment and Imaging Software Industry Volume K Unit Forecast, by Technology 2020 & 2033
- Table 15: Global Medical X-Ray Equipment and Imaging Software Industry Revenue Million Forecast, by Image Type 2020 & 2033
- Table 16: Global Medical X-Ray Equipment and Imaging Software Industry Volume K Unit Forecast, by Image Type 2020 & 2033
- Table 17: Global Medical X-Ray Equipment and Imaging Software Industry Revenue Million Forecast, by End-user 2020 & 2033
- Table 18: Global Medical X-Ray Equipment and Imaging Software Industry Volume K Unit Forecast, by End-user 2020 & 2033
- Table 19: Global Medical X-Ray Equipment and Imaging Software Industry Revenue Million Forecast, by Country 2020 & 2033
- Table 20: Global Medical X-Ray Equipment and Imaging Software Industry Volume K Unit Forecast, by Country 2020 & 2033
- Table 21: Global Medical X-Ray Equipment and Imaging Software Industry Revenue Million Forecast, by Type 2020 & 2033
- Table 22: Global Medical X-Ray Equipment and Imaging Software Industry Volume K Unit Forecast, by Type 2020 & 2033
- Table 23: Global Medical X-Ray Equipment and Imaging Software Industry Revenue Million Forecast, by Technology 2020 & 2033
- Table 24: Global Medical X-Ray Equipment and Imaging Software Industry Volume K Unit Forecast, by Technology 2020 & 2033
- Table 25: Global Medical X-Ray Equipment and Imaging Software Industry Revenue Million Forecast, by Image Type 2020 & 2033
- Table 26: Global Medical X-Ray Equipment and Imaging Software Industry Volume K Unit Forecast, by Image Type 2020 & 2033
- Table 27: Global Medical X-Ray Equipment and Imaging Software Industry Revenue Million Forecast, by End-user 2020 & 2033
- Table 28: Global Medical X-Ray Equipment and Imaging Software Industry Volume K Unit Forecast, by End-user 2020 & 2033
- Table 29: Global Medical X-Ray Equipment and Imaging Software Industry Revenue Million Forecast, by Country 2020 & 2033
- Table 30: Global Medical X-Ray Equipment and Imaging Software Industry Volume K Unit Forecast, by Country 2020 & 2033
- Table 31: Global Medical X-Ray Equipment and Imaging Software Industry Revenue Million Forecast, by Type 2020 & 2033
- Table 32: Global Medical X-Ray Equipment and Imaging Software Industry Volume K Unit Forecast, by Type 2020 & 2033
- Table 33: Global Medical X-Ray Equipment and Imaging Software Industry Revenue Million Forecast, by Technology 2020 & 2033
- Table 34: Global Medical X-Ray Equipment and Imaging Software Industry Volume K Unit Forecast, by Technology 2020 & 2033
- Table 35: Global Medical X-Ray Equipment and Imaging Software Industry Revenue Million Forecast, by Image Type 2020 & 2033
- Table 36: Global Medical X-Ray Equipment and Imaging Software Industry Volume K Unit Forecast, by Image Type 2020 & 2033
- Table 37: Global Medical X-Ray Equipment and Imaging Software Industry Revenue Million Forecast, by End-user 2020 & 2033
- Table 38: Global Medical X-Ray Equipment and Imaging Software Industry Volume K Unit Forecast, by End-user 2020 & 2033
- Table 39: Global Medical X-Ray Equipment and Imaging Software Industry Revenue Million Forecast, by Country 2020 & 2033
- Table 40: Global Medical X-Ray Equipment and Imaging Software Industry Volume K Unit Forecast, by Country 2020 & 2033
- Table 41: Global Medical X-Ray Equipment and Imaging Software Industry Revenue Million Forecast, by Type 2020 & 2033
- Table 42: Global Medical X-Ray Equipment and Imaging Software Industry Volume K Unit Forecast, by Type 2020 & 2033
- Table 43: Global Medical X-Ray Equipment and Imaging Software Industry Revenue Million Forecast, by Technology 2020 & 2033
- Table 44: Global Medical X-Ray Equipment and Imaging Software Industry Volume K Unit Forecast, by Technology 2020 & 2033
- Table 45: Global Medical X-Ray Equipment and Imaging Software Industry Revenue Million Forecast, by Image Type 2020 & 2033
- Table 46: Global Medical X-Ray Equipment and Imaging Software Industry Volume K Unit Forecast, by Image Type 2020 & 2033
- Table 47: Global Medical X-Ray Equipment and Imaging Software Industry Revenue Million Forecast, by End-user 2020 & 2033
- Table 48: Global Medical X-Ray Equipment and Imaging Software Industry Volume K Unit Forecast, by End-user 2020 & 2033
- Table 49: Global Medical X-Ray Equipment and Imaging Software Industry Revenue Million Forecast, by Country 2020 & 2033
- Table 50: Global Medical X-Ray Equipment and Imaging Software Industry Volume K Unit Forecast, by Country 2020 & 2033
- Table 51: Global Medical X-Ray Equipment and Imaging Software Industry Revenue Million Forecast, by Type 2020 & 2033
- Table 52: Global Medical X-Ray Equipment and Imaging Software Industry Volume K Unit Forecast, by Type 2020 & 2033
- Table 53: Global Medical X-Ray Equipment and Imaging Software Industry Revenue Million Forecast, by Technology 2020 & 2033
- Table 54: Global Medical X-Ray Equipment and Imaging Software Industry Volume K Unit Forecast, by Technology 2020 & 2033
- Table 55: Global Medical X-Ray Equipment and Imaging Software Industry Revenue Million Forecast, by Image Type 2020 & 2033
- Table 56: Global Medical X-Ray Equipment and Imaging Software Industry Volume K Unit Forecast, by Image Type 2020 & 2033
- Table 57: Global Medical X-Ray Equipment and Imaging Software Industry Revenue Million Forecast, by End-user 2020 & 2033
- Table 58: Global Medical X-Ray Equipment and Imaging Software Industry Volume K Unit Forecast, by End-user 2020 & 2033
- Table 59: Global Medical X-Ray Equipment and Imaging Software Industry Revenue Million Forecast, by Country 2020 & 2033
- Table 60: Global Medical X-Ray Equipment and Imaging Software Industry Volume K Unit Forecast, by Country 2020 & 2033
- Table 61: Global Medical X-Ray Equipment and Imaging Software Industry Revenue Million Forecast, by Type 2020 & 2033
- Table 62: Global Medical X-Ray Equipment and Imaging Software Industry Volume K Unit Forecast, by Type 2020 & 2033
- Table 63: Global Medical X-Ray Equipment and Imaging Software Industry Revenue Million Forecast, by Technology 2020 & 2033
- Table 64: Global Medical X-Ray Equipment and Imaging Software Industry Volume K Unit Forecast, by Technology 2020 & 2033
- Table 65: Global Medical X-Ray Equipment and Imaging Software Industry Revenue Million Forecast, by Image Type 2020 & 2033
- Table 66: Global Medical X-Ray Equipment and Imaging Software Industry Volume K Unit Forecast, by Image Type 2020 & 2033
- Table 67: Global Medical X-Ray Equipment and Imaging Software Industry Revenue Million Forecast, by End-user 2020 & 2033
- Table 68: Global Medical X-Ray Equipment and Imaging Software Industry Volume K Unit Forecast, by End-user 2020 & 2033
- Table 69: Global Medical X-Ray Equipment and Imaging Software Industry Revenue Million Forecast, by Country 2020 & 2033
- Table 70: Global Medical X-Ray Equipment and Imaging Software Industry Volume K Unit Forecast, by Country 2020 & 2033
Frequently Asked Questions
1. What is the projected Compound Annual Growth Rate (CAGR) of the Medical X-Ray Equipment and Imaging Software Industry?
The projected CAGR is approximately 4.60%.
2. Which companies are prominent players in the Medical X-Ray Equipment and Imaging Software Industry?
Key companies in the market include Konica Minolta Inc, Siemens Healthcare GmbH, Canon Inc, IBM Corporation, Varex Imaging Corporation, Hitachi Ltd, Shimazdu Corporation, Hologic Inc , Koninklijke Philips NV, GE Healthcare Inc, Carestream Health Inc, Fujifilm Holdings Corporation.
3. What are the main segments of the Medical X-Ray Equipment and Imaging Software Industry?
The market segments include Type, Technology, Image Type, End-user.
4. Can you provide details about the market size?
The market size is estimated to be USD XX Million as of 2022.
5. What are some drivers contributing to market growth?
Increasing Incidences of Diseases and Growing Geriatric Population; Rising Investments in Healthcare Industry and Favorable Government Initiatives.
6. What are the notable trends driving market growth?
Diagnostic Centers Majorly Drive the Market Demand.
7. Are there any restraints impacting market growth?
Stringent Regulations and Validator Guidelines; Security Issues Associated with the Software.
8. Can you provide examples of recent developments in the market?
July 2023 - Shimadzu Corporation announced the release of a new mobile X-ray system known as MobileDaRt Evolution MX8 version k type, which is equipped with serial radiography functionality known as Dynamic Digital Radiography (DDR). It displays a series of static images captured at high speed as a moving image.
9. What pricing options are available for accessing the report?
Pricing options include single-user, multi-user, and enterprise licenses priced at USD 4750, USD 5250, and USD 8750 respectively.
10. Is the market size provided in terms of value or volume?
The market size is provided in terms of value, measured in Million and volume, measured in K Unit.
11. Are there any specific market keywords associated with the report?
Yes, the market keyword associated with the report is "Medical X-Ray Equipment and Imaging Software Industry," which aids in identifying and referencing the specific market segment covered.
12. How do I determine which pricing option suits my needs best?
The pricing options vary based on user requirements and access needs. Individual users may opt for single-user licenses, while businesses requiring broader access may choose multi-user or enterprise licenses for cost-effective access to the report.
13. Are there any additional resources or data provided in the Medical X-Ray Equipment and Imaging Software Industry report?
While the report offers comprehensive insights, it's advisable to review the specific contents or supplementary materials provided to ascertain if additional resources or data are available.
14. How can I stay updated on further developments or reports in the Medical X-Ray Equipment and Imaging Software Industry?
To stay informed about further developments, trends, and reports in the Medical X-Ray Equipment and Imaging Software Industry, consider subscribing to industry newsletters, following relevant companies and organizations, or regularly checking reputable industry news sources and publications.
Methodology
Step 1 - Identification of Relevant Samples Size from Population Database


Step 2 - Approaches for Defining Global Market Size (Value, Volume* & Price*)

Note*: In applicable scenarios
Step 3 - Data Sources
Primary Research
- Web Analytics
- Survey Reports
- Research Institute
- Latest Research Reports
- Opinion Leaders
Secondary Research
- Annual Reports
- White Paper
- Latest Press Release
- Industry Association
- Paid Database
- Investor Presentations

Step 4 - Data Triangulation
Involves using different sources of information in order to increase the validity of a study
These sources are likely to be stakeholders in a program - participants, other researchers, program staff, other community members, and so on.
Then we put all data in single framework & apply various statistical tools to find out the dynamic on the market.
During the analysis stage, feedback from the stakeholder groups would be compared to determine areas of agreement as well as areas of divergence

