

Key Insights
The global metal beverage can market is poised for steady expansion, projected to reach a significant USD 52,230 million by 2025. This growth is underpinned by a Compound Annual Growth Rate (CAGR) of 2.8% during the forecast period of 2025-2033. The primary drivers fueling this expansion include the increasing global demand for convenient and portable beverage packaging, particularly for alcoholic and non-alcoholic drinks. The inherent recyclability and sustainability of metal cans, especially aluminum, resonate strongly with environmentally conscious consumers and regulatory bodies, further bolstering their adoption. The market's segmentation highlights the dominance of the Beer and Carbonated Drinks applications, which consistently represent the largest share due to widespread consumption patterns. In terms of types, aluminum cans are expected to lead the market due to their lightweight properties, excellent barrier protection, and high recyclability rates, making them a preferred choice for beverage manufacturers.
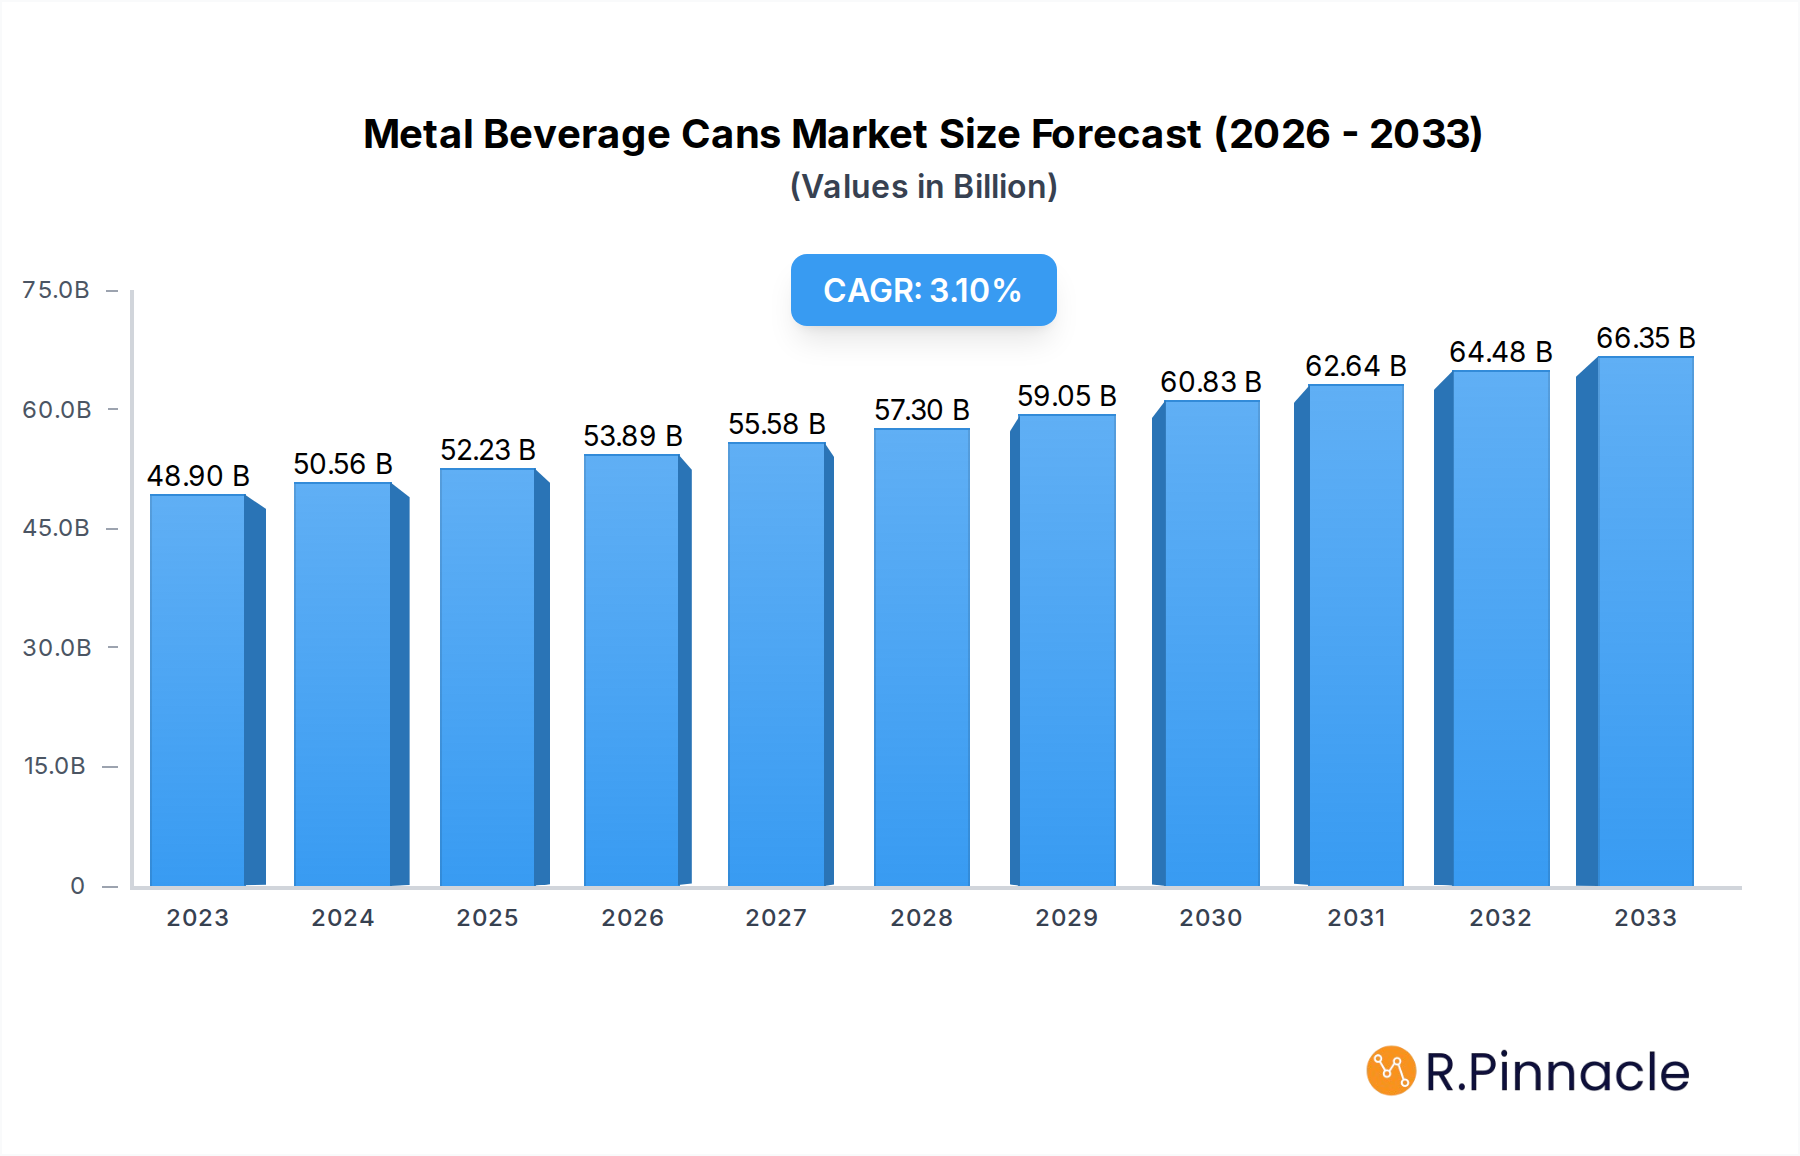
Metal Beverage Cans Market Size (In Billion)
The competitive landscape is characterized by the presence of major global players such as Ball Corporation, Crown Holdings, and Ardagh Group, alongside significant regional manufacturers. These companies are actively investing in technological advancements, capacity expansions, and sustainable packaging solutions to maintain their market positions and cater to evolving consumer preferences. Trends such as the growing popularity of craft beverages, the demand for innovative can designs and sizes, and the increasing adoption of single-serve packaging are shaping the market's trajectory. However, the market also faces restraints, including fluctuating raw material prices (especially for aluminum) and increasing competition from alternative packaging materials like PET bottles and cartons, which may present challenges to sustained growth. Despite these hurdles, the metal beverage can market is expected to maintain a robust growth path driven by its intrinsic advantages and adapting to emerging market dynamics.

Metal Beverage Cans Company Market Share
Unlocking the Global Metal Beverage Cans Market: An In-Depth Industry Report (2019–2033)
This comprehensive report provides an unparalleled analysis of the global Metal Beverage Cans market, forecasting its trajectory from 2019 to 2033, with a base year of 2025. Delve into the intricate market structure, dynamic trends, and pivotal innovations shaping this multi-billion dollar industry. Leveraging extensive historical data (2019-2024) and forward-looking estimations, this report offers actionable insights for industry professionals, investors, and stakeholders seeking to navigate the competitive landscape of beer cans, carbonated drink cans, and other beverage packaging solutions. Explore the dominance of aluminum and steel can types, understand regional market leadership, and uncover the strategic moves of key players like Ball Corporation, Crown Holdings, and Ardagh Group.
Metal Beverage Cans Market Structure & Innovation Trends
The global Metal Beverage Cans market exhibits a moderately concentrated structure, with a few dominant players like Ball Corporation, Crown Holdings, and Ardagh Group holding significant market share, estimated to be over 60% of the total market value. The competitive intensity is driven by continuous innovation, stringent regulatory frameworks, and evolving consumer preferences for sustainable packaging. Key innovation drivers include the development of lighter-weight cans, enhanced barrier properties, improved recyclability, and advanced printing technologies for enhanced branding. The threat of product substitutes, primarily plastic bottles and cartons, remains a considerable factor, though metal cans retain their premium perception and superior shelf-life advantages for certain beverages. End-user demographics are increasingly leaning towards younger, environmentally conscious consumers, influencing demand for sustainable and premium packaging. Mergers and acquisition (M&A) activities have played a crucial role in market consolidation. Notable M&A deals in the historical period (2019-2024) are valued in the hundreds of millions, aimed at expanding geographical reach and product portfolios. For instance, an M&A deal in 2023 involving the acquisition of a regional packaging company by a global leader was valued at approximately $250 million, signaling ongoing strategic realignments. Regulatory frameworks, particularly those promoting recycling and reducing single-use plastics, are indirectly bolstering the market for recyclable metal cans.
Metal Beverage Cans Market Dynamics & Trends
The Metal Beverage Cans market is experiencing robust growth, propelled by several interconnected dynamics and prevailing trends. The estimated market size for 2025 stands at over $110 billion, with a projected Compound Annual Growth Rate (CAGR) of approximately 4.5% during the forecast period of 2025–2033. This growth is fundamentally driven by the escalating global demand for beverages, particularly carbonated soft drinks and beer, which constitute the largest application segments. The increasing disposable income in emerging economies, coupled with a growing middle class, is fueling higher per capita consumption of these beverages, directly translating into increased demand for their packaging. Technological disruptions are continuously reshaping the manufacturing processes and product attributes. Innovations in can manufacturing, such as advanced forming techniques and improved lining materials, are leading to lighter, stronger, and more cost-effective cans. Furthermore, the focus on sustainability is a major transformative trend. As environmental concerns rise, consumers and beverage manufacturers are increasingly favoring infinitely recyclable materials like aluminum. This trend is amplified by government regulations and corporate sustainability initiatives that promote circular economy principles and reduce the reliance on less sustainable packaging alternatives. Consumer preferences are also evolving, with a growing demand for convenience, portability, and aesthetically appealing packaging. The rise of single-serve portions and on-the-go consumption further benefits the beverage can format. Competitive dynamics within the market are characterized by intense price competition, a focus on product innovation, and strategic partnerships between can manufacturers and beverage companies. Market penetration for metal beverage cans remains high in developed regions, while significant growth potential exists in developing markets. The shift towards premiumization in the beverage sector, with consumers willing to pay more for differentiated products, also positively impacts the metal beverage can market, as these cans are often associated with higher quality and brand value. The adoption of smart packaging technologies, though nascent, represents another emerging trend that could further differentiate metal beverage cans and enhance their appeal.
Dominant Regions & Segments in Metal Beverage Cans
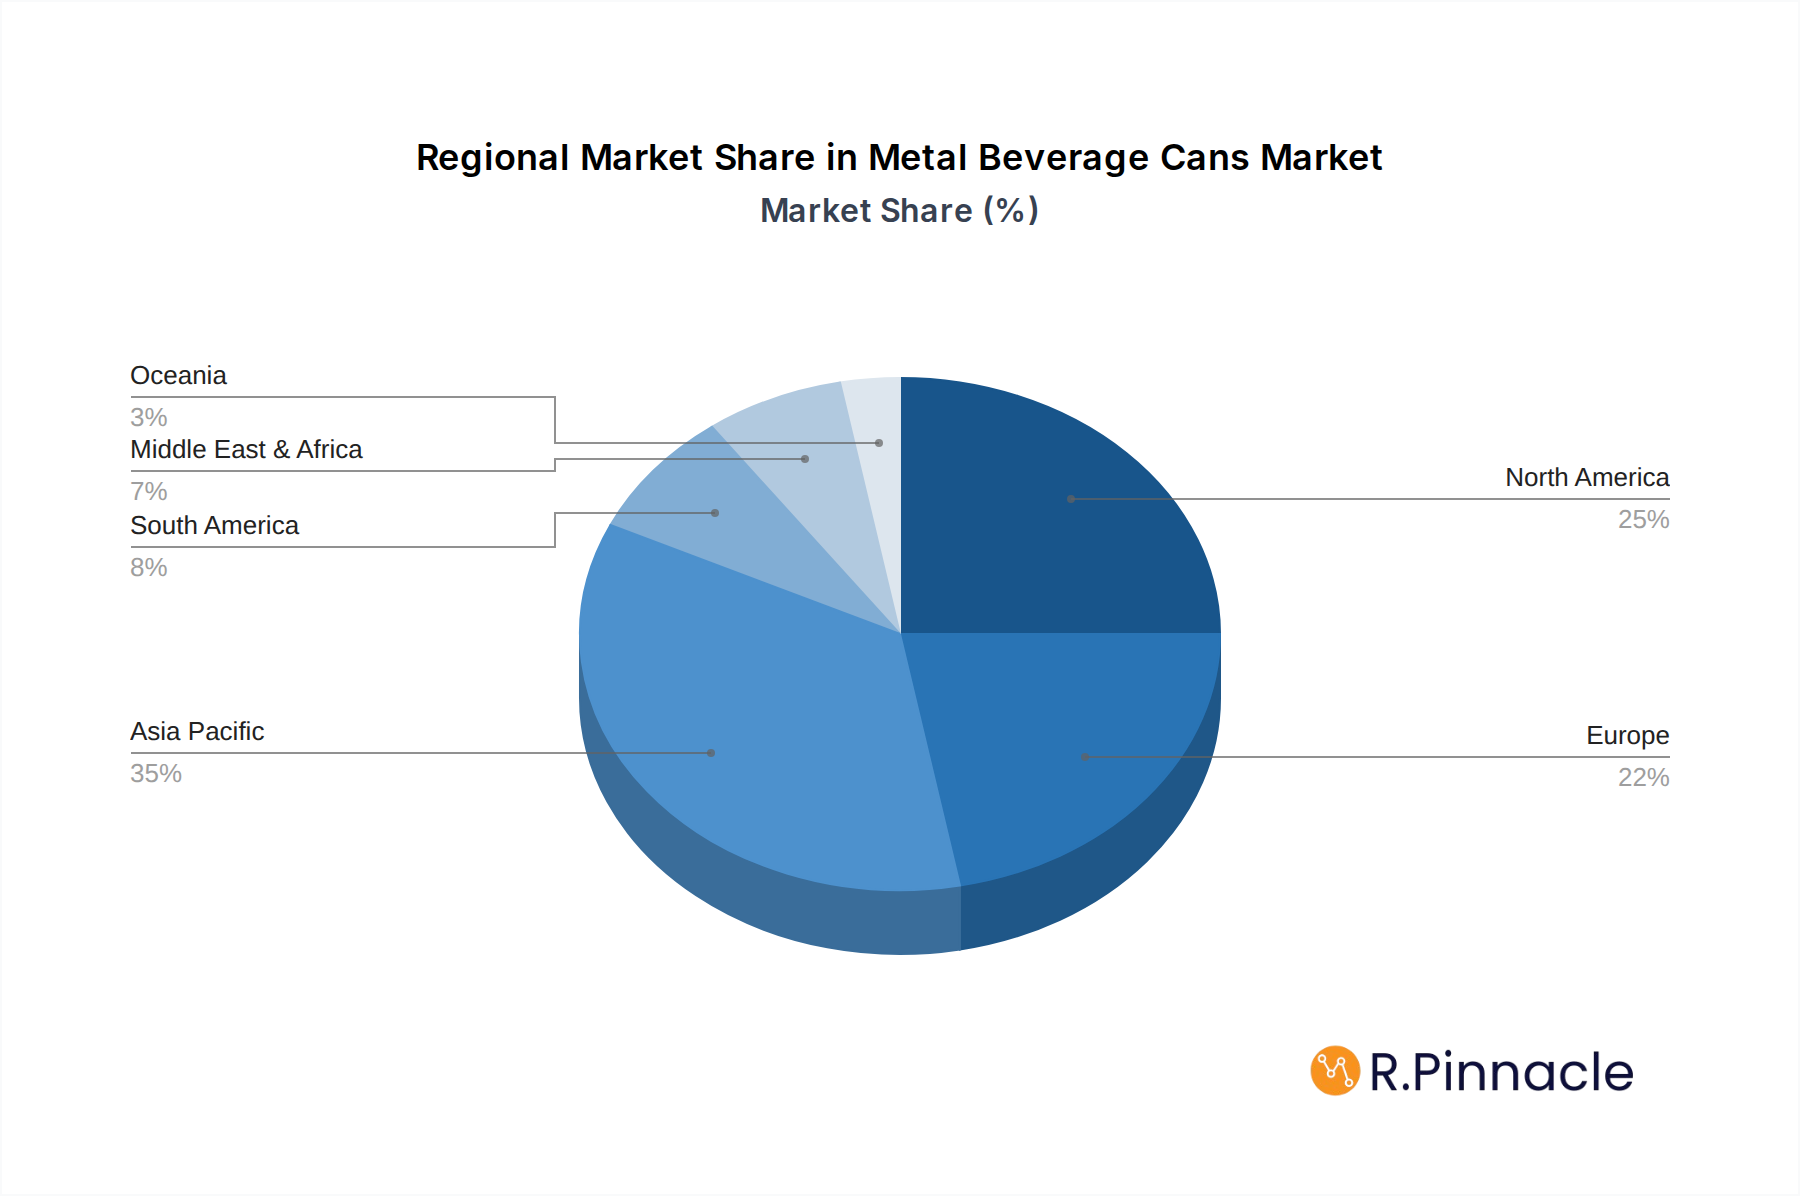
The global Metal Beverage Cans market is characterized by distinct regional dominance and segment preferences. North America currently stands as the leading region, driven by a mature beverage industry, high per capita consumption, and robust demand for both beer and carbonated drinks. The United States specifically accounts for a substantial portion of this regional dominance. Key drivers for this leadership include advanced manufacturing infrastructure, strong brand loyalty for popular beverage categories packaged in cans, and well-established recycling programs that support the circular economy for aluminum. The economic policies supporting domestic manufacturing and innovation in packaging technologies further solidify North America's position.
In terms of Application, Carbonated Drinks represent the largest and most dominant segment globally. This is attributable to the immense popularity of carbonated soft drinks, energy drinks, and sparkling water worldwide. The forecast period is expected to see continued strong growth in this segment. The Beer application segment is the second largest and exhibits steady growth, particularly with the rise of craft breweries and single-serve formats. The Others segment, encompassing non-carbonated beverages like juices, teas, and plant-based drinks, is also a growing contributor, driven by evolving consumer health consciousness and product diversification.
Regarding Types, Aluminum cans are the undisputed leader and are projected to maintain their dominance throughout the forecast period. The estimated market share for aluminum cans is over 80%. This leadership is underpinned by aluminum's inherent advantages: its lightweight nature, excellent recyclability (with a high recovery rate), superior corrosion resistance, and ability to be formed into various shapes, making it ideal for branding and design. The energy efficiency in recycling aluminum also aligns with global sustainability goals. Steel cans, while still significant, particularly in certain industrial beverage applications and some niche markets, hold a smaller market share, estimated to be around 15-20%. Their use is more prevalent in applications where cost is a primary driver or for specific product preservation needs.
Metal Beverage Cans Product Innovations
Product innovations in the Metal Beverage Cans sector are primarily focused on enhancing sustainability, functionality, and consumer appeal. Lighter-weight can designs, achieved through thinner materials and optimized geometries, are reducing material costs and transportation emissions. Advancements in barrier coatings are improving product shelf-life and taste preservation, especially for sensitive beverages. The development of easier-to-open and resealable can tops aims to enhance consumer convenience. Furthermore, companies are investing in advanced printing and finishing techniques, allowing for vibrant graphics and premium brand aesthetics. The competitive advantage of these innovations lies in their ability to meet evolving consumer demands for eco-friendly, convenient, and visually attractive packaging, while also contributing to cost efficiencies for manufacturers.
Report Scope & Segmentation Analysis
This report offers a comprehensive segmentation of the Metal Beverage Cans market. The Application segment is analyzed across three key categories: Beer, characterized by consistent demand and growth fueled by craft brewing; Carbonated Drinks, the largest segment driven by global consumption of soft drinks and energy drinks; and Others, encompassing a growing range of non-carbonated beverages like juices, teas, and plant-based drinks, with strong growth projections due to diversification in consumer preferences.
The Types segment is meticulously divided into Steel and Aluminum. The Aluminum segment is projected to dominate the market, with an estimated market size exceeding $90 billion in 2025, driven by its sustainability credentials and widespread adoption. The Steel segment, while smaller, with an estimated market size of over $15 billion in 2025, remains important for specific applications and regional markets, with moderate growth anticipated. Competitive dynamics within each segment are explored, detailing market share, growth drivers, and key players.
Key Drivers of Metal Beverage Cans Growth
The Metal Beverage Cans market is propelled by a confluence of significant growth drivers. Increasing global beverage consumption is the primary engine, fueled by population growth and rising disposable incomes, particularly in emerging economies. Growing consumer preference for sustainable packaging is a critical factor, with the infinite recyclability of aluminum aligning perfectly with environmental consciousness and regulatory pushes towards a circular economy. Technological advancements in can manufacturing leading to lighter, more durable, and cost-effective cans contribute significantly to market expansion. The versatility of metal cans for a wide range of beverages, from carbonated drinks to beer and juices, ensures sustained demand. Furthermore, favorable government regulations promoting recycling and sustainability indirectly boost the metal can market by penalizing less sustainable alternatives.
Challenges in the Metal Beverage Cans Sector
Despite robust growth, the Metal Beverage Cans sector faces several challenges. Price volatility of raw materials, particularly aluminum and steel, can impact manufacturing costs and profit margins. Intense competition from alternative packaging materials, such as PET bottles and cartons, poses a continuous threat, especially in price-sensitive segments. Stringent environmental regulations and compliance costs associated with production and recycling can add to operational expenses. Supply chain disruptions, as seen in recent global events, can affect the availability and cost of raw materials and finished goods. Lastly, evolving consumer preferences and demand for niche packaging solutions require constant adaptation and innovation from manufacturers.
Emerging Opportunities in Metal Beverage Cans
The Metal Beverage Cans market is ripe with emerging opportunities. The expansion of beverage consumption in developing economies presents a vast untapped market. The growing demand for functional beverages and premium alcoholic drinks offers avenues for specialized can designs and features. Innovations in smart packaging and connected cans present opportunities for enhanced consumer engagement and supply chain traceability. The increasing focus on circular economy initiatives and recycling infrastructure development further supports the dominance of aluminum cans. Furthermore, the development of novel can formats and closures catering to specific consumer needs, such as enhanced portability and convenience, will drive future growth.
Leading Players in the Metal Beverage Cans Market
- Ball Corporation
- Crown Holdings
- Ardagh Group
- Toyo Seikan
- Can Pack Group
- Silgan Holdings Inc
- Daiwa Can Company
- Baosteel Packaging
- ORG Technology
- ShengXing Group
- CPMC Holdings
- Hokkan Holdings
- Showa Aluminum Can Corporation
- United Can (Great China Metal)
- Kingcan Holdings
- Jiamei Food Packaging
- Jiyuan Packaging Holdings
Key Developments in Metal Beverage Cans Industry
- 2023/08: Ball Corporation launches new lightweight aluminum can designs, reducing material usage by 5% and significantly lowering carbon footprint.
- 2023/05: Crown Holdings announces expansion of its recycled content initiatives, aiming for 80% recycled aluminum in its beverage cans by 2025.
- 2023/02: Ardagh Group invests $50 million in a new recycling facility in Europe to boost aluminum can circularity.
- 2022/11: Toyo Seikan develops advanced internal coating technology to enhance shelf-life for sensitive beverages in metal cans.
- 2022/07: Can Pack Group introduces innovative resealable can closures for enhanced consumer convenience in the beverage market.
- 2022/04: Silgan Holdings Inc. acquires a specialty packaging firm, expanding its presence in niche beverage segments.
- 2021/10: ORG Technology invests heavily in R&D for advanced aluminum alloys to further reduce can weight.
- 2021/06: Baosteel Packaging focuses on developing steel cans with improved environmental performance and recyclability.
- 2020/09: CPMC Holdings consolidates its market position through strategic regional expansions in Asia.
- 2020/03: Showa Aluminum Can Corporation pioneers the use of enhanced graphics and finishes for premium beverage branding.
- 2019/12: United Can (Great China Metal) enhances its production capacity to meet surging demand for carbonated drink cans.
- 2019/08: Kingcan Holdings explores new partnerships to expand its distribution network for metal beverage cans.
Future Outlook for Metal Beverage Cans Market
The future outlook for the Metal Beverage Cans market remains exceptionally positive, driven by an unwavering demand for convenient, sustainable, and premium beverage packaging. The ongoing shift towards aluminum, owing to its superior recyclability and environmental credentials, will continue to fuel market expansion. Innovations in lightweighting, advanced printing, and smart packaging technologies will further enhance the competitive edge of metal cans. Emerging markets represent significant growth accelerators, as rising disposable incomes and urbanization lead to increased beverage consumption. Strategic collaborations between can manufacturers and beverage brands will be crucial in tailoring packaging solutions to evolving consumer preferences and market trends, ensuring the continued dominance and growth of the metal beverage can industry.
Metal Beverage Cans Segmentation
-
1. Application
- 1.1. Beer
- 1.2. Carbonated Drinks
- 1.3. Others
-
2. Types
- 2.1. Steel
- 2.2. Aluminum
Metal Beverage Cans Segmentation By Geography
-
1. North America
- 1.1. United States
- 1.2. Canada
- 1.3. Mexico
-
2. South America
- 2.1. Brazil
- 2.2. Argentina
- 2.3. Rest of South America
-
3. Europe
- 3.1. United Kingdom
- 3.2. Germany
- 3.3. France
- 3.4. Italy
- 3.5. Spain
- 3.6. Russia
- 3.7. Benelux
- 3.8. Nordics
- 3.9. Rest of Europe
-
4. Middle East & Africa
- 4.1. Turkey
- 4.2. Israel
- 4.3. GCC
- 4.4. North Africa
- 4.5. South Africa
- 4.6. Rest of Middle East & Africa
-
5. Asia Pacific
- 5.1. China
- 5.2. India
- 5.3. Japan
- 5.4. South Korea
- 5.5. ASEAN
- 5.6. Oceania
- 5.7. Rest of Asia Pacific
Metal Beverage Cans Regional Market Share
Geographic Coverage of Metal Beverage Cans
Metal Beverage Cans REPORT HIGHLIGHTS
| Aspects | Details |
|---|---|
| Study Period | 2020-2034 |
| Base Year | 2025 |
| Estimated Year | 2026 |
| Forecast Period | 2026-2034 |
| Historical Period | 2020-2025 |
| Growth Rate | CAGR of 2.8% from 2020-2034 |
| Segmentation |
|
Table of Contents
- 1. Introduction
- 1.1. Research Scope
- 1.2. Market Segmentation
- 1.3. Research Methodology
- 1.4. Definitions and Assumptions
- 2. Executive Summary
- 2.1. Introduction
- 3. Market Dynamics
- 3.1. Introduction
- 3.2. Market Drivers
- 3.3. Market Restrains
- 3.4. Market Trends
- 4. Market Factor Analysis
- 4.1. Porters Five Forces
- 4.2. Supply/Value Chain
- 4.3. PESTEL analysis
- 4.4. Market Entropy
- 4.5. Patent/Trademark Analysis
- 5. Global Metal Beverage Cans Analysis, Insights and Forecast, 2020-2032
- 5.1. Market Analysis, Insights and Forecast - by Application
- 5.1.1. Beer
- 5.1.2. Carbonated Drinks
- 5.1.3. Others
- 5.2. Market Analysis, Insights and Forecast - by Types
- 5.2.1. Steel
- 5.2.2. Aluminum
- 5.3. Market Analysis, Insights and Forecast - by Region
- 5.3.1. North America
- 5.3.2. South America
- 5.3.3. Europe
- 5.3.4. Middle East & Africa
- 5.3.5. Asia Pacific
- 5.1. Market Analysis, Insights and Forecast - by Application
- 6. North America Metal Beverage Cans Analysis, Insights and Forecast, 2020-2032
- 6.1. Market Analysis, Insights and Forecast - by Application
- 6.1.1. Beer
- 6.1.2. Carbonated Drinks
- 6.1.3. Others
- 6.2. Market Analysis, Insights and Forecast - by Types
- 6.2.1. Steel
- 6.2.2. Aluminum
- 6.1. Market Analysis, Insights and Forecast - by Application
- 7. South America Metal Beverage Cans Analysis, Insights and Forecast, 2020-2032
- 7.1. Market Analysis, Insights and Forecast - by Application
- 7.1.1. Beer
- 7.1.2. Carbonated Drinks
- 7.1.3. Others
- 7.2. Market Analysis, Insights and Forecast - by Types
- 7.2.1. Steel
- 7.2.2. Aluminum
- 7.1. Market Analysis, Insights and Forecast - by Application
- 8. Europe Metal Beverage Cans Analysis, Insights and Forecast, 2020-2032
- 8.1. Market Analysis, Insights and Forecast - by Application
- 8.1.1. Beer
- 8.1.2. Carbonated Drinks
- 8.1.3. Others
- 8.2. Market Analysis, Insights and Forecast - by Types
- 8.2.1. Steel
- 8.2.2. Aluminum
- 8.1. Market Analysis, Insights and Forecast - by Application
- 9. Middle East & Africa Metal Beverage Cans Analysis, Insights and Forecast, 2020-2032
- 9.1. Market Analysis, Insights and Forecast - by Application
- 9.1.1. Beer
- 9.1.2. Carbonated Drinks
- 9.1.3. Others
- 9.2. Market Analysis, Insights and Forecast - by Types
- 9.2.1. Steel
- 9.2.2. Aluminum
- 9.1. Market Analysis, Insights and Forecast - by Application
- 10. Asia Pacific Metal Beverage Cans Analysis, Insights and Forecast, 2020-2032
- 10.1. Market Analysis, Insights and Forecast - by Application
- 10.1.1. Beer
- 10.1.2. Carbonated Drinks
- 10.1.3. Others
- 10.2. Market Analysis, Insights and Forecast - by Types
- 10.2.1. Steel
- 10.2.2. Aluminum
- 10.1. Market Analysis, Insights and Forecast - by Application
- 11. Competitive Analysis
- 11.1. Global Market Share Analysis 2025
- 11.2. Company Profiles
- 11.2.1 Ball Corporation
- 11.2.1.1. Overview
- 11.2.1.2. Products
- 11.2.1.3. SWOT Analysis
- 11.2.1.4. Recent Developments
- 11.2.1.5. Financials (Based on Availability)
- 11.2.2 Crown Holdings
- 11.2.2.1. Overview
- 11.2.2.2. Products
- 11.2.2.3. SWOT Analysis
- 11.2.2.4. Recent Developments
- 11.2.2.5. Financials (Based on Availability)
- 11.2.3 Ardagh group
- 11.2.3.1. Overview
- 11.2.3.2. Products
- 11.2.3.3. SWOT Analysis
- 11.2.3.4. Recent Developments
- 11.2.3.5. Financials (Based on Availability)
- 11.2.4 Toyo Seikan
- 11.2.4.1. Overview
- 11.2.4.2. Products
- 11.2.4.3. SWOT Analysis
- 11.2.4.4. Recent Developments
- 11.2.4.5. Financials (Based on Availability)
- 11.2.5 Can Pack Group
- 11.2.5.1. Overview
- 11.2.5.2. Products
- 11.2.5.3. SWOT Analysis
- 11.2.5.4. Recent Developments
- 11.2.5.5. Financials (Based on Availability)
- 11.2.6 Silgan Holdings Inc
- 11.2.6.1. Overview
- 11.2.6.2. Products
- 11.2.6.3. SWOT Analysis
- 11.2.6.4. Recent Developments
- 11.2.6.5. Financials (Based on Availability)
- 11.2.7 Daiwa Can Company
- 11.2.7.1. Overview
- 11.2.7.2. Products
- 11.2.7.3. SWOT Analysis
- 11.2.7.4. Recent Developments
- 11.2.7.5. Financials (Based on Availability)
- 11.2.8 Baosteel Packaging
- 11.2.8.1. Overview
- 11.2.8.2. Products
- 11.2.8.3. SWOT Analysis
- 11.2.8.4. Recent Developments
- 11.2.8.5. Financials (Based on Availability)
- 11.2.9 ORG Technology
- 11.2.9.1. Overview
- 11.2.9.2. Products
- 11.2.9.3. SWOT Analysis
- 11.2.9.4. Recent Developments
- 11.2.9.5. Financials (Based on Availability)
- 11.2.10 ShengXing Group
- 11.2.10.1. Overview
- 11.2.10.2. Products
- 11.2.10.3. SWOT Analysis
- 11.2.10.4. Recent Developments
- 11.2.10.5. Financials (Based on Availability)
- 11.2.11 CPMC Holdings
- 11.2.11.1. Overview
- 11.2.11.2. Products
- 11.2.11.3. SWOT Analysis
- 11.2.11.4. Recent Developments
- 11.2.11.5. Financials (Based on Availability)
- 11.2.12 Hokkan Holdings
- 11.2.12.1. Overview
- 11.2.12.2. Products
- 11.2.12.3. SWOT Analysis
- 11.2.12.4. Recent Developments
- 11.2.12.5. Financials (Based on Availability)
- 11.2.13 Showa Aluminum Can Corporation
- 11.2.13.1. Overview
- 11.2.13.2. Products
- 11.2.13.3. SWOT Analysis
- 11.2.13.4. Recent Developments
- 11.2.13.5. Financials (Based on Availability)
- 11.2.14 United Can (Great China Metal)
- 11.2.14.1. Overview
- 11.2.14.2. Products
- 11.2.14.3. SWOT Analysis
- 11.2.14.4. Recent Developments
- 11.2.14.5. Financials (Based on Availability)
- 11.2.15 Kingcan Holdings
- 11.2.15.1. Overview
- 11.2.15.2. Products
- 11.2.15.3. SWOT Analysis
- 11.2.15.4. Recent Developments
- 11.2.15.5. Financials (Based on Availability)
- 11.2.16 Jiamei Food Packaging
- 11.2.16.1. Overview
- 11.2.16.2. Products
- 11.2.16.3. SWOT Analysis
- 11.2.16.4. Recent Developments
- 11.2.16.5. Financials (Based on Availability)
- 11.2.17 Jiyuan Packaging Holdings
- 11.2.17.1. Overview
- 11.2.17.2. Products
- 11.2.17.3. SWOT Analysis
- 11.2.17.4. Recent Developments
- 11.2.17.5. Financials (Based on Availability)
- 11.2.1 Ball Corporation
List of Figures
- Figure 1: Global Metal Beverage Cans Revenue Breakdown (million, %) by Region 2025 & 2033
- Figure 2: North America Metal Beverage Cans Revenue (million), by Application 2025 & 2033
- Figure 3: North America Metal Beverage Cans Revenue Share (%), by Application 2025 & 2033
- Figure 4: North America Metal Beverage Cans Revenue (million), by Types 2025 & 2033
- Figure 5: North America Metal Beverage Cans Revenue Share (%), by Types 2025 & 2033
- Figure 6: North America Metal Beverage Cans Revenue (million), by Country 2025 & 2033
- Figure 7: North America Metal Beverage Cans Revenue Share (%), by Country 2025 & 2033
- Figure 8: South America Metal Beverage Cans Revenue (million), by Application 2025 & 2033
- Figure 9: South America Metal Beverage Cans Revenue Share (%), by Application 2025 & 2033
- Figure 10: South America Metal Beverage Cans Revenue (million), by Types 2025 & 2033
- Figure 11: South America Metal Beverage Cans Revenue Share (%), by Types 2025 & 2033
- Figure 12: South America Metal Beverage Cans Revenue (million), by Country 2025 & 2033
- Figure 13: South America Metal Beverage Cans Revenue Share (%), by Country 2025 & 2033
- Figure 14: Europe Metal Beverage Cans Revenue (million), by Application 2025 & 2033
- Figure 15: Europe Metal Beverage Cans Revenue Share (%), by Application 2025 & 2033
- Figure 16: Europe Metal Beverage Cans Revenue (million), by Types 2025 & 2033
- Figure 17: Europe Metal Beverage Cans Revenue Share (%), by Types 2025 & 2033
- Figure 18: Europe Metal Beverage Cans Revenue (million), by Country 2025 & 2033
- Figure 19: Europe Metal Beverage Cans Revenue Share (%), by Country 2025 & 2033
- Figure 20: Middle East & Africa Metal Beverage Cans Revenue (million), by Application 2025 & 2033
- Figure 21: Middle East & Africa Metal Beverage Cans Revenue Share (%), by Application 2025 & 2033
- Figure 22: Middle East & Africa Metal Beverage Cans Revenue (million), by Types 2025 & 2033
- Figure 23: Middle East & Africa Metal Beverage Cans Revenue Share (%), by Types 2025 & 2033
- Figure 24: Middle East & Africa Metal Beverage Cans Revenue (million), by Country 2025 & 2033
- Figure 25: Middle East & Africa Metal Beverage Cans Revenue Share (%), by Country 2025 & 2033
- Figure 26: Asia Pacific Metal Beverage Cans Revenue (million), by Application 2025 & 2033
- Figure 27: Asia Pacific Metal Beverage Cans Revenue Share (%), by Application 2025 & 2033
- Figure 28: Asia Pacific Metal Beverage Cans Revenue (million), by Types 2025 & 2033
- Figure 29: Asia Pacific Metal Beverage Cans Revenue Share (%), by Types 2025 & 2033
- Figure 30: Asia Pacific Metal Beverage Cans Revenue (million), by Country 2025 & 2033
- Figure 31: Asia Pacific Metal Beverage Cans Revenue Share (%), by Country 2025 & 2033
List of Tables
- Table 1: Global Metal Beverage Cans Revenue million Forecast, by Application 2020 & 2033
- Table 2: Global Metal Beverage Cans Revenue million Forecast, by Types 2020 & 2033
- Table 3: Global Metal Beverage Cans Revenue million Forecast, by Region 2020 & 2033
- Table 4: Global Metal Beverage Cans Revenue million Forecast, by Application 2020 & 2033
- Table 5: Global Metal Beverage Cans Revenue million Forecast, by Types 2020 & 2033
- Table 6: Global Metal Beverage Cans Revenue million Forecast, by Country 2020 & 2033
- Table 7: United States Metal Beverage Cans Revenue (million) Forecast, by Application 2020 & 2033
- Table 8: Canada Metal Beverage Cans Revenue (million) Forecast, by Application 2020 & 2033
- Table 9: Mexico Metal Beverage Cans Revenue (million) Forecast, by Application 2020 & 2033
- Table 10: Global Metal Beverage Cans Revenue million Forecast, by Application 2020 & 2033
- Table 11: Global Metal Beverage Cans Revenue million Forecast, by Types 2020 & 2033
- Table 12: Global Metal Beverage Cans Revenue million Forecast, by Country 2020 & 2033
- Table 13: Brazil Metal Beverage Cans Revenue (million) Forecast, by Application 2020 & 2033
- Table 14: Argentina Metal Beverage Cans Revenue (million) Forecast, by Application 2020 & 2033
- Table 15: Rest of South America Metal Beverage Cans Revenue (million) Forecast, by Application 2020 & 2033
- Table 16: Global Metal Beverage Cans Revenue million Forecast, by Application 2020 & 2033
- Table 17: Global Metal Beverage Cans Revenue million Forecast, by Types 2020 & 2033
- Table 18: Global Metal Beverage Cans Revenue million Forecast, by Country 2020 & 2033
- Table 19: United Kingdom Metal Beverage Cans Revenue (million) Forecast, by Application 2020 & 2033
- Table 20: Germany Metal Beverage Cans Revenue (million) Forecast, by Application 2020 & 2033
- Table 21: France Metal Beverage Cans Revenue (million) Forecast, by Application 2020 & 2033
- Table 22: Italy Metal Beverage Cans Revenue (million) Forecast, by Application 2020 & 2033
- Table 23: Spain Metal Beverage Cans Revenue (million) Forecast, by Application 2020 & 2033
- Table 24: Russia Metal Beverage Cans Revenue (million) Forecast, by Application 2020 & 2033
- Table 25: Benelux Metal Beverage Cans Revenue (million) Forecast, by Application 2020 & 2033
- Table 26: Nordics Metal Beverage Cans Revenue (million) Forecast, by Application 2020 & 2033
- Table 27: Rest of Europe Metal Beverage Cans Revenue (million) Forecast, by Application 2020 & 2033
- Table 28: Global Metal Beverage Cans Revenue million Forecast, by Application 2020 & 2033
- Table 29: Global Metal Beverage Cans Revenue million Forecast, by Types 2020 & 2033
- Table 30: Global Metal Beverage Cans Revenue million Forecast, by Country 2020 & 2033
- Table 31: Turkey Metal Beverage Cans Revenue (million) Forecast, by Application 2020 & 2033
- Table 32: Israel Metal Beverage Cans Revenue (million) Forecast, by Application 2020 & 2033
- Table 33: GCC Metal Beverage Cans Revenue (million) Forecast, by Application 2020 & 2033
- Table 34: North Africa Metal Beverage Cans Revenue (million) Forecast, by Application 2020 & 2033
- Table 35: South Africa Metal Beverage Cans Revenue (million) Forecast, by Application 2020 & 2033
- Table 36: Rest of Middle East & Africa Metal Beverage Cans Revenue (million) Forecast, by Application 2020 & 2033
- Table 37: Global Metal Beverage Cans Revenue million Forecast, by Application 2020 & 2033
- Table 38: Global Metal Beverage Cans Revenue million Forecast, by Types 2020 & 2033
- Table 39: Global Metal Beverage Cans Revenue million Forecast, by Country 2020 & 2033
- Table 40: China Metal Beverage Cans Revenue (million) Forecast, by Application 2020 & 2033
- Table 41: India Metal Beverage Cans Revenue (million) Forecast, by Application 2020 & 2033
- Table 42: Japan Metal Beverage Cans Revenue (million) Forecast, by Application 2020 & 2033
- Table 43: South Korea Metal Beverage Cans Revenue (million) Forecast, by Application 2020 & 2033
- Table 44: ASEAN Metal Beverage Cans Revenue (million) Forecast, by Application 2020 & 2033
- Table 45: Oceania Metal Beverage Cans Revenue (million) Forecast, by Application 2020 & 2033
- Table 46: Rest of Asia Pacific Metal Beverage Cans Revenue (million) Forecast, by Application 2020 & 2033
Frequently Asked Questions
1. What is the projected Compound Annual Growth Rate (CAGR) of the Metal Beverage Cans?
The projected CAGR is approximately 2.8%.
2. Which companies are prominent players in the Metal Beverage Cans?
Key companies in the market include Ball Corporation, Crown Holdings, Ardagh group, Toyo Seikan, Can Pack Group, Silgan Holdings Inc, Daiwa Can Company, Baosteel Packaging, ORG Technology, ShengXing Group, CPMC Holdings, Hokkan Holdings, Showa Aluminum Can Corporation, United Can (Great China Metal), Kingcan Holdings, Jiamei Food Packaging, Jiyuan Packaging Holdings.
3. What are the main segments of the Metal Beverage Cans?
The market segments include Application, Types.
4. Can you provide details about the market size?
The market size is estimated to be USD 52230 million as of 2022.
5. What are some drivers contributing to market growth?
N/A
6. What are the notable trends driving market growth?
N/A
7. Are there any restraints impacting market growth?
N/A
8. Can you provide examples of recent developments in the market?
N/A
9. What pricing options are available for accessing the report?
Pricing options include single-user, multi-user, and enterprise licenses priced at USD 4900.00, USD 7350.00, and USD 9800.00 respectively.
10. Is the market size provided in terms of value or volume?
The market size is provided in terms of value, measured in million.
11. Are there any specific market keywords associated with the report?
Yes, the market keyword associated with the report is "Metal Beverage Cans," which aids in identifying and referencing the specific market segment covered.
12. How do I determine which pricing option suits my needs best?
The pricing options vary based on user requirements and access needs. Individual users may opt for single-user licenses, while businesses requiring broader access may choose multi-user or enterprise licenses for cost-effective access to the report.
13. Are there any additional resources or data provided in the Metal Beverage Cans report?
While the report offers comprehensive insights, it's advisable to review the specific contents or supplementary materials provided to ascertain if additional resources or data are available.
14. How can I stay updated on further developments or reports in the Metal Beverage Cans?
To stay informed about further developments, trends, and reports in the Metal Beverage Cans, consider subscribing to industry newsletters, following relevant companies and organizations, or regularly checking reputable industry news sources and publications.
Methodology
Step 1 - Identification of Relevant Samples Size from Population Database


Step 2 - Approaches for Defining Global Market Size (Value, Volume* & Price*)

Note*: In applicable scenarios
Step 3 - Data Sources
Primary Research
- Web Analytics
- Survey Reports
- Research Institute
- Latest Research Reports
- Opinion Leaders
Secondary Research
- Annual Reports
- White Paper
- Latest Press Release
- Industry Association
- Paid Database
- Investor Presentations

Step 4 - Data Triangulation
Involves using different sources of information in order to increase the validity of a study
These sources are likely to be stakeholders in a program - participants, other researchers, program staff, other community members, and so on.
Then we put all data in single framework & apply various statistical tools to find out the dynamic on the market.
During the analysis stage, feedback from the stakeholder groups would be compared to determine areas of agreement as well as areas of divergence