

Key Insights
The microchannel heat exchanger (MHE) market is experiencing robust growth, projected to reach \$18.08 billion in 2025 and maintain a Compound Annual Growth Rate (CAGR) of 9.34% from 2025 to 2033. This expansion is driven by several key factors. Firstly, increasing demand from energy-intensive industries such as oil and gas, and power generation, fuels the need for efficient heat transfer solutions. MHEs, with their high surface area-to-volume ratios, offer superior heat transfer performance compared to conventional heat exchangers, leading to energy savings and reduced operational costs. Secondly, the growing adoption of MHEs in the chemical and food and beverage sectors, where precise temperature control is crucial, contributes significantly to market growth. Furthermore, technological advancements, such as the development of innovative materials and manufacturing processes, are enhancing the efficiency and durability of MHEs, further expanding their applications. Finally, stringent environmental regulations promoting energy efficiency are creating a favorable regulatory landscape for MHE adoption. The market is segmented by construction type (shell and tube, plate frame, and others) and end-user industries, with the oil and gas, and power generation sectors currently dominating.
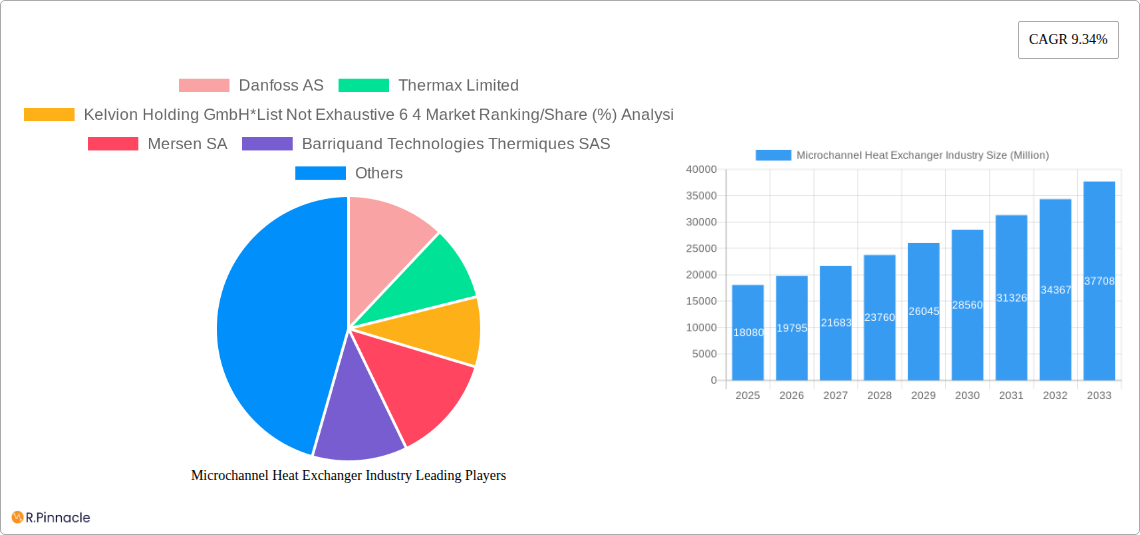
Microchannel Heat Exchanger Industry Market Size (In Billion)
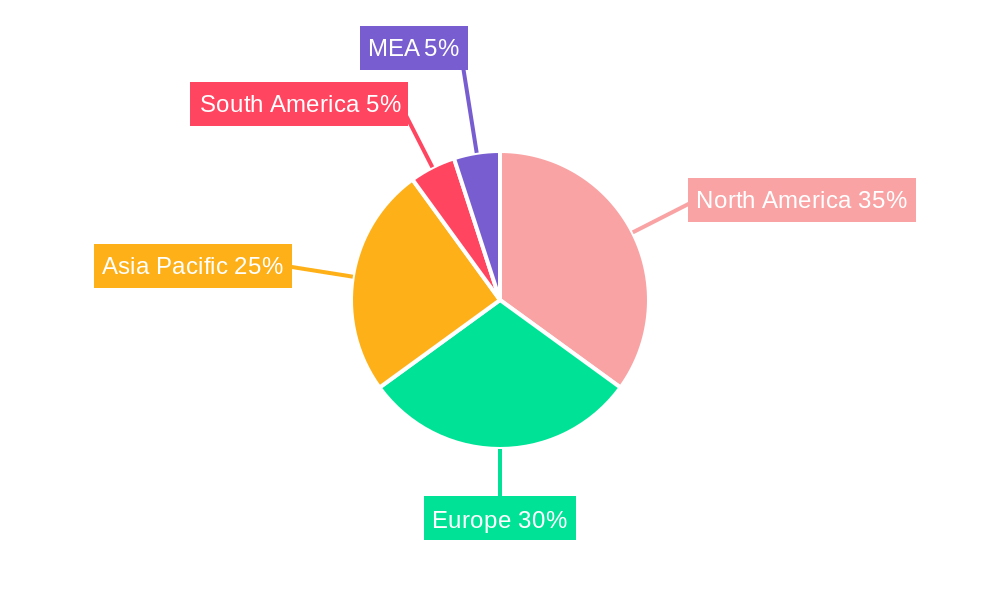
The geographical distribution of the MHE market reveals strong growth across North America, Europe, and Asia Pacific. North America benefits from a robust industrial base and substantial investments in energy infrastructure, while Europe is driven by stringent environmental regulations and a focus on sustainable technologies. Asia Pacific, particularly China and India, showcases significant growth potential due to rapid industrialization and expanding energy demands. While the shell and tube design remains prevalent, the plate frame segment is projected to witness faster growth due to its compact size, ease of maintenance, and cost-effectiveness. Competitive landscape analysis indicates that established players like Danfoss AS, Thermax Limited, Kelvion Holding GmbH, Mersen SA, and Alfa Laval AB are actively expanding their product portfolios and geographical reach to capitalize on market opportunities. The forecast period (2025-2033) anticipates continued growth, driven by increasing industrialization, rising energy costs, and technological improvements in MHE design and manufacturing.

Microchannel Heat Exchanger Industry Company Market Share
Microchannel Heat Exchanger Industry Report: 2019-2033
This comprehensive report provides a detailed analysis of the Microchannel Heat Exchanger industry, offering invaluable insights for industry professionals, investors, and strategic decision-makers. Covering the period 2019-2033, with a focus on 2025, this report unveils market dynamics, competitive landscapes, and future growth projections.
Microchannel Heat Exchanger Industry Market Structure & Innovation Trends
This section analyzes the competitive landscape of the microchannel heat exchanger market, encompassing market concentration, innovation drivers, regulatory frameworks, and key market activities. The market is moderately concentrated, with several key players holding significant market share. Analysis reveals a xx Million market size in 2025, expected to grow at a CAGR of xx% during the forecast period (2025-2033).
- Market Concentration: The top six players—Danfoss AS, Thermax Limited, Kelvion Holding GmbH, Mersen SA, Barriquand Technologies Thermiques SAS, and SPX Flow Inc—account for approximately xx% of the global market share in 2025. Further analysis shows Alfa Laval AB and General Electric Company each holding approximately xx% and Hisaka Works Ltd holding approximately xx%.
- Innovation Drivers: Stringent emission regulations, increasing demand for energy efficiency in various industries, and advancements in materials science are key drivers of innovation.
- Regulatory Frameworks: Government regulations promoting energy efficiency and reduced carbon emissions are significantly influencing market growth.
- Product Substitutes: While microchannel heat exchangers offer superior efficiency, competing technologies like traditional heat exchangers exist, although with lower performance.
- End-User Demographics: Key end-user segments include the Oil and Gas, Power Generation, Chemical, and Food and Beverage industries, with the Oil and Gas sector currently leading in market adoption. The xx Million value of the Oil and Gas segment is projected to see an increase in the next few years.
- M&A Activities: The industry has witnessed several mergers and acquisitions in recent years, primarily focused on enhancing product portfolios and expanding geographical reach. Total M&A deal value in the past five years is estimated at xx Million.
Microchannel Heat Exchanger Industry Market Dynamics & Trends
This section delves into the key market dynamics shaping the microchannel heat exchanger industry's trajectory. Market growth is driven by the rising demand for energy-efficient solutions across various sectors, fueled by stringent environmental regulations and the increasing adoption of renewable energy sources. Technological advancements, such as the development of innovative materials and enhanced manufacturing techniques, are further contributing to market expansion. Consumer preference for sustainable and cost-effective technologies is bolstering growth. The competitive landscape remains dynamic, with companies focused on product innovation, strategic partnerships, and geographic expansion. The market is projected to reach xx Million by 2033, exhibiting a robust CAGR of xx% from 2025 to 2033. Market penetration is steadily increasing across various end-user segments, particularly in developing economies experiencing rapid industrialization.
Dominant Regions & Segments in Microchannel Heat Exchanger Industry
This section identifies the leading regions and segments within the microchannel heat exchanger market.
Leading Region: North America currently holds the largest market share, driven by strong demand from the oil and gas, and power generation sectors. This is supported by robust economic growth, stringent environmental regulations, and significant investments in infrastructure projects. Europe is a strong second-place market, while the Asia-Pacific region is projected for the fastest growth.
Dominant Construction Type: Shell and tube heat exchangers currently hold the largest market share due to their established reliability and suitability for high-pressure and high-temperature applications. However, plate frame heat exchangers are gaining traction owing to their compactness and high efficiency.
Leading End-User: The Oil and Gas industry is the largest end-user segment, followed by the Power Generation sector. This is attributable to the growing need for efficient heat transfer in energy production and processing. The chemical industry is also experiencing significant growth.
Key Drivers:
- Economic Policies: Government incentives and subsidies for energy-efficient technologies are boosting market growth.
- Infrastructure Development: Expansion of industrial and energy infrastructure projects fuels demand.
- Technological Advancements: Continuous improvements in materials science and manufacturing techniques are leading to more efficient and cost-effective products.
Microchannel Heat Exchanger Industry Product Innovations
Recent advancements in microchannel heat exchanger technology have resulted in improved efficiency, durability, and cost-effectiveness. Manufacturers are focusing on developing compact designs, utilizing advanced materials like high-performance alloys and polymers, and integrating smart sensors for enhanced performance monitoring. These innovations cater to the increasing demand for energy efficiency and reduced operational costs across various applications, including fuel cell systems (Alfa Laval's AlfaNova GL50) and space heating/cooling (PV-powered earth-to-air heat exchangers). The introduction of products like SPX FLOW's FastFrame plate heat exchanger highlights the ongoing focus on improved usability and durability for end users.
Report Scope & Segmentation Analysis
This report segments the microchannel heat exchanger market based on construction type and end-user.
Construction Type:
- Shell and Tube: This segment is expected to maintain its dominance due to its versatility and reliability in handling high pressures and temperatures. Market size in 2025 is estimated at xx Million, with projected growth at xx% CAGR.
- Plate Frame: This segment is experiencing rapid growth due to its high efficiency and compact design. Market size in 2025 is estimated at xx Million, with projected growth at xx% CAGR.
- Other Construction Types: This segment includes various specialized designs catering to niche applications. Market size in 2025 is estimated at xx Million, with projected growth at xx% CAGR.
End-User:
- Oil and Gas Industry: This segment is the largest, driven by the industry's need for efficient heat transfer in various processes. Market size in 2025 is estimated at xx Million, with projected growth at xx% CAGR.
- Power Generation: This segment is experiencing significant growth due to the increasing adoption of renewable energy sources and the need for efficient power generation. Market size in 2025 is estimated at xx Million, with projected growth at xx% CAGR.
- Chemical: The chemical industry's demand for heat exchange in various chemical processes drives growth. Market size in 2025 is estimated at xx Million, with projected growth at xx% CAGR.
- Food and Beverages: This segment's demand is driven by the need for efficient and hygienic heat transfer in processing. Market size in 2025 is estimated at xx Million, with projected growth at xx% CAGR.
- Other End Users: This segment comprises various industries with specific heat transfer requirements. Market size in 2025 is estimated at xx Million, with projected growth at xx% CAGR.
Key Drivers of Microchannel Heat Exchanger Industry Growth
The growth of the microchannel heat exchanger industry is propelled by several key factors:
- Increasing Demand for Energy Efficiency: Growing environmental concerns and rising energy costs are driving demand for efficient heat transfer solutions.
- Stringent Environmental Regulations: Government regulations promoting energy conservation and emission reduction are encouraging the adoption of energy-efficient technologies.
- Technological Advancements: Continuous innovations in materials science and manufacturing techniques are leading to improved performance and cost-effectiveness.
- Expansion of Renewable Energy: The increasing adoption of renewable energy sources is fueling demand for efficient heat transfer systems.
Challenges in the Microchannel Heat Exchanger Industry Sector
The microchannel heat exchanger industry faces several challenges:
- High Initial Investment Costs: The relatively high upfront investment for microchannel heat exchangers can deter some potential adopters.
- Complex Manufacturing Processes: The intricate design and manufacturing processes of microchannel heat exchangers can lead to higher production costs.
- Potential for Fouling and Cleaning Difficulties: The compact design can make cleaning and maintenance challenging.
- Supply Chain Disruptions: Global supply chain disruptions can impact material availability and manufacturing processes.
Emerging Opportunities in Microchannel Heat Exchanger Industry
Emerging opportunities include:
- Growth in Developing Economies: Rapid industrialization in developing countries is creating significant market potential.
- Advancements in Materials Science: The development of new materials with enhanced thermal properties is opening up new possibilities for performance improvement.
- Integration with Smart Technologies: Integrating smart sensors and controls to optimize performance and reduce energy consumption is a growing area.
- Expansion into Niche Applications: Exploring new applications in sectors like aerospace, electronics cooling, and waste heat recovery presents significant opportunities.
Leading Players in the Microchannel Heat Exchanger Industry Market
- Danfoss AS
- Thermax Limited
- Kelvion Holding GmbH
- Mersen SA
- Barriquand Technologies Thermiques SAS
- SPX Flow Inc
- General Electric Company
- Hisaka Works Ltd
- Alfa Laval AB
Key Developments in Microchannel Heat Exchanger Industry Industry
- September 2023: APV (SPX FLOW) launched the FastFrame plate heat exchanger, improving usability and durability for food and beverage operators.
- April 2023: Researchers in India developed a PV-powered earth-to-air heat exchanger for building heating and cooling, potentially generating 8116.7 kWh annual energy gain.
- March 2023: Alfa Laval launched AlfaNova GL50, the first heat exchanger specifically designed for fuel cell systems.
Future Outlook for Microchannel Heat Exchanger Industry Market
The microchannel heat exchanger market is poised for significant growth over the next decade. Driven by increasing demand for energy efficiency, stringent environmental regulations, and technological advancements, the market is expected to witness robust expansion across various end-user sectors and geographical regions. Strategic investments in research and development, strategic partnerships, and expansion into emerging markets will be key factors in shaping the future competitive landscape. The focus on sustainability and reduced carbon footprint will further accelerate market growth.
Microchannel Heat Exchanger Industry Segmentation
-
1. Construction Type
- 1.1. Shell and Tube
- 1.2. Plate Frame
- 1.3. Other Construction Types
-
2. End User
- 2.1. Oil and Gas Industry
- 2.2. Power Generation
- 2.3. Chemical
- 2.4. Food and Beverages
- 2.5. Other End Users
Microchannel Heat Exchanger Industry Segmentation By Geography
-
1. North America
- 1.1. United States
- 1.2. Canada
- 1.3. Mexico
- 1.4. Rest of North America
-
2. Europe
- 2.1. United Kingdom
- 2.2. Germany
- 2.3. France
- 2.4. Russia
- 2.5. NORDIC
- 2.6. Italy
- 2.7. Spain
- 2.8. Rest of Europe
-
3. Asia Pacific
- 3.1. India
- 3.2. China
- 3.3. Japan
- 3.4. Australia
- 3.5. Thailand
- 3.6. Indonesia
- 3.7. Malaysia
- 3.8. Rest of Asia Pacific
-
4. South America
- 4.1. Brazil
- 4.2. Argentina
- 4.3. Colombia
- 4.4. Rest of South America
-
5. Middle East and Africa
- 5.1. United Arab Emirates
- 5.2. Saudi Arabia
- 5.3. Qatar
- 5.4. Nigeria
- 5.5. South Africa
- 5.6. Egypt
- 5.7. Rest of the Middle East and Africa
Microchannel Heat Exchanger Industry Regional Market Share
Geographic Coverage of Microchannel Heat Exchanger Industry
Microchannel Heat Exchanger Industry REPORT HIGHLIGHTS
| Aspects | Details |
|---|---|
| Study Period | 2020-2034 |
| Base Year | 2025 |
| Estimated Year | 2026 |
| Forecast Period | 2026-2034 |
| Historical Period | 2020-2025 |
| Growth Rate | CAGR of 9.34% from 2020-2034 |
| Segmentation |
|
Table of Contents
- 1. Introduction
- 1.1. Research Scope
- 1.2. Market Segmentation
- 1.3. Research Objective
- 1.4. Definitions and Assumptions
- 2. Executive Summary
- 2.1. Market Snapshot
- 3. Market Dynamics
- 3.1. Market Drivers
- 3.2. Market Restrains
- 3.3. Market Trends
- 3.4. Market Opportunities
- 4. Market Factor Analysis
- 4.1. Porters Five Forces
- 4.1.1. Bargaining Power of Suppliers
- 4.1.2. Bargaining Power of Buyers
- 4.1.3. Threat of New Entrants
- 4.1.4. Threat of Substitutes
- 4.1.5. Competitive Rivalry
- 4.2. PESTEL analysis
- 4.3. BCG Analysis
- 4.3.1. Stars (High Growth, High Market Share)
- 4.3.2. Cash Cows (Low Growth, High Market Share)
- 4.3.3. Question Mark (High Growth, Low Market Share)
- 4.3.4. Dogs (Low Growth, Low Market Share)
- 4.4. Ansoff Matrix Analysis
- 4.5. Supply Chain Analysis
- 4.6. Regulatory Landscape
- 4.7. Current Market Potential and Opportunity Assessment (TAM–SAM–SOM Framework)
- 4.8. PRI Analyst Note
- 4.1. Porters Five Forces
- 5. Market Analysis, Insights and Forecast 2021-2033
- 5.1. Market Analysis, Insights and Forecast - by Construction Type
- 5.1.1. Shell and Tube
- 5.1.2. Plate Frame
- 5.1.3. Other Construction Types
- 5.2. Market Analysis, Insights and Forecast - by End User
- 5.2.1. Oil and Gas Industry
- 5.2.2. Power Generation
- 5.2.3. Chemical
- 5.2.4. Food and Beverages
- 5.2.5. Other End Users
- 5.3. Market Analysis, Insights and Forecast - by Region
- 5.3.1. North America
- 5.3.2. Europe
- 5.3.3. Asia Pacific
- 5.3.4. South America
- 5.3.5. Middle East and Africa
- 5.1. Market Analysis, Insights and Forecast - by Construction Type
- 6. Global Microchannel Heat Exchanger Industry Analysis, Insights and Forecast, 2021-2033
- 6.1. Market Analysis, Insights and Forecast - by Construction Type
- 6.1.1. Shell and Tube
- 6.1.2. Plate Frame
- 6.1.3. Other Construction Types
- 6.2. Market Analysis, Insights and Forecast - by End User
- 6.2.1. Oil and Gas Industry
- 6.2.2. Power Generation
- 6.2.3. Chemical
- 6.2.4. Food and Beverages
- 6.2.5. Other End Users
- 6.1. Market Analysis, Insights and Forecast - by Construction Type
- 7. North America Microchannel Heat Exchanger Industry Analysis, Insights and Forecast, 2020-2032
- 7.1. Market Analysis, Insights and Forecast - by Construction Type
- 7.1.1. Shell and Tube
- 7.1.2. Plate Frame
- 7.1.3. Other Construction Types
- 7.2. Market Analysis, Insights and Forecast - by End User
- 7.2.1. Oil and Gas Industry
- 7.2.2. Power Generation
- 7.2.3. Chemical
- 7.2.4. Food and Beverages
- 7.2.5. Other End Users
- 7.1. Market Analysis, Insights and Forecast - by Construction Type
- 8. Europe Microchannel Heat Exchanger Industry Analysis, Insights and Forecast, 2020-2032
- 8.1. Market Analysis, Insights and Forecast - by Construction Type
- 8.1.1. Shell and Tube
- 8.1.2. Plate Frame
- 8.1.3. Other Construction Types
- 8.2. Market Analysis, Insights and Forecast - by End User
- 8.2.1. Oil and Gas Industry
- 8.2.2. Power Generation
- 8.2.3. Chemical
- 8.2.4. Food and Beverages
- 8.2.5. Other End Users
- 8.1. Market Analysis, Insights and Forecast - by Construction Type
- 9. Asia Pacific Microchannel Heat Exchanger Industry Analysis, Insights and Forecast, 2020-2032
- 9.1. Market Analysis, Insights and Forecast - by Construction Type
- 9.1.1. Shell and Tube
- 9.1.2. Plate Frame
- 9.1.3. Other Construction Types
- 9.2. Market Analysis, Insights and Forecast - by End User
- 9.2.1. Oil and Gas Industry
- 9.2.2. Power Generation
- 9.2.3. Chemical
- 9.2.4. Food and Beverages
- 9.2.5. Other End Users
- 9.1. Market Analysis, Insights and Forecast - by Construction Type
- 10. South America Microchannel Heat Exchanger Industry Analysis, Insights and Forecast, 2020-2032
- 10.1. Market Analysis, Insights and Forecast - by Construction Type
- 10.1.1. Shell and Tube
- 10.1.2. Plate Frame
- 10.1.3. Other Construction Types
- 10.2. Market Analysis, Insights and Forecast - by End User
- 10.2.1. Oil and Gas Industry
- 10.2.2. Power Generation
- 10.2.3. Chemical
- 10.2.4. Food and Beverages
- 10.2.5. Other End Users
- 10.1. Market Analysis, Insights and Forecast - by Construction Type
- 11. Middle East and Africa Microchannel Heat Exchanger Industry Analysis, Insights and Forecast, 2020-2032
- 11.1. Market Analysis, Insights and Forecast - by Construction Type
- 11.1.1. Shell and Tube
- 11.1.2. Plate Frame
- 11.1.3. Other Construction Types
- 11.2. Market Analysis, Insights and Forecast - by End User
- 11.2.1. Oil and Gas Industry
- 11.2.2. Power Generation
- 11.2.3. Chemical
- 11.2.4. Food and Beverages
- 11.2.5. Other End Users
- 11.1. Market Analysis, Insights and Forecast - by Construction Type
- 12. Competitive Analysis
- 12.1. Company Profiles
- 12.1.1 Danfoss AS
- 12.1.1.1. Company Overview
- 12.1.1.2. Products
- 12.1.1.3. Company Financials
- 12.1.1.4. SWOT Analysis
- 12.1.2 Thermax Limited
- 12.1.2.1. Company Overview
- 12.1.2.2. Products
- 12.1.2.3. Company Financials
- 12.1.2.4. SWOT Analysis
- 12.1.3 Kelvion Holding GmbH*List Not Exhaustive 6 4 Market Ranking/Share (%) Analysi
- 12.1.3.1. Company Overview
- 12.1.3.2. Products
- 12.1.3.3. Company Financials
- 12.1.3.4. SWOT Analysis
- 12.1.4 Mersen SA
- 12.1.4.1. Company Overview
- 12.1.4.2. Products
- 12.1.4.3. Company Financials
- 12.1.4.4. SWOT Analysis
- 12.1.5 Barriquand Technologies Thermiques SAS
- 12.1.5.1. Company Overview
- 12.1.5.2. Products
- 12.1.5.3. Company Financials
- 12.1.5.4. SWOT Analysis
- 12.1.6 SPX Flow Inc
- 12.1.6.1. Company Overview
- 12.1.6.2. Products
- 12.1.6.3. Company Financials
- 12.1.6.4. SWOT Analysis
- 12.1.7 General Electric Company
- 12.1.7.1. Company Overview
- 12.1.7.2. Products
- 12.1.7.3. Company Financials
- 12.1.7.4. SWOT Analysis
- 12.1.8 Hisaka Works Ltd
- 12.1.8.1. Company Overview
- 12.1.8.2. Products
- 12.1.8.3. Company Financials
- 12.1.8.4. SWOT Analysis
- 12.1.9 Alfa Laval AB
- 12.1.9.1. Company Overview
- 12.1.9.2. Products
- 12.1.9.3. Company Financials
- 12.1.9.4. SWOT Analysis
- 12.1.1 Danfoss AS
- 12.2. Market Entropy
- 12.2.1 Company's Key Areas Served
- 12.2.2 Recent Developments
- 12.3. Company Market Share Analysis 2025
- 12.3.1 Top 5 Companies Market Share Analysis
- 12.3.2 Top 3 Companies Market Share Analysis
- 12.4. List of Potential Customers
- 13. Research Methodology
List of Figures
- Figure 1: Global Microchannel Heat Exchanger Industry Revenue Breakdown (Million, %) by Region 2025 & 2033
- Figure 2: North America Microchannel Heat Exchanger Industry Revenue (Million), by Construction Type 2025 & 2033
- Figure 3: North America Microchannel Heat Exchanger Industry Revenue Share (%), by Construction Type 2025 & 2033
- Figure 4: North America Microchannel Heat Exchanger Industry Revenue (Million), by End User 2025 & 2033
- Figure 5: North America Microchannel Heat Exchanger Industry Revenue Share (%), by End User 2025 & 2033
- Figure 6: North America Microchannel Heat Exchanger Industry Revenue (Million), by Country 2025 & 2033
- Figure 7: North America Microchannel Heat Exchanger Industry Revenue Share (%), by Country 2025 & 2033
- Figure 8: Europe Microchannel Heat Exchanger Industry Revenue (Million), by Construction Type 2025 & 2033
- Figure 9: Europe Microchannel Heat Exchanger Industry Revenue Share (%), by Construction Type 2025 & 2033
- Figure 10: Europe Microchannel Heat Exchanger Industry Revenue (Million), by End User 2025 & 2033
- Figure 11: Europe Microchannel Heat Exchanger Industry Revenue Share (%), by End User 2025 & 2033
- Figure 12: Europe Microchannel Heat Exchanger Industry Revenue (Million), by Country 2025 & 2033
- Figure 13: Europe Microchannel Heat Exchanger Industry Revenue Share (%), by Country 2025 & 2033
- Figure 14: Asia Pacific Microchannel Heat Exchanger Industry Revenue (Million), by Construction Type 2025 & 2033
- Figure 15: Asia Pacific Microchannel Heat Exchanger Industry Revenue Share (%), by Construction Type 2025 & 2033
- Figure 16: Asia Pacific Microchannel Heat Exchanger Industry Revenue (Million), by End User 2025 & 2033
- Figure 17: Asia Pacific Microchannel Heat Exchanger Industry Revenue Share (%), by End User 2025 & 2033
- Figure 18: Asia Pacific Microchannel Heat Exchanger Industry Revenue (Million), by Country 2025 & 2033
- Figure 19: Asia Pacific Microchannel Heat Exchanger Industry Revenue Share (%), by Country 2025 & 2033
- Figure 20: South America Microchannel Heat Exchanger Industry Revenue (Million), by Construction Type 2025 & 2033
- Figure 21: South America Microchannel Heat Exchanger Industry Revenue Share (%), by Construction Type 2025 & 2033
- Figure 22: South America Microchannel Heat Exchanger Industry Revenue (Million), by End User 2025 & 2033
- Figure 23: South America Microchannel Heat Exchanger Industry Revenue Share (%), by End User 2025 & 2033
- Figure 24: South America Microchannel Heat Exchanger Industry Revenue (Million), by Country 2025 & 2033
- Figure 25: South America Microchannel Heat Exchanger Industry Revenue Share (%), by Country 2025 & 2033
- Figure 26: Middle East and Africa Microchannel Heat Exchanger Industry Revenue (Million), by Construction Type 2025 & 2033
- Figure 27: Middle East and Africa Microchannel Heat Exchanger Industry Revenue Share (%), by Construction Type 2025 & 2033
- Figure 28: Middle East and Africa Microchannel Heat Exchanger Industry Revenue (Million), by End User 2025 & 2033
- Figure 29: Middle East and Africa Microchannel Heat Exchanger Industry Revenue Share (%), by End User 2025 & 2033
- Figure 30: Middle East and Africa Microchannel Heat Exchanger Industry Revenue (Million), by Country 2025 & 2033
- Figure 31: Middle East and Africa Microchannel Heat Exchanger Industry Revenue Share (%), by Country 2025 & 2033
List of Tables
- Table 1: Global Microchannel Heat Exchanger Industry Revenue Million Forecast, by Construction Type 2020 & 2033
- Table 2: Global Microchannel Heat Exchanger Industry Revenue Million Forecast, by End User 2020 & 2033
- Table 3: Global Microchannel Heat Exchanger Industry Revenue Million Forecast, by Region 2020 & 2033
- Table 4: Global Microchannel Heat Exchanger Industry Revenue Million Forecast, by Construction Type 2020 & 2033
- Table 5: Global Microchannel Heat Exchanger Industry Revenue Million Forecast, by End User 2020 & 2033
- Table 6: Global Microchannel Heat Exchanger Industry Revenue Million Forecast, by Country 2020 & 2033
- Table 7: United States Microchannel Heat Exchanger Industry Revenue (Million) Forecast, by Application 2020 & 2033
- Table 8: Canada Microchannel Heat Exchanger Industry Revenue (Million) Forecast, by Application 2020 & 2033
- Table 9: Mexico Microchannel Heat Exchanger Industry Revenue (Million) Forecast, by Application 2020 & 2033
- Table 10: Rest of North America Microchannel Heat Exchanger Industry Revenue (Million) Forecast, by Application 2020 & 2033
- Table 11: Global Microchannel Heat Exchanger Industry Revenue Million Forecast, by Construction Type 2020 & 2033
- Table 12: Global Microchannel Heat Exchanger Industry Revenue Million Forecast, by End User 2020 & 2033
- Table 13: Global Microchannel Heat Exchanger Industry Revenue Million Forecast, by Country 2020 & 2033
- Table 14: United Kingdom Microchannel Heat Exchanger Industry Revenue (Million) Forecast, by Application 2020 & 2033
- Table 15: Germany Microchannel Heat Exchanger Industry Revenue (Million) Forecast, by Application 2020 & 2033
- Table 16: France Microchannel Heat Exchanger Industry Revenue (Million) Forecast, by Application 2020 & 2033
- Table 17: Russia Microchannel Heat Exchanger Industry Revenue (Million) Forecast, by Application 2020 & 2033
- Table 18: NORDIC Microchannel Heat Exchanger Industry Revenue (Million) Forecast, by Application 2020 & 2033
- Table 19: Italy Microchannel Heat Exchanger Industry Revenue (Million) Forecast, by Application 2020 & 2033
- Table 20: Spain Microchannel Heat Exchanger Industry Revenue (Million) Forecast, by Application 2020 & 2033
- Table 21: Rest of Europe Microchannel Heat Exchanger Industry Revenue (Million) Forecast, by Application 2020 & 2033
- Table 22: Global Microchannel Heat Exchanger Industry Revenue Million Forecast, by Construction Type 2020 & 2033
- Table 23: Global Microchannel Heat Exchanger Industry Revenue Million Forecast, by End User 2020 & 2033
- Table 24: Global Microchannel Heat Exchanger Industry Revenue Million Forecast, by Country 2020 & 2033
- Table 25: India Microchannel Heat Exchanger Industry Revenue (Million) Forecast, by Application 2020 & 2033
- Table 26: China Microchannel Heat Exchanger Industry Revenue (Million) Forecast, by Application 2020 & 2033
- Table 27: Japan Microchannel Heat Exchanger Industry Revenue (Million) Forecast, by Application 2020 & 2033
- Table 28: Australia Microchannel Heat Exchanger Industry Revenue (Million) Forecast, by Application 2020 & 2033
- Table 29: Thailand Microchannel Heat Exchanger Industry Revenue (Million) Forecast, by Application 2020 & 2033
- Table 30: Indonesia Microchannel Heat Exchanger Industry Revenue (Million) Forecast, by Application 2020 & 2033
- Table 31: Malaysia Microchannel Heat Exchanger Industry Revenue (Million) Forecast, by Application 2020 & 2033
- Table 32: Rest of Asia Pacific Microchannel Heat Exchanger Industry Revenue (Million) Forecast, by Application 2020 & 2033
- Table 33: Global Microchannel Heat Exchanger Industry Revenue Million Forecast, by Construction Type 2020 & 2033
- Table 34: Global Microchannel Heat Exchanger Industry Revenue Million Forecast, by End User 2020 & 2033
- Table 35: Global Microchannel Heat Exchanger Industry Revenue Million Forecast, by Country 2020 & 2033
- Table 36: Brazil Microchannel Heat Exchanger Industry Revenue (Million) Forecast, by Application 2020 & 2033
- Table 37: Argentina Microchannel Heat Exchanger Industry Revenue (Million) Forecast, by Application 2020 & 2033
- Table 38: Colombia Microchannel Heat Exchanger Industry Revenue (Million) Forecast, by Application 2020 & 2033
- Table 39: Rest of South America Microchannel Heat Exchanger Industry Revenue (Million) Forecast, by Application 2020 & 2033
- Table 40: Global Microchannel Heat Exchanger Industry Revenue Million Forecast, by Construction Type 2020 & 2033
- Table 41: Global Microchannel Heat Exchanger Industry Revenue Million Forecast, by End User 2020 & 2033
- Table 42: Global Microchannel Heat Exchanger Industry Revenue Million Forecast, by Country 2020 & 2033
- Table 43: United Arab Emirates Microchannel Heat Exchanger Industry Revenue (Million) Forecast, by Application 2020 & 2033
- Table 44: Saudi Arabia Microchannel Heat Exchanger Industry Revenue (Million) Forecast, by Application 2020 & 2033
- Table 45: Qatar Microchannel Heat Exchanger Industry Revenue (Million) Forecast, by Application 2020 & 2033
- Table 46: Nigeria Microchannel Heat Exchanger Industry Revenue (Million) Forecast, by Application 2020 & 2033
- Table 47: South Africa Microchannel Heat Exchanger Industry Revenue (Million) Forecast, by Application 2020 & 2033
- Table 48: Egypt Microchannel Heat Exchanger Industry Revenue (Million) Forecast, by Application 2020 & 2033
- Table 49: Rest of the Middle East and Africa Microchannel Heat Exchanger Industry Revenue (Million) Forecast, by Application 2020 & 2033
Frequently Asked Questions
1. What is the projected Compound Annual Growth Rate (CAGR) of the Microchannel Heat Exchanger Industry?
The projected CAGR is approximately 9.34%.
2. Which companies are prominent players in the Microchannel Heat Exchanger Industry?
Key companies in the market include Danfoss AS, Thermax Limited, Kelvion Holding GmbH*List Not Exhaustive 6 4 Market Ranking/Share (%) Analysi, Mersen SA, Barriquand Technologies Thermiques SAS, SPX Flow Inc, General Electric Company, Hisaka Works Ltd, Alfa Laval AB.
3. What are the main segments of the Microchannel Heat Exchanger Industry?
The market segments include Construction Type, End User.
4. Can you provide details about the market size?
The market size is estimated to be USD 18.08 Million as of 2022.
5. What are some drivers contributing to market growth?
4.; Increasing Industrialization across the World4.; Expansion and Development of New Power Plants.
6. What are the notable trends driving market growth?
Power Generation Expected to Dominate the Market.
7. Are there any restraints impacting market growth?
4.; Increasing Adoption of Renewable Energy.
8. Can you provide examples of recent developments in the market?
September 2023: APV, a part of SPX FLOW’s suite of process solutions, introduced the new Plate Heat Exchanger FastFrame. The product has improved usability and durability, which is expected to save time and money for food and beverage operators.
9. What pricing options are available for accessing the report?
Pricing options include single-user, multi-user, and enterprise licenses priced at USD 4750, USD 5250, and USD 8750 respectively.
10. Is the market size provided in terms of value or volume?
The market size is provided in terms of value, measured in Million.
11. Are there any specific market keywords associated with the report?
Yes, the market keyword associated with the report is "Microchannel Heat Exchanger Industry," which aids in identifying and referencing the specific market segment covered.
12. How do I determine which pricing option suits my needs best?
The pricing options vary based on user requirements and access needs. Individual users may opt for single-user licenses, while businesses requiring broader access may choose multi-user or enterprise licenses for cost-effective access to the report.
13. Are there any additional resources or data provided in the Microchannel Heat Exchanger Industry report?
While the report offers comprehensive insights, it's advisable to review the specific contents or supplementary materials provided to ascertain if additional resources or data are available.
14. How can I stay updated on further developments or reports in the Microchannel Heat Exchanger Industry?
To stay informed about further developments, trends, and reports in the Microchannel Heat Exchanger Industry, consider subscribing to industry newsletters, following relevant companies and organizations, or regularly checking reputable industry news sources and publications.
Methodology
Step 1 - Identification of Relevant Samples Size from Population Database


Step 2 - Approaches for Defining Global Market Size (Value, Volume* & Price*)

Note*: In applicable scenarios
Step 3 - Data Sources
Primary Research
- Web Analytics
- Survey Reports
- Research Institute
- Latest Research Reports
- Opinion Leaders
Secondary Research
- Annual Reports
- White Paper
- Latest Press Release
- Industry Association
- Paid Database
- Investor Presentations

Step 4 - Data Triangulation
Involves using different sources of information in order to increase the validity of a study
These sources are likely to be stakeholders in a program - participants, other researchers, program staff, other community members, and so on.
Then we put all data in single framework & apply various statistical tools to find out the dynamic on the market.
During the analysis stage, feedback from the stakeholder groups would be compared to determine areas of agreement as well as areas of divergence