

Key Insights
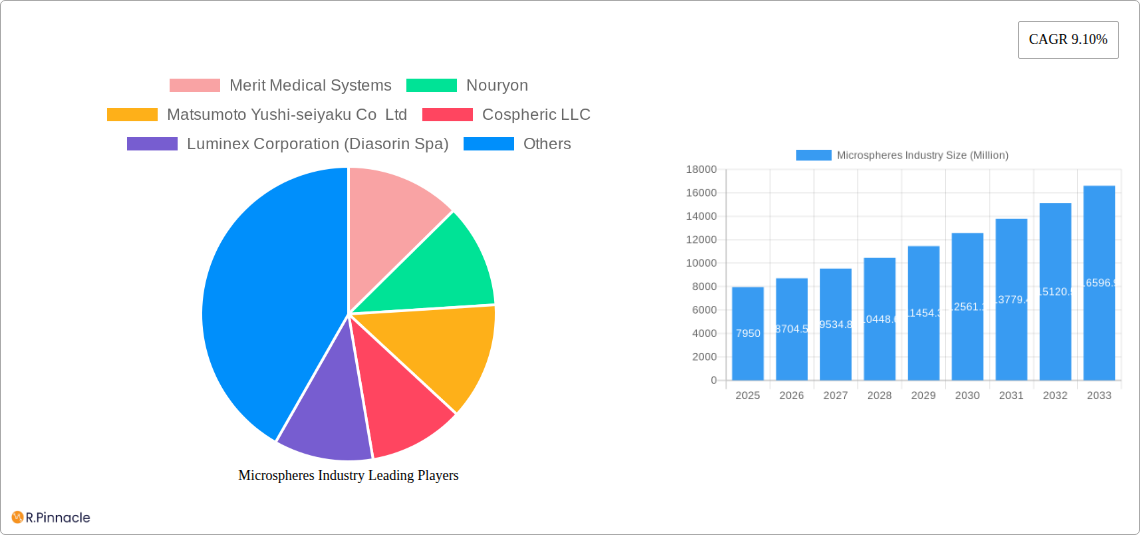
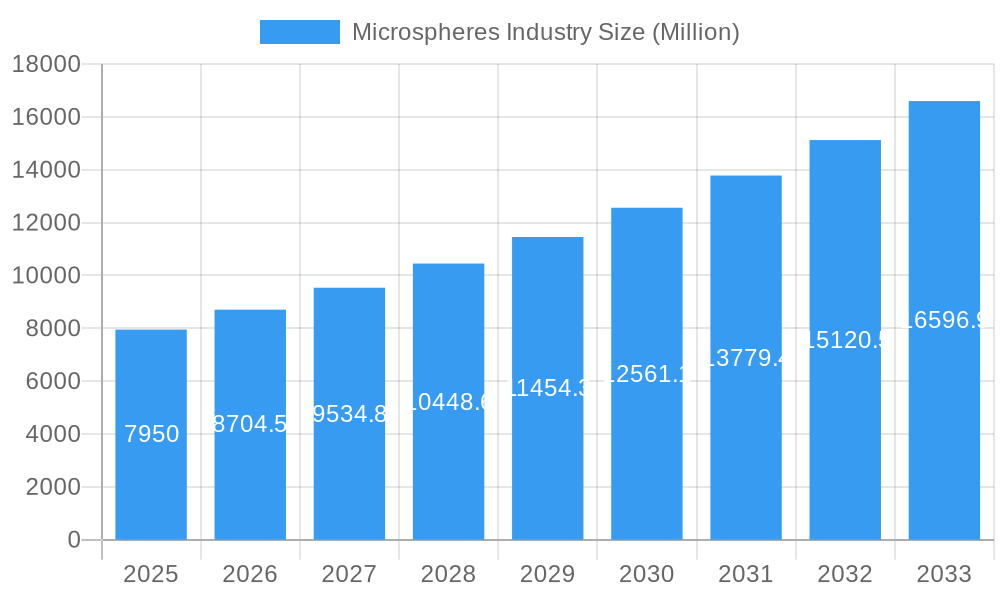
The global microspheres market, valued at $7.95 billion in 2025, is projected to experience robust growth, driven by increasing demand across diverse sectors. A compound annual growth rate (CAGR) of 9.10% from 2025 to 2033 signifies significant expansion potential. Key drivers include the rising adoption of microspheres in advanced drug delivery systems within the medical technology sector, the expanding automotive and aerospace industries requiring lightweight and high-performance materials, and increasing applications in paints and coatings for enhanced durability and functionality. Technological advancements in microsphere manufacturing, leading to improved control over size, shape, and surface properties, are further fueling market growth. Growth is also stimulated by the expanding cosmetics industry's use of microspheres for unique textures and controlled release of active ingredients. While specific restraints aren't detailed, potential challenges could include price fluctuations in raw materials (glass, polymers, ceramics, etc.), stringent regulatory approvals in certain industries (like pharmaceuticals), and the need for continuous innovation to meet evolving application demands. The market's segmentation by raw material, type (hollow, solid), and application reflects the diverse nature of its end-uses, with each segment showing distinct growth trajectories influenced by specific technological and market trends. The presence of major players like 3M, Siemens Healthineers, and others underlines the market's maturity and competitiveness. The Asia-Pacific region, particularly China and India, is anticipated to be a significant growth driver due to expanding industrialization and increasing investments in advanced technologies.
Microspheres Industry Market Size (In Billion)
The substantial growth forecast highlights opportunities for existing players to expand their market share through strategic partnerships, acquisitions, and product innovations. Furthermore, the market is ripe for new entrants with innovative microsphere technologies and applications. However, success requires a deep understanding of specific end-user needs and the ability to meet the demanding quality standards and regulatory requirements in various sectors. Effective supply chain management and cost-effective production methods will also play a crucial role in maximizing profitability. Geographical expansion into emerging markets and collaborations with research institutions to develop next-generation microsphere technologies can offer significant competitive advantages in this rapidly expanding market.
Microspheres Industry Company Market Share
Microspheres Industry Market Report: 2019-2033
This comprehensive report provides a detailed analysis of the global microspheres market, offering actionable insights for industry professionals and investors. The study period covers 2019-2033, with a base year of 2025 and a forecast period of 2025-2033. The report segments the market by raw material (glass, polymer, ceramic, fly ash, metallic, other), type (hollow, solid), and application (automotive, aerospace, cosmetics, oil and gas, paints and coatings, medical technology, composites, other), providing a granular view of market dynamics and growth potential. The total market value is estimated at $XX Million in 2025.
Microspheres Industry Market Structure & Innovation Trends
The microspheres market is characterized by a moderately consolidated structure, featuring several influential players who collectively command a significant portion of the market share. Key companies such as Merit Medical Systems, Nouryon, Matsumoto Yushi-seiyaku Co Ltd, and 3M are at the forefront, driving innovation and fostering market expansion. The dynamics of market concentration are shaped by a confluence of factors, including rapid technological advancements, evolving regulatory landscapes, and strategic mergers and acquisitions (M&A). This report delves into the market share distribution among these key players and quantifies the value of significant M&A transactions, offering a clear picture of the competitive environment and potential future consolidation trends. Innovation is primarily propelled by the persistent demand for materials that are lighter, stronger, and more economically viable across a diverse array of industries. Furthermore, regulatory frameworks governing material safety and environmental impact play a crucial role in directing research and development efforts. The market also experiences competitive pressure from product substitutes, such as alternative lightweight fillers, while evolving end-user demographics and preferences are actively shaping demand patterns for various applications.
- Market Share: While specific figures fluctuate, industry analysis indicates that 3M generally holds a leading market share, followed by prominent players like Nouryon and Merit Medical Systems. (These are illustrative, actual report values will provide precise estimations.)
- M&A Activity: The microspheres market has witnessed considerable M&A activity in recent years, with substantial investment flows indicating a trend towards industry consolidation. (Actual report values will quantify M&A deal values.)
- Regulatory Landscape: Increasingly stringent environmental regulations are a significant catalyst, compelling the industry to prioritize the adoption of sustainable raw materials and eco-friendly manufacturing processes.
Microspheres Industry Market Dynamics & Trends
The global microspheres market is characterized by robust growth driven by increasing demand across diverse applications. The Compound Annual Growth Rate (CAGR) for the forecast period (2025-2033) is estimated at xx%, reflecting the rising adoption of microspheres in lightweighting initiatives within automotive and aerospace industries, as well as their growing use in advanced materials. Technological disruptions, particularly in materials science and manufacturing processes, are fueling innovation and the emergence of high-performance microspheres with enhanced properties. Consumer preferences for sustainable and environmentally friendly products are pushing manufacturers to develop eco-friendly microspheres. The competitive dynamics are shaped by factors like pricing strategies, product differentiation, and technological advancements. Market penetration is particularly high in established applications like paints and coatings, but is steadily increasing in emerging sectors such as medical technology and composites.
Dominant Regions & Segments in Microspheres Industry
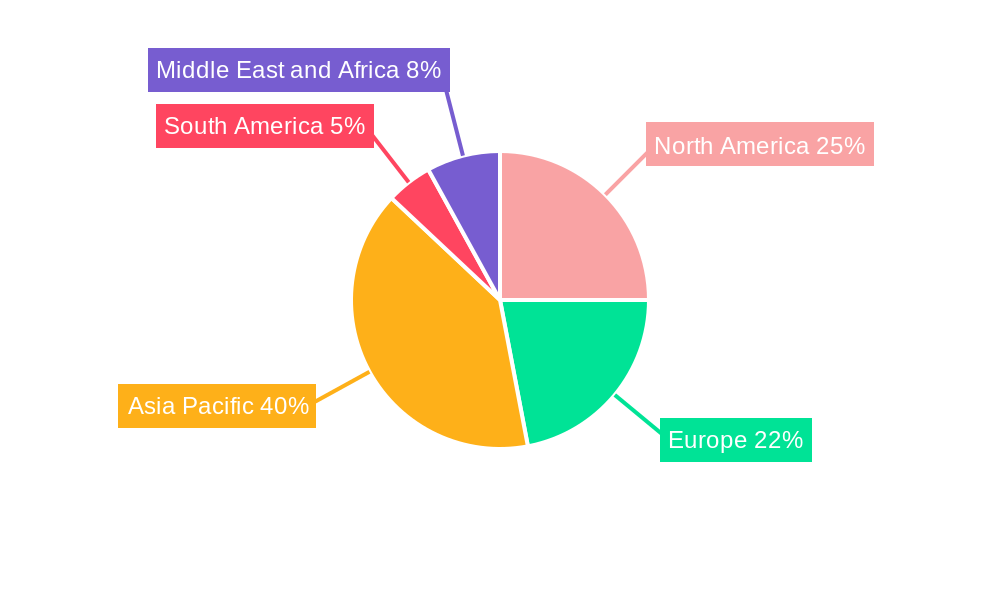
North America currently leads the global microspheres market, fueled by robust demand originating from its thriving automotive, aerospace, and medical technology sectors. Europe and the Asia-Pacific region also represent substantial markets, exhibiting significant growth potential. Within the market's segmentation, glass microspheres stand out as the dominant raw material type, owing to their versatility and the well-established manufacturing infrastructure supporting their production. Among the types of microspheres, hollow microspheres are experiencing wider adoption due to their superior performance characteristics in specialized applications. The automotive and medical technology segments are particularly poised for high growth, driven by their continuous focus on lightweighting initiatives and the development of specialized functionalities.
- Key Drivers in North America: The region benefits from a strong aerospace industry, substantial investments in advanced materials research and development, and supportive regulatory policies.
- Key Drivers in Europe: Europe's automotive industry remains a significant driver, coupled with a growing emphasis on the adoption of sustainable material solutions.
- Key Drivers in Asia-Pacific: Rapid industrialization and escalating manufacturing activities across the region are fueling demand for microspheres.
A granular analysis of regional dominance and segment-specific trends is comprehensively detailed within the full market report.
Microspheres Industry Product Innovations
Recent years have witnessed significant advancements in microsphere technology, with a focus on enhancing properties like strength, density, and surface modification for specialized applications. Developments include the introduction of high-pressure resistant microspheres for automotive underbody coatings and the use of high-strength glass bubbles for aerospace insulation. These innovations highlight the trend toward tailored microspheres with improved performance characteristics, optimizing market fit across various sectors.
Report Scope & Segmentation Analysis
This comprehensive report offers an in-depth analysis of the microspheres market, meticulously segmented by raw material (including glass, polymer, ceramic, fly ash, metallic, and other raw materials), type (hollow and solid), and application (spanning automotive, aerospace, cosmetics, oil and gas, paints and coatings, medical technology, composites, and other applications). For each segment, the report provides detailed growth projections, market size estimations, and an analysis of competitive dynamics, presenting a holistic perspective on prevailing market trends. The complete report offers an exhaustive breakdown of each segment, charting their projected growth trajectories and competitive landscapes.
Key Drivers of Microspheres Industry Growth
The growth of the microspheres industry is fueled by several key drivers: the increasing demand for lightweight materials in the automotive and aerospace industries, the growing adoption of microspheres in advanced materials and composites, and technological advancements that enable the production of high-performance microspheres with enhanced properties. Furthermore, the expanding use of microspheres in various applications, such as coatings, paints, and medical devices, contributes to market expansion.
Challenges in the Microspheres Industry Sector
The microspheres industry faces challenges including fluctuations in raw material prices, the complexity of manufacturing processes, and the potential for environmental concerns related to certain raw materials. These factors can influence production costs and overall market stability. Supply chain disruptions, particularly in the case of specialized raw materials, may lead to production delays and increased costs. Competitive pressures from alternative lightweighting solutions also influence market dynamics.
Emerging Opportunities in Microspheres Industry
Significant emerging opportunities lie in the development of sustainable and biodegradable microspheres, directly addressing growing environmental concerns. Furthermore, the exploration of novel applications in areas such as energy storage and advanced drug delivery systems presents substantial growth avenues. The ongoing advancements in nanotechnology are also anticipated to pave the way for the creation of microspheres with enhanced performance characteristics and unique, novel functionalities.
Leading Players in the Microspheres Industry Market
- Merit Medical Systems
- Nouryon
- Matsumoto Yushi-seiyaku Co Ltd
- Cospheric LLC
- Luminex Corporation (Diasorin Spa)
- Bangs Laboratories Inc
- 3M
- Chase Corporation
- Momentive
- Potters Industries LLC
- Siemens Healthineers AG
- Mo-sci Corporation (Heraeus Holdings)
- Kureha Corporation
- Trelleborg AB
Key Developments in Microspheres Industry
- June 2022: Nouryon launched its innovative Expancel HP92 microspheres, specifically designed for automotive underbody coating applications.
- February 2022: 3M's advanced glass bubbles played a critical role in the insulation of NASA's liquid hydrogen storage tanks, underscoring their high-performance capabilities.
Future Outlook for Microspheres Industry Market
The future of the microspheres market is bright, with continued growth projected across various segments. Technological advancements, coupled with increasing demand for lightweight and high-performance materials, will drive market expansion. Strategic partnerships and collaborations among industry players are expected to play a pivotal role in shaping future market dynamics. Exploration of new applications and sustainable manufacturing processes will further contribute to market growth.
Microspheres Industry Segmentation
-
1. Raw Material
- 1.1. Glass
- 1.2. Polymer
- 1.3. Ceramic
- 1.4. Fly Ash
- 1.5. Metallic
- 1.6. Other Raw Materials
-
2. Type
- 2.1. Hollow
- 2.2. Soild
-
3. Application
- 3.1. Automotive
- 3.2. Aerospace
- 3.3. Cosmetics
- 3.4. Oil and Gas
- 3.5. Paints and Coatings
- 3.6. Medical Technology
- 3.7. Composites
- 3.8. Other Applications
Microspheres Industry Segmentation By Geography
-
1. Asia Pacific
- 1.1. China
- 1.2. India
- 1.3. Japan
- 1.4. South Korea
- 1.5. Rest of Asia Pacific
-
2. North America
- 2.1. United States
- 2.2. Canada
- 2.3. Mexico
-
3. Europe
- 3.1. Germany
- 3.2. United Kingdom
- 3.3. Italy
- 3.4. France
- 3.5. Rest of Europe
-
4. South America
- 4.1. Brazil
- 4.2. Argentina
- 4.3. Rest of South America
-
5. Middle East and Africa
- 5.1. Saudi Arabia
- 5.2. South Africa
- 5.3. Rest of Middle East and Africa
Microspheres Industry Regional Market Share
Geographic Coverage of Microspheres Industry
Microspheres Industry REPORT HIGHLIGHTS
| Aspects | Details |
|---|---|
| Study Period | 2020-2034 |
| Base Year | 2025 |
| Estimated Year | 2026 |
| Forecast Period | 2026-2034 |
| Historical Period | 2020-2025 |
| Growth Rate | CAGR of 9.10% from 2020-2034 |
| Segmentation |
|
Table of Contents
- 1. Introduction
- 1.1. Research Scope
- 1.2. Market Segmentation
- 1.3. Research Objective
- 1.4. Definitions and Assumptions
- 2. Executive Summary
- 2.1. Market Snapshot
- 3. Market Dynamics
- 3.1. Market Drivers
- 3.2. Market Restrains
- 3.3. Market Trends
- 3.4. Market Opportunities
- 4. Market Factor Analysis
- 4.1. Porters Five Forces
- 4.1.1. Bargaining Power of Suppliers
- 4.1.2. Bargaining Power of Buyers
- 4.1.3. Threat of New Entrants
- 4.1.4. Threat of Substitutes
- 4.1.5. Competitive Rivalry
- 4.2. PESTEL analysis
- 4.3. BCG Analysis
- 4.3.1. Stars (High Growth, High Market Share)
- 4.3.2. Cash Cows (Low Growth, High Market Share)
- 4.3.3. Question Mark (High Growth, Low Market Share)
- 4.3.4. Dogs (Low Growth, Low Market Share)
- 4.4. Ansoff Matrix Analysis
- 4.5. Supply Chain Analysis
- 4.6. Regulatory Landscape
- 4.7. Current Market Potential and Opportunity Assessment (TAM–SAM–SOM Framework)
- 4.8. PRI Analyst Note
- 4.1. Porters Five Forces
- 5. Market Analysis, Insights and Forecast 2021-2033
- 5.1. Market Analysis, Insights and Forecast - by Raw Material
- 5.1.1. Glass
- 5.1.2. Polymer
- 5.1.3. Ceramic
- 5.1.4. Fly Ash
- 5.1.5. Metallic
- 5.1.6. Other Raw Materials
- 5.2. Market Analysis, Insights and Forecast - by Type
- 5.2.1. Hollow
- 5.2.2. Soild
- 5.3. Market Analysis, Insights and Forecast - by Application
- 5.3.1. Automotive
- 5.3.2. Aerospace
- 5.3.3. Cosmetics
- 5.3.4. Oil and Gas
- 5.3.5. Paints and Coatings
- 5.3.6. Medical Technology
- 5.3.7. Composites
- 5.3.8. Other Applications
- 5.4. Market Analysis, Insights and Forecast - by Region
- 5.4.1. Asia Pacific
- 5.4.2. North America
- 5.4.3. Europe
- 5.4.4. South America
- 5.4.5. Middle East and Africa
- 5.1. Market Analysis, Insights and Forecast - by Raw Material
- 6. Global Microspheres Industry Analysis, Insights and Forecast, 2021-2033
- 6.1. Market Analysis, Insights and Forecast - by Raw Material
- 6.1.1. Glass
- 6.1.2. Polymer
- 6.1.3. Ceramic
- 6.1.4. Fly Ash
- 6.1.5. Metallic
- 6.1.6. Other Raw Materials
- 6.2. Market Analysis, Insights and Forecast - by Type
- 6.2.1. Hollow
- 6.2.2. Soild
- 6.3. Market Analysis, Insights and Forecast - by Application
- 6.3.1. Automotive
- 6.3.2. Aerospace
- 6.3.3. Cosmetics
- 6.3.4. Oil and Gas
- 6.3.5. Paints and Coatings
- 6.3.6. Medical Technology
- 6.3.7. Composites
- 6.3.8. Other Applications
- 6.1. Market Analysis, Insights and Forecast - by Raw Material
- 7. Asia Pacific Microspheres Industry Analysis, Insights and Forecast, 2020-2032
- 7.1. Market Analysis, Insights and Forecast - by Raw Material
- 7.1.1. Glass
- 7.1.2. Polymer
- 7.1.3. Ceramic
- 7.1.4. Fly Ash
- 7.1.5. Metallic
- 7.1.6. Other Raw Materials
- 7.2. Market Analysis, Insights and Forecast - by Type
- 7.2.1. Hollow
- 7.2.2. Soild
- 7.3. Market Analysis, Insights and Forecast - by Application
- 7.3.1. Automotive
- 7.3.2. Aerospace
- 7.3.3. Cosmetics
- 7.3.4. Oil and Gas
- 7.3.5. Paints and Coatings
- 7.3.6. Medical Technology
- 7.3.7. Composites
- 7.3.8. Other Applications
- 7.1. Market Analysis, Insights and Forecast - by Raw Material
- 8. North America Microspheres Industry Analysis, Insights and Forecast, 2020-2032
- 8.1. Market Analysis, Insights and Forecast - by Raw Material
- 8.1.1. Glass
- 8.1.2. Polymer
- 8.1.3. Ceramic
- 8.1.4. Fly Ash
- 8.1.5. Metallic
- 8.1.6. Other Raw Materials
- 8.2. Market Analysis, Insights and Forecast - by Type
- 8.2.1. Hollow
- 8.2.2. Soild
- 8.3. Market Analysis, Insights and Forecast - by Application
- 8.3.1. Automotive
- 8.3.2. Aerospace
- 8.3.3. Cosmetics
- 8.3.4. Oil and Gas
- 8.3.5. Paints and Coatings
- 8.3.6. Medical Technology
- 8.3.7. Composites
- 8.3.8. Other Applications
- 8.1. Market Analysis, Insights and Forecast - by Raw Material
- 9. Europe Microspheres Industry Analysis, Insights and Forecast, 2020-2032
- 9.1. Market Analysis, Insights and Forecast - by Raw Material
- 9.1.1. Glass
- 9.1.2. Polymer
- 9.1.3. Ceramic
- 9.1.4. Fly Ash
- 9.1.5. Metallic
- 9.1.6. Other Raw Materials
- 9.2. Market Analysis, Insights and Forecast - by Type
- 9.2.1. Hollow
- 9.2.2. Soild
- 9.3. Market Analysis, Insights and Forecast - by Application
- 9.3.1. Automotive
- 9.3.2. Aerospace
- 9.3.3. Cosmetics
- 9.3.4. Oil and Gas
- 9.3.5. Paints and Coatings
- 9.3.6. Medical Technology
- 9.3.7. Composites
- 9.3.8. Other Applications
- 9.1. Market Analysis, Insights and Forecast - by Raw Material
- 10. South America Microspheres Industry Analysis, Insights and Forecast, 2020-2032
- 10.1. Market Analysis, Insights and Forecast - by Raw Material
- 10.1.1. Glass
- 10.1.2. Polymer
- 10.1.3. Ceramic
- 10.1.4. Fly Ash
- 10.1.5. Metallic
- 10.1.6. Other Raw Materials
- 10.2. Market Analysis, Insights and Forecast - by Type
- 10.2.1. Hollow
- 10.2.2. Soild
- 10.3. Market Analysis, Insights and Forecast - by Application
- 10.3.1. Automotive
- 10.3.2. Aerospace
- 10.3.3. Cosmetics
- 10.3.4. Oil and Gas
- 10.3.5. Paints and Coatings
- 10.3.6. Medical Technology
- 10.3.7. Composites
- 10.3.8. Other Applications
- 10.1. Market Analysis, Insights and Forecast - by Raw Material
- 11. Middle East and Africa Microspheres Industry Analysis, Insights and Forecast, 2020-2032
- 11.1. Market Analysis, Insights and Forecast - by Raw Material
- 11.1.1. Glass
- 11.1.2. Polymer
- 11.1.3. Ceramic
- 11.1.4. Fly Ash
- 11.1.5. Metallic
- 11.1.6. Other Raw Materials
- 11.2. Market Analysis, Insights and Forecast - by Type
- 11.2.1. Hollow
- 11.2.2. Soild
- 11.3. Market Analysis, Insights and Forecast - by Application
- 11.3.1. Automotive
- 11.3.2. Aerospace
- 11.3.3. Cosmetics
- 11.3.4. Oil and Gas
- 11.3.5. Paints and Coatings
- 11.3.6. Medical Technology
- 11.3.7. Composites
- 11.3.8. Other Applications
- 11.1. Market Analysis, Insights and Forecast - by Raw Material
- 12. Competitive Analysis
- 12.1. Company Profiles
- 12.1.1 Merit Medical Systems
- 12.1.1.1. Company Overview
- 12.1.1.2. Products
- 12.1.1.3. Company Financials
- 12.1.1.4. SWOT Analysis
- 12.1.2 Nouryon
- 12.1.2.1. Company Overview
- 12.1.2.2. Products
- 12.1.2.3. Company Financials
- 12.1.2.4. SWOT Analysis
- 12.1.3 Matsumoto Yushi-seiyaku Co Ltd
- 12.1.3.1. Company Overview
- 12.1.3.2. Products
- 12.1.3.3. Company Financials
- 12.1.3.4. SWOT Analysis
- 12.1.4 Cospheric LLC
- 12.1.4.1. Company Overview
- 12.1.4.2. Products
- 12.1.4.3. Company Financials
- 12.1.4.4. SWOT Analysis
- 12.1.5 Luminex Corporation (Diasorin Spa)
- 12.1.5.1. Company Overview
- 12.1.5.2. Products
- 12.1.5.3. Company Financials
- 12.1.5.4. SWOT Analysis
- 12.1.6 Bangs Laboratories Inc
- 12.1.6.1. Company Overview
- 12.1.6.2. Products
- 12.1.6.3. Company Financials
- 12.1.6.4. SWOT Analysis
- 12.1.7 3M
- 12.1.7.1. Company Overview
- 12.1.7.2. Products
- 12.1.7.3. Company Financials
- 12.1.7.4. SWOT Analysis
- 12.1.8 Chase Corporation
- 12.1.8.1. Company Overview
- 12.1.8.2. Products
- 12.1.8.3. Company Financials
- 12.1.8.4. SWOT Analysis
- 12.1.9 Momentive
- 12.1.9.1. Company Overview
- 12.1.9.2. Products
- 12.1.9.3. Company Financials
- 12.1.9.4. SWOT Analysis
- 12.1.10 Potters Industries LLC
- 12.1.10.1. Company Overview
- 12.1.10.2. Products
- 12.1.10.3. Company Financials
- 12.1.10.4. SWOT Analysis
- 12.1.11 Siemens Healthineers AG
- 12.1.11.1. Company Overview
- 12.1.11.2. Products
- 12.1.11.3. Company Financials
- 12.1.11.4. SWOT Analysis
- 12.1.12 Mo-sci Corporation (Heraeus Holdings)
- 12.1.12.1. Company Overview
- 12.1.12.2. Products
- 12.1.12.3. Company Financials
- 12.1.12.4. SWOT Analysis
- 12.1.13 Kureha Corporation
- 12.1.13.1. Company Overview
- 12.1.13.2. Products
- 12.1.13.3. Company Financials
- 12.1.13.4. SWOT Analysis
- 12.1.14 Trelleborg AB*List Not Exhaustive
- 12.1.14.1. Company Overview
- 12.1.14.2. Products
- 12.1.14.3. Company Financials
- 12.1.14.4. SWOT Analysis
- 12.1.1 Merit Medical Systems
- 12.2. Market Entropy
- 12.2.1 Company's Key Areas Served
- 12.2.2 Recent Developments
- 12.3. Company Market Share Analysis 2025
- 12.3.1 Top 5 Companies Market Share Analysis
- 12.3.2 Top 3 Companies Market Share Analysis
- 12.4. List of Potential Customers
- 13. Research Methodology
List of Figures
- Figure 1: Global Microspheres Industry Revenue Breakdown (Million, %) by Region 2025 & 2033
- Figure 2: Asia Pacific Microspheres Industry Revenue (Million), by Raw Material 2025 & 2033
- Figure 3: Asia Pacific Microspheres Industry Revenue Share (%), by Raw Material 2025 & 2033
- Figure 4: Asia Pacific Microspheres Industry Revenue (Million), by Type 2025 & 2033
- Figure 5: Asia Pacific Microspheres Industry Revenue Share (%), by Type 2025 & 2033
- Figure 6: Asia Pacific Microspheres Industry Revenue (Million), by Application 2025 & 2033
- Figure 7: Asia Pacific Microspheres Industry Revenue Share (%), by Application 2025 & 2033
- Figure 8: Asia Pacific Microspheres Industry Revenue (Million), by Country 2025 & 2033
- Figure 9: Asia Pacific Microspheres Industry Revenue Share (%), by Country 2025 & 2033
- Figure 10: North America Microspheres Industry Revenue (Million), by Raw Material 2025 & 2033
- Figure 11: North America Microspheres Industry Revenue Share (%), by Raw Material 2025 & 2033
- Figure 12: North America Microspheres Industry Revenue (Million), by Type 2025 & 2033
- Figure 13: North America Microspheres Industry Revenue Share (%), by Type 2025 & 2033
- Figure 14: North America Microspheres Industry Revenue (Million), by Application 2025 & 2033
- Figure 15: North America Microspheres Industry Revenue Share (%), by Application 2025 & 2033
- Figure 16: North America Microspheres Industry Revenue (Million), by Country 2025 & 2033
- Figure 17: North America Microspheres Industry Revenue Share (%), by Country 2025 & 2033
- Figure 18: Europe Microspheres Industry Revenue (Million), by Raw Material 2025 & 2033
- Figure 19: Europe Microspheres Industry Revenue Share (%), by Raw Material 2025 & 2033
- Figure 20: Europe Microspheres Industry Revenue (Million), by Type 2025 & 2033
- Figure 21: Europe Microspheres Industry Revenue Share (%), by Type 2025 & 2033
- Figure 22: Europe Microspheres Industry Revenue (Million), by Application 2025 & 2033
- Figure 23: Europe Microspheres Industry Revenue Share (%), by Application 2025 & 2033
- Figure 24: Europe Microspheres Industry Revenue (Million), by Country 2025 & 2033
- Figure 25: Europe Microspheres Industry Revenue Share (%), by Country 2025 & 2033
- Figure 26: South America Microspheres Industry Revenue (Million), by Raw Material 2025 & 2033
- Figure 27: South America Microspheres Industry Revenue Share (%), by Raw Material 2025 & 2033
- Figure 28: South America Microspheres Industry Revenue (Million), by Type 2025 & 2033
- Figure 29: South America Microspheres Industry Revenue Share (%), by Type 2025 & 2033
- Figure 30: South America Microspheres Industry Revenue (Million), by Application 2025 & 2033
- Figure 31: South America Microspheres Industry Revenue Share (%), by Application 2025 & 2033
- Figure 32: South America Microspheres Industry Revenue (Million), by Country 2025 & 2033
- Figure 33: South America Microspheres Industry Revenue Share (%), by Country 2025 & 2033
- Figure 34: Middle East and Africa Microspheres Industry Revenue (Million), by Raw Material 2025 & 2033
- Figure 35: Middle East and Africa Microspheres Industry Revenue Share (%), by Raw Material 2025 & 2033
- Figure 36: Middle East and Africa Microspheres Industry Revenue (Million), by Type 2025 & 2033
- Figure 37: Middle East and Africa Microspheres Industry Revenue Share (%), by Type 2025 & 2033
- Figure 38: Middle East and Africa Microspheres Industry Revenue (Million), by Application 2025 & 2033
- Figure 39: Middle East and Africa Microspheres Industry Revenue Share (%), by Application 2025 & 2033
- Figure 40: Middle East and Africa Microspheres Industry Revenue (Million), by Country 2025 & 2033
- Figure 41: Middle East and Africa Microspheres Industry Revenue Share (%), by Country 2025 & 2033
List of Tables
- Table 1: Global Microspheres Industry Revenue Million Forecast, by Raw Material 2020 & 2033
- Table 2: Global Microspheres Industry Revenue Million Forecast, by Type 2020 & 2033
- Table 3: Global Microspheres Industry Revenue Million Forecast, by Application 2020 & 2033
- Table 4: Global Microspheres Industry Revenue Million Forecast, by Region 2020 & 2033
- Table 5: Global Microspheres Industry Revenue Million Forecast, by Raw Material 2020 & 2033
- Table 6: Global Microspheres Industry Revenue Million Forecast, by Type 2020 & 2033
- Table 7: Global Microspheres Industry Revenue Million Forecast, by Application 2020 & 2033
- Table 8: Global Microspheres Industry Revenue Million Forecast, by Country 2020 & 2033
- Table 9: China Microspheres Industry Revenue (Million) Forecast, by Application 2020 & 2033
- Table 10: India Microspheres Industry Revenue (Million) Forecast, by Application 2020 & 2033
- Table 11: Japan Microspheres Industry Revenue (Million) Forecast, by Application 2020 & 2033
- Table 12: South Korea Microspheres Industry Revenue (Million) Forecast, by Application 2020 & 2033
- Table 13: Rest of Asia Pacific Microspheres Industry Revenue (Million) Forecast, by Application 2020 & 2033
- Table 14: Global Microspheres Industry Revenue Million Forecast, by Raw Material 2020 & 2033
- Table 15: Global Microspheres Industry Revenue Million Forecast, by Type 2020 & 2033
- Table 16: Global Microspheres Industry Revenue Million Forecast, by Application 2020 & 2033
- Table 17: Global Microspheres Industry Revenue Million Forecast, by Country 2020 & 2033
- Table 18: United States Microspheres Industry Revenue (Million) Forecast, by Application 2020 & 2033
- Table 19: Canada Microspheres Industry Revenue (Million) Forecast, by Application 2020 & 2033
- Table 20: Mexico Microspheres Industry Revenue (Million) Forecast, by Application 2020 & 2033
- Table 21: Global Microspheres Industry Revenue Million Forecast, by Raw Material 2020 & 2033
- Table 22: Global Microspheres Industry Revenue Million Forecast, by Type 2020 & 2033
- Table 23: Global Microspheres Industry Revenue Million Forecast, by Application 2020 & 2033
- Table 24: Global Microspheres Industry Revenue Million Forecast, by Country 2020 & 2033
- Table 25: Germany Microspheres Industry Revenue (Million) Forecast, by Application 2020 & 2033
- Table 26: United Kingdom Microspheres Industry Revenue (Million) Forecast, by Application 2020 & 2033
- Table 27: Italy Microspheres Industry Revenue (Million) Forecast, by Application 2020 & 2033
- Table 28: France Microspheres Industry Revenue (Million) Forecast, by Application 2020 & 2033
- Table 29: Rest of Europe Microspheres Industry Revenue (Million) Forecast, by Application 2020 & 2033
- Table 30: Global Microspheres Industry Revenue Million Forecast, by Raw Material 2020 & 2033
- Table 31: Global Microspheres Industry Revenue Million Forecast, by Type 2020 & 2033
- Table 32: Global Microspheres Industry Revenue Million Forecast, by Application 2020 & 2033
- Table 33: Global Microspheres Industry Revenue Million Forecast, by Country 2020 & 2033
- Table 34: Brazil Microspheres Industry Revenue (Million) Forecast, by Application 2020 & 2033
- Table 35: Argentina Microspheres Industry Revenue (Million) Forecast, by Application 2020 & 2033
- Table 36: Rest of South America Microspheres Industry Revenue (Million) Forecast, by Application 2020 & 2033
- Table 37: Global Microspheres Industry Revenue Million Forecast, by Raw Material 2020 & 2033
- Table 38: Global Microspheres Industry Revenue Million Forecast, by Type 2020 & 2033
- Table 39: Global Microspheres Industry Revenue Million Forecast, by Application 2020 & 2033
- Table 40: Global Microspheres Industry Revenue Million Forecast, by Country 2020 & 2033
- Table 41: Saudi Arabia Microspheres Industry Revenue (Million) Forecast, by Application 2020 & 2033
- Table 42: South Africa Microspheres Industry Revenue (Million) Forecast, by Application 2020 & 2033
- Table 43: Rest of Middle East and Africa Microspheres Industry Revenue (Million) Forecast, by Application 2020 & 2033
Frequently Asked Questions
1. What is the projected Compound Annual Growth Rate (CAGR) of the Microspheres Industry?
The projected CAGR is approximately 9.10%.
2. Which companies are prominent players in the Microspheres Industry?
Key companies in the market include Merit Medical Systems, Nouryon, Matsumoto Yushi-seiyaku Co Ltd, Cospheric LLC, Luminex Corporation (Diasorin Spa), Bangs Laboratories Inc, 3M, Chase Corporation, Momentive, Potters Industries LLC, Siemens Healthineers AG, Mo-sci Corporation (Heraeus Holdings), Kureha Corporation, Trelleborg AB*List Not Exhaustive.
3. What are the main segments of the Microspheres Industry?
The market segments include Raw Material, Type, Application.
4. Can you provide details about the market size?
The market size is estimated to be USD 7.95 Million as of 2022.
5. What are some drivers contributing to market growth?
Increasing Application and Advancements in Medical Industry; Increasing Demand from Cosmetics Industry.
6. What are the notable trends driving market growth?
Increasing Usage in the Medical Technology.
7. Are there any restraints impacting market growth?
High Production and Research and Development Cost.
8. Can you provide examples of recent developments in the market?
In June 2022, Nouryon introduced expancel HP92 microspheres to reduce weight and withstand high pressure in underbody coatings and sealants for the automotive industry. These microspheres are currently produced in Stockvik, Sweden, with production expected in Green Bay, Wisconsin, the United States, in early 2023.
9. What pricing options are available for accessing the report?
Pricing options include single-user, multi-user, and enterprise licenses priced at USD 4750, USD 5250, and USD 8750 respectively.
10. Is the market size provided in terms of value or volume?
The market size is provided in terms of value, measured in Million.
11. Are there any specific market keywords associated with the report?
Yes, the market keyword associated with the report is "Microspheres Industry," which aids in identifying and referencing the specific market segment covered.
12. How do I determine which pricing option suits my needs best?
The pricing options vary based on user requirements and access needs. Individual users may opt for single-user licenses, while businesses requiring broader access may choose multi-user or enterprise licenses for cost-effective access to the report.
13. Are there any additional resources or data provided in the Microspheres Industry report?
While the report offers comprehensive insights, it's advisable to review the specific contents or supplementary materials provided to ascertain if additional resources or data are available.
14. How can I stay updated on further developments or reports in the Microspheres Industry?
To stay informed about further developments, trends, and reports in the Microspheres Industry, consider subscribing to industry newsletters, following relevant companies and organizations, or regularly checking reputable industry news sources and publications.
Methodology
Step 1 - Identification of Relevant Samples Size from Population Database


Step 2 - Approaches for Defining Global Market Size (Value, Volume* & Price*)

Note*: In applicable scenarios
Step 3 - Data Sources
Primary Research
- Web Analytics
- Survey Reports
- Research Institute
- Latest Research Reports
- Opinion Leaders
Secondary Research
- Annual Reports
- White Paper
- Latest Press Release
- Industry Association
- Paid Database
- Investor Presentations

Step 4 - Data Triangulation
Involves using different sources of information in order to increase the validity of a study
These sources are likely to be stakeholders in a program - participants, other researchers, program staff, other community members, and so on.
Then we put all data in single framework & apply various statistical tools to find out the dynamic on the market.
During the analysis stage, feedback from the stakeholder groups would be compared to determine areas of agreement as well as areas of divergence