

Key Insights
The Military 3D and 4D Printing market is poised for significant expansion, driven by the demand for advanced, customizable, and high-performance military assets. Projected to reach 307.72 million by 2025, the market is exhibiting a remarkable CAGR of 40.9%. This growth is underpinned by additive manufacturing's capacity for intricate designs and lightweight components, enhancing weaponry, vehicles, and protective gear. Rapid prototyping and on-demand production capabilities address critical logistical needs and reduce supply chain vulnerabilities. Furthermore, the integration of smart materials in 4D printing enables adaptive and self-healing equipment, boosting durability and operational readiness. The market spans Airborne, Land, and Sea platforms, with leading contributors including 3T Additive Manufacturing, Markforged, and Stratasys.
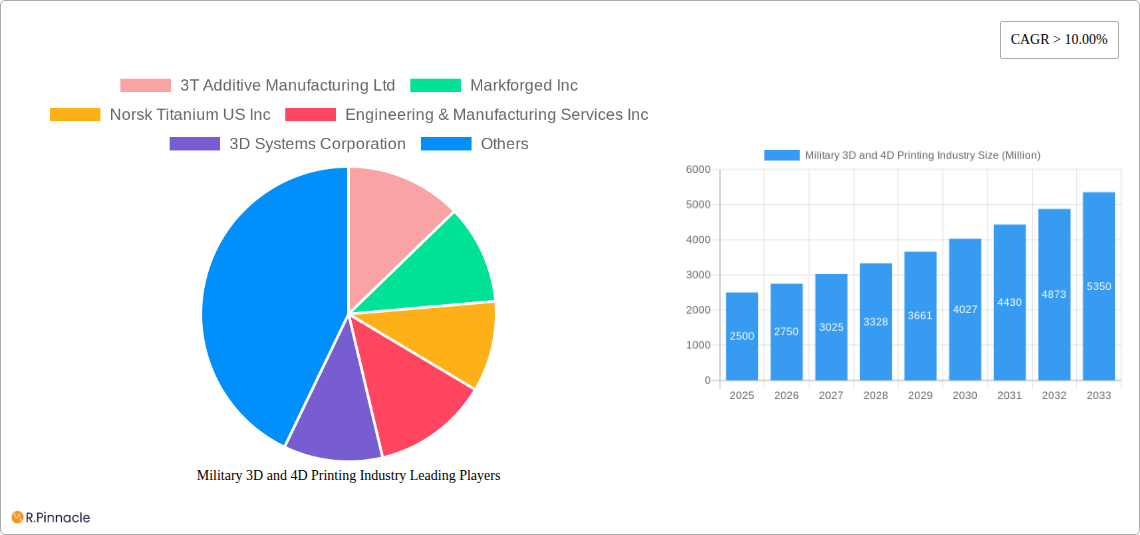
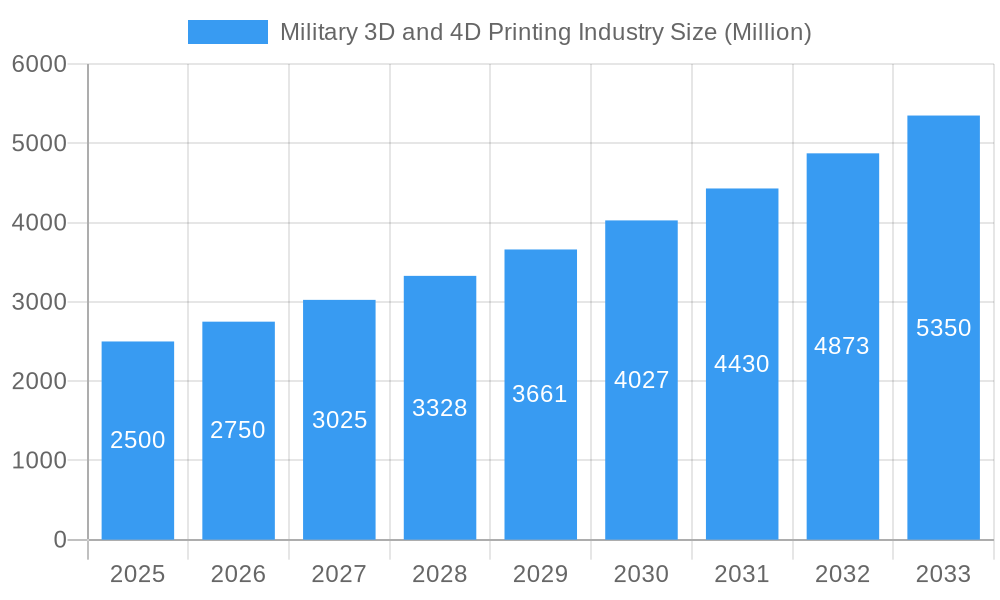
Military 3D and 4D Printing Industry Market Size (In Million)
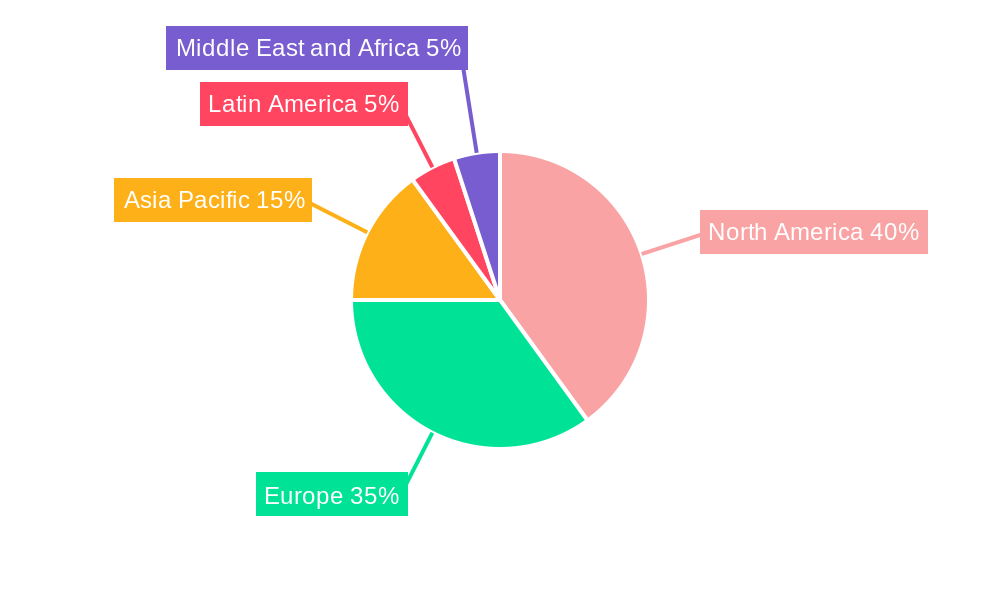
Geographically, North America and Europe lead market development due to substantial defense investments and advanced technological ecosystems. The Asia-Pacific region presents substantial growth prospects fueled by escalating military expenditures and the burgeoning adoption of additive manufacturing. Key challenges include initial capital investment, the requirement for skilled labor, and ongoing material development for specialized military applications. Addressing these factors will be crucial for realizing the full strategic advantages of additive manufacturing in defense. Continued innovation and a growing recognition of these strategic benefits will drive further market evolution.
Military 3D and 4D Printing Industry Company Market Share
Military 3D and 4D Printing Industry: A Comprehensive Market Report (2019-2033)
This in-depth report provides a comprehensive analysis of the Military 3D and 4D Printing Industry, projecting a market valued at $XX Million by 2033. The study covers the period 2019-2033, with 2025 as the base and estimated year, and forecasts spanning 2025-2033. This report is essential for industry professionals, investors, and strategists seeking actionable insights into this rapidly evolving sector.
Military 3D and 4D Printing Industry Market Structure & Innovation Trends
This section analyzes the competitive landscape, innovation drivers, and regulatory factors shaping the Military 3D and 4D Printing market. The market is moderately concentrated, with key players including 3T Additive Manufacturing Ltd, Markforged Inc, Norsk Titanium US Inc, Engineering & Manufacturing Services Inc, 3D Systems Corporation, EOS Gmbh, Nano Dimensions Ltd, Stratasys Ltd, and ExOne Company holding significant market share. However, the entry of new players and disruptive technologies is driving increased competition.
- Market Concentration: The top 5 players account for approximately XX% of the market share in 2025.
- Innovation Drivers: Advancements in materials science, software development, and printing technologies are driving innovation. The demand for lightweight, high-strength components is fueling the adoption of 4D printing.
- Regulatory Frameworks: Government regulations and defense spending influence market growth. Stringent quality control and certification standards are also significant factors.
- Product Substitutes: Traditional manufacturing methods pose a challenge, but the advantages of 3D/4D printing in terms of customization, speed, and cost-efficiency are gradually overcoming these barriers.
- End-User Demographics: The primary end-users are military branches (Airborne, Land, Sea) and defense contractors.
- M&A Activities: The industry has witnessed several mergers and acquisitions in recent years, with deal values totaling $XX Million in the period 2019-2024. These deals have primarily focused on expanding product portfolios and technological capabilities.
Military 3D and 4D Printing Industry Market Dynamics & Trends
The Military 3D and 4D Printing market is experiencing robust growth, driven by several factors. Increasing defense budgets, the need for customized military equipment, and the advantages of on-demand manufacturing are key drivers. Technological advancements, particularly in materials and software, are further accelerating market expansion.
The market is expected to exhibit a Compound Annual Growth Rate (CAGR) of XX% during the forecast period (2025-2033). Market penetration is currently estimated at XX%, with significant potential for future growth as more military applications are identified and adopted. Competitive dynamics are intense, with companies focusing on developing advanced materials, software solutions, and printing technologies to gain a competitive edge. Consumer preference is shifting towards customizable and high-performance components, creating opportunities for 3D/4D printing technologies.
Dominant Regions & Segments in Military 3D and 4D Printing Industry
The North American region dominates the Military 3D and 4D printing market, driven by high defense spending and strong technological capabilities. The Airborne segment is currently the largest, followed by Land and Sea.
- North America Dominance: Key drivers include substantial defense budgets, robust R&D investments, and the presence of major technology companies.
- Airborne Segment: High demand for lightweight and high-performance components for aircraft and drones.
- Land Segment: Growth is driven by the need for customized and easily deployable equipment for ground forces.
- Sea Segment: The market is growing steadily, driven by the adoption of 3D printing for shipbuilding and repair.
Military 3D and 4D Printing Industry Product Innovations
Recent product developments include the introduction of advanced materials with improved strength, durability, and functionality. Applications range from producing customized weapons and equipment to creating complex components for aircraft and vehicles. The key competitive advantages lie in the ability to produce highly customized, lightweight, and strong components with reduced lead times and costs. This is leading to the increased adoption of 3D and 4D printing technologies within the military sector.
Report Scope & Segmentation Analysis
This report segments the Military 3D and 4D Printing market by Platform: Airborne, Land, and Sea.
- Airborne: This segment is projected to experience significant growth driven by the increasing demand for lightweight and high-performance components in aerospace and defense applications. The market size is estimated at $XX Million in 2025.
- Land: This segment demonstrates steady growth, fueled by the requirement for customized and readily deployable equipment for ground troops. The market size is estimated at $XX Million in 2025.
- Sea: The Sea segment witnesses moderate growth, driven by the adoption of 3D printing in shipbuilding and repair operations. The market size is estimated at $XX Million in 2025.
Key Drivers of Military 3D and 4D Printing Industry Growth
Several factors drive the growth of the Military 3D and 4D Printing industry:
- Technological advancements: Continuous improvements in printing technologies, materials, and software are expanding the range of applications.
- Increased defense spending: Higher government budgets allocated to defense modernization and technological upgrades are fueling market growth.
- Need for customization and rapid prototyping: 3D/4D printing facilitates rapid prototyping and production of highly customized components, crucial for military operations.
Challenges in the Military 3D and 4D Printing Industry Sector
Despite its growth potential, the industry faces several challenges:
- High initial investment costs: The cost of acquiring 3D/4D printers and related equipment can be substantial.
- Supply chain vulnerabilities: Disruptions in material supply chains can impact production.
- Stringent quality control requirements: Meeting rigorous military standards necessitates meticulous quality control processes.
Emerging Opportunities in Military 3D and 4D Printing Industry
Emerging opportunities include:
- Development of new materials: Research into high-performance materials tailored for military applications creates new market avenues.
- Integration of AI and automation: AI-driven design and automated printing processes enhance efficiency and reduce costs.
- Expansion into new military applications: Exploring novel applications in areas such as logistics, training, and maintenance creates further growth potential.
Leading Players in the Military 3D and 4D Printing Industry Market
- 3T Additive Manufacturing Ltd
- Markforged Inc
- Norsk Titanium US Inc
- Engineering & Manufacturing Services Inc
- 3D Systems Corporation
- EOS Gmbh
- Nano Dimensions Ltd
- Stratasys Ltd
- ExOne Company
Key Developments in Military 3D and 4D Printing Industry Industry
- November 2022: 3D Systems and ALM partnered to expand access to industry-leading 3D printing materials, accelerating material adoption and additive manufacturing growth.
- September 2021: General Lattice secured a US Army contract to develop a 3D-printed combat helmet with improved energy absorption, highlighting the growing interest in advanced protective gear.
Future Outlook for Military 3D and 4D Printing Industry Market
The Military 3D and 4D Printing market is poised for significant growth, driven by ongoing technological advancements, increased defense budgets, and the growing demand for customized and high-performance military equipment. Strategic partnerships, R&D investments, and the exploration of new applications will shape the future landscape of this dynamic sector. The market is expected to reach $XX Million by 2033, presenting substantial opportunities for companies in the industry.
Military 3D and 4D Printing Industry Segmentation
- 1. Production Analysis
- 2. Consumption Analysis
- 3. Import Market Analysis (Value & Volume)
- 4. Export Market Analysis (Value & Volume)
- 5. Price Trend Analysis
Military 3D and 4D Printing Industry Segmentation By Geography
-
1. North America
- 1.1. United States
- 1.2. Canada
- 1.3. Mexico
-
2. South America
- 2.1. Brazil
- 2.2. Argentina
- 2.3. Rest of South America
-
3. Europe
- 3.1. United Kingdom
- 3.2. Germany
- 3.3. France
- 3.4. Italy
- 3.5. Spain
- 3.6. Russia
- 3.7. Benelux
- 3.8. Nordics
- 3.9. Rest of Europe
-
4. Middle East & Africa
- 4.1. Turkey
- 4.2. Israel
- 4.3. GCC
- 4.4. North Africa
- 4.5. South Africa
- 4.6. Rest of Middle East & Africa
-
5. Asia Pacific
- 5.1. China
- 5.2. India
- 5.3. Japan
- 5.4. South Korea
- 5.5. ASEAN
- 5.6. Oceania
- 5.7. Rest of Asia Pacific
Military 3D and 4D Printing Industry Regional Market Share
Geographic Coverage of Military 3D and 4D Printing Industry
Military 3D and 4D Printing Industry REPORT HIGHLIGHTS
| Aspects | Details |
|---|---|
| Study Period | 2020-2034 |
| Base Year | 2025 |
| Estimated Year | 2026 |
| Forecast Period | 2026-2034 |
| Historical Period | 2020-2025 |
| Growth Rate | CAGR of 35.8% from 2020-2034 |
| Segmentation |
|
Table of Contents
- 1. Introduction
- 1.1. Research Scope
- 1.2. Market Segmentation
- 1.3. Research Objective
- 1.4. Definitions and Assumptions
- 2. Executive Summary
- 2.1. Market Snapshot
- 3. Market Dynamics
- 3.1. Market Drivers
- 3.2. Market Restrains
- 3.3. Market Trends
- 3.4. Market Opportunities
- 4. Market Factor Analysis
- 4.1. Porters Five Forces
- 4.1.1. Bargaining Power of Suppliers
- 4.1.2. Bargaining Power of Buyers
- 4.1.3. Threat of New Entrants
- 4.1.4. Threat of Substitutes
- 4.1.5. Competitive Rivalry
- 4.2. PESTEL analysis
- 4.3. BCG Analysis
- 4.3.1. Stars (High Growth, High Market Share)
- 4.3.2. Cash Cows (Low Growth, High Market Share)
- 4.3.3. Question Mark (High Growth, Low Market Share)
- 4.3.4. Dogs (Low Growth, Low Market Share)
- 4.4. Ansoff Matrix Analysis
- 4.5. Supply Chain Analysis
- 4.6. Regulatory Landscape
- 4.7. Current Market Potential and Opportunity Assessment (TAM–SAM–SOM Framework)
- 4.8. PRI Analyst Note
- 4.1. Porters Five Forces
- 5. Market Analysis, Insights and Forecast 2021-2033
- 5.1. Market Analysis, Insights and Forecast - by Production Analysis
- 5.2. Market Analysis, Insights and Forecast - by Consumption Analysis
- 5.3. Market Analysis, Insights and Forecast - by Import Market Analysis (Value & Volume)
- 5.4. Market Analysis, Insights and Forecast - by Export Market Analysis (Value & Volume)
- 5.5. Market Analysis, Insights and Forecast - by Price Trend Analysis
- 5.6. Market Analysis, Insights and Forecast - by Region
- 5.6.1. North America
- 5.6.2. South America
- 5.6.3. Europe
- 5.6.4. Middle East & Africa
- 5.6.5. Asia Pacific
- 6. Global Military 3D and 4D Printing Industry Analysis, Insights and Forecast, 2021-2033
- 6.1. Market Analysis, Insights and Forecast - by Production Analysis
- 6.2. Market Analysis, Insights and Forecast - by Consumption Analysis
- 6.3. Market Analysis, Insights and Forecast - by Import Market Analysis (Value & Volume)
- 6.4. Market Analysis, Insights and Forecast - by Export Market Analysis (Value & Volume)
- 6.5. Market Analysis, Insights and Forecast - by Price Trend Analysis
- 7. North America Military 3D and 4D Printing Industry Analysis, Insights and Forecast, 2020-2032
- 7.1. Market Analysis, Insights and Forecast - by Production Analysis
- 7.2. Market Analysis, Insights and Forecast - by Consumption Analysis
- 7.3. Market Analysis, Insights and Forecast - by Import Market Analysis (Value & Volume)
- 7.4. Market Analysis, Insights and Forecast - by Export Market Analysis (Value & Volume)
- 7.5. Market Analysis, Insights and Forecast - by Price Trend Analysis
- 8. South America Military 3D and 4D Printing Industry Analysis, Insights and Forecast, 2020-2032
- 8.1. Market Analysis, Insights and Forecast - by Production Analysis
- 8.2. Market Analysis, Insights and Forecast - by Consumption Analysis
- 8.3. Market Analysis, Insights and Forecast - by Import Market Analysis (Value & Volume)
- 8.4. Market Analysis, Insights and Forecast - by Export Market Analysis (Value & Volume)
- 8.5. Market Analysis, Insights and Forecast - by Price Trend Analysis
- 9. Europe Military 3D and 4D Printing Industry Analysis, Insights and Forecast, 2020-2032
- 9.1. Market Analysis, Insights and Forecast - by Production Analysis
- 9.2. Market Analysis, Insights and Forecast - by Consumption Analysis
- 9.3. Market Analysis, Insights and Forecast - by Import Market Analysis (Value & Volume)
- 9.4. Market Analysis, Insights and Forecast - by Export Market Analysis (Value & Volume)
- 9.5. Market Analysis, Insights and Forecast - by Price Trend Analysis
- 10. Middle East & Africa Military 3D and 4D Printing Industry Analysis, Insights and Forecast, 2020-2032
- 10.1. Market Analysis, Insights and Forecast - by Production Analysis
- 10.2. Market Analysis, Insights and Forecast - by Consumption Analysis
- 10.3. Market Analysis, Insights and Forecast - by Import Market Analysis (Value & Volume)
- 10.4. Market Analysis, Insights and Forecast - by Export Market Analysis (Value & Volume)
- 10.5. Market Analysis, Insights and Forecast - by Price Trend Analysis
- 11. Asia Pacific Military 3D and 4D Printing Industry Analysis, Insights and Forecast, 2020-2032
- 11.1. Market Analysis, Insights and Forecast - by Production Analysis
- 11.2. Market Analysis, Insights and Forecast - by Consumption Analysis
- 11.3. Market Analysis, Insights and Forecast - by Import Market Analysis (Value & Volume)
- 11.4. Market Analysis, Insights and Forecast - by Export Market Analysis (Value & Volume)
- 11.5. Market Analysis, Insights and Forecast - by Price Trend Analysis
- 12. Competitive Analysis
- 12.1. Company Profiles
- 12.1.1 3T Additive Manufacturing Ltd
- 12.1.1.1. Company Overview
- 12.1.1.2. Products
- 12.1.1.3. Company Financials
- 12.1.1.4. SWOT Analysis
- 12.1.2 Markforged Inc
- 12.1.2.1. Company Overview
- 12.1.2.2. Products
- 12.1.2.3. Company Financials
- 12.1.2.4. SWOT Analysis
- 12.1.3 Norsk Titanium US Inc
- 12.1.3.1. Company Overview
- 12.1.3.2. Products
- 12.1.3.3. Company Financials
- 12.1.3.4. SWOT Analysis
- 12.1.4 Engineering & Manufacturing Services Inc
- 12.1.4.1. Company Overview
- 12.1.4.2. Products
- 12.1.4.3. Company Financials
- 12.1.4.4. SWOT Analysis
- 12.1.5 3D Systems Corporation
- 12.1.5.1. Company Overview
- 12.1.5.2. Products
- 12.1.5.3. Company Financials
- 12.1.5.4. SWOT Analysis
- 12.1.6 EOS Gmbh
- 12.1.6.1. Company Overview
- 12.1.6.2. Products
- 12.1.6.3. Company Financials
- 12.1.6.4. SWOT Analysis
- 12.1.7 Nano Dimensions Ltd
- 12.1.7.1. Company Overview
- 12.1.7.2. Products
- 12.1.7.3. Company Financials
- 12.1.7.4. SWOT Analysis
- 12.1.8 Stratasys Ltd
- 12.1.8.1. Company Overview
- 12.1.8.2. Products
- 12.1.8.3. Company Financials
- 12.1.8.4. SWOT Analysis
- 12.1.9 ExOne Company
- 12.1.9.1. Company Overview
- 12.1.9.2. Products
- 12.1.9.3. Company Financials
- 12.1.9.4. SWOT Analysis
- 12.1.1 3T Additive Manufacturing Ltd
- 12.2. Market Entropy
- 12.2.1 Company's Key Areas Served
- 12.2.2 Recent Developments
- 12.3. Company Market Share Analysis 2025
- 12.3.1 Top 5 Companies Market Share Analysis
- 12.3.2 Top 3 Companies Market Share Analysis
- 12.4. List of Potential Customers
- 13. Research Methodology
List of Figures
- Figure 1: Global Military 3D and 4D Printing Industry Revenue Breakdown (million, %) by Region 2025 & 2033
- Figure 2: North America Military 3D and 4D Printing Industry Revenue (million), by Production Analysis 2025 & 2033
- Figure 3: North America Military 3D and 4D Printing Industry Revenue Share (%), by Production Analysis 2025 & 2033
- Figure 4: North America Military 3D and 4D Printing Industry Revenue (million), by Consumption Analysis 2025 & 2033
- Figure 5: North America Military 3D and 4D Printing Industry Revenue Share (%), by Consumption Analysis 2025 & 2033
- Figure 6: North America Military 3D and 4D Printing Industry Revenue (million), by Import Market Analysis (Value & Volume) 2025 & 2033
- Figure 7: North America Military 3D and 4D Printing Industry Revenue Share (%), by Import Market Analysis (Value & Volume) 2025 & 2033
- Figure 8: North America Military 3D and 4D Printing Industry Revenue (million), by Export Market Analysis (Value & Volume) 2025 & 2033
- Figure 9: North America Military 3D and 4D Printing Industry Revenue Share (%), by Export Market Analysis (Value & Volume) 2025 & 2033
- Figure 10: North America Military 3D and 4D Printing Industry Revenue (million), by Price Trend Analysis 2025 & 2033
- Figure 11: North America Military 3D and 4D Printing Industry Revenue Share (%), by Price Trend Analysis 2025 & 2033
- Figure 12: North America Military 3D and 4D Printing Industry Revenue (million), by Country 2025 & 2033
- Figure 13: North America Military 3D and 4D Printing Industry Revenue Share (%), by Country 2025 & 2033
- Figure 14: South America Military 3D and 4D Printing Industry Revenue (million), by Production Analysis 2025 & 2033
- Figure 15: South America Military 3D and 4D Printing Industry Revenue Share (%), by Production Analysis 2025 & 2033
- Figure 16: South America Military 3D and 4D Printing Industry Revenue (million), by Consumption Analysis 2025 & 2033
- Figure 17: South America Military 3D and 4D Printing Industry Revenue Share (%), by Consumption Analysis 2025 & 2033
- Figure 18: South America Military 3D and 4D Printing Industry Revenue (million), by Import Market Analysis (Value & Volume) 2025 & 2033
- Figure 19: South America Military 3D and 4D Printing Industry Revenue Share (%), by Import Market Analysis (Value & Volume) 2025 & 2033
- Figure 20: South America Military 3D and 4D Printing Industry Revenue (million), by Export Market Analysis (Value & Volume) 2025 & 2033
- Figure 21: South America Military 3D and 4D Printing Industry Revenue Share (%), by Export Market Analysis (Value & Volume) 2025 & 2033
- Figure 22: South America Military 3D and 4D Printing Industry Revenue (million), by Price Trend Analysis 2025 & 2033
- Figure 23: South America Military 3D and 4D Printing Industry Revenue Share (%), by Price Trend Analysis 2025 & 2033
- Figure 24: South America Military 3D and 4D Printing Industry Revenue (million), by Country 2025 & 2033
- Figure 25: South America Military 3D and 4D Printing Industry Revenue Share (%), by Country 2025 & 2033
- Figure 26: Europe Military 3D and 4D Printing Industry Revenue (million), by Production Analysis 2025 & 2033
- Figure 27: Europe Military 3D and 4D Printing Industry Revenue Share (%), by Production Analysis 2025 & 2033
- Figure 28: Europe Military 3D and 4D Printing Industry Revenue (million), by Consumption Analysis 2025 & 2033
- Figure 29: Europe Military 3D and 4D Printing Industry Revenue Share (%), by Consumption Analysis 2025 & 2033
- Figure 30: Europe Military 3D and 4D Printing Industry Revenue (million), by Import Market Analysis (Value & Volume) 2025 & 2033
- Figure 31: Europe Military 3D and 4D Printing Industry Revenue Share (%), by Import Market Analysis (Value & Volume) 2025 & 2033
- Figure 32: Europe Military 3D and 4D Printing Industry Revenue (million), by Export Market Analysis (Value & Volume) 2025 & 2033
- Figure 33: Europe Military 3D and 4D Printing Industry Revenue Share (%), by Export Market Analysis (Value & Volume) 2025 & 2033
- Figure 34: Europe Military 3D and 4D Printing Industry Revenue (million), by Price Trend Analysis 2025 & 2033
- Figure 35: Europe Military 3D and 4D Printing Industry Revenue Share (%), by Price Trend Analysis 2025 & 2033
- Figure 36: Europe Military 3D and 4D Printing Industry Revenue (million), by Country 2025 & 2033
- Figure 37: Europe Military 3D and 4D Printing Industry Revenue Share (%), by Country 2025 & 2033
- Figure 38: Middle East & Africa Military 3D and 4D Printing Industry Revenue (million), by Production Analysis 2025 & 2033
- Figure 39: Middle East & Africa Military 3D and 4D Printing Industry Revenue Share (%), by Production Analysis 2025 & 2033
- Figure 40: Middle East & Africa Military 3D and 4D Printing Industry Revenue (million), by Consumption Analysis 2025 & 2033
- Figure 41: Middle East & Africa Military 3D and 4D Printing Industry Revenue Share (%), by Consumption Analysis 2025 & 2033
- Figure 42: Middle East & Africa Military 3D and 4D Printing Industry Revenue (million), by Import Market Analysis (Value & Volume) 2025 & 2033
- Figure 43: Middle East & Africa Military 3D and 4D Printing Industry Revenue Share (%), by Import Market Analysis (Value & Volume) 2025 & 2033
- Figure 44: Middle East & Africa Military 3D and 4D Printing Industry Revenue (million), by Export Market Analysis (Value & Volume) 2025 & 2033
- Figure 45: Middle East & Africa Military 3D and 4D Printing Industry Revenue Share (%), by Export Market Analysis (Value & Volume) 2025 & 2033
- Figure 46: Middle East & Africa Military 3D and 4D Printing Industry Revenue (million), by Price Trend Analysis 2025 & 2033
- Figure 47: Middle East & Africa Military 3D and 4D Printing Industry Revenue Share (%), by Price Trend Analysis 2025 & 2033
- Figure 48: Middle East & Africa Military 3D and 4D Printing Industry Revenue (million), by Country 2025 & 2033
- Figure 49: Middle East & Africa Military 3D and 4D Printing Industry Revenue Share (%), by Country 2025 & 2033
- Figure 50: Asia Pacific Military 3D and 4D Printing Industry Revenue (million), by Production Analysis 2025 & 2033
- Figure 51: Asia Pacific Military 3D and 4D Printing Industry Revenue Share (%), by Production Analysis 2025 & 2033
- Figure 52: Asia Pacific Military 3D and 4D Printing Industry Revenue (million), by Consumption Analysis 2025 & 2033
- Figure 53: Asia Pacific Military 3D and 4D Printing Industry Revenue Share (%), by Consumption Analysis 2025 & 2033
- Figure 54: Asia Pacific Military 3D and 4D Printing Industry Revenue (million), by Import Market Analysis (Value & Volume) 2025 & 2033
- Figure 55: Asia Pacific Military 3D and 4D Printing Industry Revenue Share (%), by Import Market Analysis (Value & Volume) 2025 & 2033
- Figure 56: Asia Pacific Military 3D and 4D Printing Industry Revenue (million), by Export Market Analysis (Value & Volume) 2025 & 2033
- Figure 57: Asia Pacific Military 3D and 4D Printing Industry Revenue Share (%), by Export Market Analysis (Value & Volume) 2025 & 2033
- Figure 58: Asia Pacific Military 3D and 4D Printing Industry Revenue (million), by Price Trend Analysis 2025 & 2033
- Figure 59: Asia Pacific Military 3D and 4D Printing Industry Revenue Share (%), by Price Trend Analysis 2025 & 2033
- Figure 60: Asia Pacific Military 3D and 4D Printing Industry Revenue (million), by Country 2025 & 2033
- Figure 61: Asia Pacific Military 3D and 4D Printing Industry Revenue Share (%), by Country 2025 & 2033
List of Tables
- Table 1: Global Military 3D and 4D Printing Industry Revenue million Forecast, by Production Analysis 2020 & 2033
- Table 2: Global Military 3D and 4D Printing Industry Revenue million Forecast, by Consumption Analysis 2020 & 2033
- Table 3: Global Military 3D and 4D Printing Industry Revenue million Forecast, by Import Market Analysis (Value & Volume) 2020 & 2033
- Table 4: Global Military 3D and 4D Printing Industry Revenue million Forecast, by Export Market Analysis (Value & Volume) 2020 & 2033
- Table 5: Global Military 3D and 4D Printing Industry Revenue million Forecast, by Price Trend Analysis 2020 & 2033
- Table 6: Global Military 3D and 4D Printing Industry Revenue million Forecast, by Region 2020 & 2033
- Table 7: Global Military 3D and 4D Printing Industry Revenue million Forecast, by Production Analysis 2020 & 2033
- Table 8: Global Military 3D and 4D Printing Industry Revenue million Forecast, by Consumption Analysis 2020 & 2033
- Table 9: Global Military 3D and 4D Printing Industry Revenue million Forecast, by Import Market Analysis (Value & Volume) 2020 & 2033
- Table 10: Global Military 3D and 4D Printing Industry Revenue million Forecast, by Export Market Analysis (Value & Volume) 2020 & 2033
- Table 11: Global Military 3D and 4D Printing Industry Revenue million Forecast, by Price Trend Analysis 2020 & 2033
- Table 12: Global Military 3D and 4D Printing Industry Revenue million Forecast, by Country 2020 & 2033
- Table 13: United States Military 3D and 4D Printing Industry Revenue (million) Forecast, by Application 2020 & 2033
- Table 14: Canada Military 3D and 4D Printing Industry Revenue (million) Forecast, by Application 2020 & 2033
- Table 15: Mexico Military 3D and 4D Printing Industry Revenue (million) Forecast, by Application 2020 & 2033
- Table 16: Global Military 3D and 4D Printing Industry Revenue million Forecast, by Production Analysis 2020 & 2033
- Table 17: Global Military 3D and 4D Printing Industry Revenue million Forecast, by Consumption Analysis 2020 & 2033
- Table 18: Global Military 3D and 4D Printing Industry Revenue million Forecast, by Import Market Analysis (Value & Volume) 2020 & 2033
- Table 19: Global Military 3D and 4D Printing Industry Revenue million Forecast, by Export Market Analysis (Value & Volume) 2020 & 2033
- Table 20: Global Military 3D and 4D Printing Industry Revenue million Forecast, by Price Trend Analysis 2020 & 2033
- Table 21: Global Military 3D and 4D Printing Industry Revenue million Forecast, by Country 2020 & 2033
- Table 22: Brazil Military 3D and 4D Printing Industry Revenue (million) Forecast, by Application 2020 & 2033
- Table 23: Argentina Military 3D and 4D Printing Industry Revenue (million) Forecast, by Application 2020 & 2033
- Table 24: Rest of South America Military 3D and 4D Printing Industry Revenue (million) Forecast, by Application 2020 & 2033
- Table 25: Global Military 3D and 4D Printing Industry Revenue million Forecast, by Production Analysis 2020 & 2033
- Table 26: Global Military 3D and 4D Printing Industry Revenue million Forecast, by Consumption Analysis 2020 & 2033
- Table 27: Global Military 3D and 4D Printing Industry Revenue million Forecast, by Import Market Analysis (Value & Volume) 2020 & 2033
- Table 28: Global Military 3D and 4D Printing Industry Revenue million Forecast, by Export Market Analysis (Value & Volume) 2020 & 2033
- Table 29: Global Military 3D and 4D Printing Industry Revenue million Forecast, by Price Trend Analysis 2020 & 2033
- Table 30: Global Military 3D and 4D Printing Industry Revenue million Forecast, by Country 2020 & 2033
- Table 31: United Kingdom Military 3D and 4D Printing Industry Revenue (million) Forecast, by Application 2020 & 2033
- Table 32: Germany Military 3D and 4D Printing Industry Revenue (million) Forecast, by Application 2020 & 2033
- Table 33: France Military 3D and 4D Printing Industry Revenue (million) Forecast, by Application 2020 & 2033
- Table 34: Italy Military 3D and 4D Printing Industry Revenue (million) Forecast, by Application 2020 & 2033
- Table 35: Spain Military 3D and 4D Printing Industry Revenue (million) Forecast, by Application 2020 & 2033
- Table 36: Russia Military 3D and 4D Printing Industry Revenue (million) Forecast, by Application 2020 & 2033
- Table 37: Benelux Military 3D and 4D Printing Industry Revenue (million) Forecast, by Application 2020 & 2033
- Table 38: Nordics Military 3D and 4D Printing Industry Revenue (million) Forecast, by Application 2020 & 2033
- Table 39: Rest of Europe Military 3D and 4D Printing Industry Revenue (million) Forecast, by Application 2020 & 2033
- Table 40: Global Military 3D and 4D Printing Industry Revenue million Forecast, by Production Analysis 2020 & 2033
- Table 41: Global Military 3D and 4D Printing Industry Revenue million Forecast, by Consumption Analysis 2020 & 2033
- Table 42: Global Military 3D and 4D Printing Industry Revenue million Forecast, by Import Market Analysis (Value & Volume) 2020 & 2033
- Table 43: Global Military 3D and 4D Printing Industry Revenue million Forecast, by Export Market Analysis (Value & Volume) 2020 & 2033
- Table 44: Global Military 3D and 4D Printing Industry Revenue million Forecast, by Price Trend Analysis 2020 & 2033
- Table 45: Global Military 3D and 4D Printing Industry Revenue million Forecast, by Country 2020 & 2033
- Table 46: Turkey Military 3D and 4D Printing Industry Revenue (million) Forecast, by Application 2020 & 2033
- Table 47: Israel Military 3D and 4D Printing Industry Revenue (million) Forecast, by Application 2020 & 2033
- Table 48: GCC Military 3D and 4D Printing Industry Revenue (million) Forecast, by Application 2020 & 2033
- Table 49: North Africa Military 3D and 4D Printing Industry Revenue (million) Forecast, by Application 2020 & 2033
- Table 50: South Africa Military 3D and 4D Printing Industry Revenue (million) Forecast, by Application 2020 & 2033
- Table 51: Rest of Middle East & Africa Military 3D and 4D Printing Industry Revenue (million) Forecast, by Application 2020 & 2033
- Table 52: Global Military 3D and 4D Printing Industry Revenue million Forecast, by Production Analysis 2020 & 2033
- Table 53: Global Military 3D and 4D Printing Industry Revenue million Forecast, by Consumption Analysis 2020 & 2033
- Table 54: Global Military 3D and 4D Printing Industry Revenue million Forecast, by Import Market Analysis (Value & Volume) 2020 & 2033
- Table 55: Global Military 3D and 4D Printing Industry Revenue million Forecast, by Export Market Analysis (Value & Volume) 2020 & 2033
- Table 56: Global Military 3D and 4D Printing Industry Revenue million Forecast, by Price Trend Analysis 2020 & 2033
- Table 57: Global Military 3D and 4D Printing Industry Revenue million Forecast, by Country 2020 & 2033
- Table 58: China Military 3D and 4D Printing Industry Revenue (million) Forecast, by Application 2020 & 2033
- Table 59: India Military 3D and 4D Printing Industry Revenue (million) Forecast, by Application 2020 & 2033
- Table 60: Japan Military 3D and 4D Printing Industry Revenue (million) Forecast, by Application 2020 & 2033
- Table 61: South Korea Military 3D and 4D Printing Industry Revenue (million) Forecast, by Application 2020 & 2033
- Table 62: ASEAN Military 3D and 4D Printing Industry Revenue (million) Forecast, by Application 2020 & 2033
- Table 63: Oceania Military 3D and 4D Printing Industry Revenue (million) Forecast, by Application 2020 & 2033
- Table 64: Rest of Asia Pacific Military 3D and 4D Printing Industry Revenue (million) Forecast, by Application 2020 & 2033
Frequently Asked Questions
1. What is the projected Compound Annual Growth Rate (CAGR) of the Military 3D and 4D Printing Industry?
The projected CAGR is approximately 35.8%.
2. Which companies are prominent players in the Military 3D and 4D Printing Industry?
Key companies in the market include 3T Additive Manufacturing Ltd, Markforged Inc, Norsk Titanium US Inc, Engineering & Manufacturing Services Inc, 3D Systems Corporation, EOS Gmbh, Nano Dimensions Ltd, Stratasys Ltd, ExOne Company.
3. What are the main segments of the Military 3D and 4D Printing Industry?
The market segments include Production Analysis, Consumption Analysis, Import Market Analysis (Value & Volume), Export Market Analysis (Value & Volume), Price Trend Analysis.
4. Can you provide details about the market size?
The market size is estimated to be USD 156.8 million as of 2022.
5. What are some drivers contributing to market growth?
N/A
6. What are the notable trends driving market growth?
Airborne Segment Held Highest Shares in the Market.
7. Are there any restraints impacting market growth?
N/A
8. Can you provide examples of recent developments in the market?
November 2022: 3D Systems and ALM announced their partnership to expand access to industry-leading 3D printing materials. The companies plan to accelerate material adoption and drive additive manufacturing industry growth by providing access to industry-leading 3D printing materials.
9. What pricing options are available for accessing the report?
Pricing options include single-user, multi-user, and enterprise licenses priced at USD 4750, USD 5250, and USD 8750 respectively.
10. Is the market size provided in terms of value or volume?
The market size is provided in terms of value, measured in million.
11. Are there any specific market keywords associated with the report?
Yes, the market keyword associated with the report is "Military 3D and 4D Printing Industry," which aids in identifying and referencing the specific market segment covered.
12. How do I determine which pricing option suits my needs best?
The pricing options vary based on user requirements and access needs. Individual users may opt for single-user licenses, while businesses requiring broader access may choose multi-user or enterprise licenses for cost-effective access to the report.
13. Are there any additional resources or data provided in the Military 3D and 4D Printing Industry report?
While the report offers comprehensive insights, it's advisable to review the specific contents or supplementary materials provided to ascertain if additional resources or data are available.
14. How can I stay updated on further developments or reports in the Military 3D and 4D Printing Industry?
To stay informed about further developments, trends, and reports in the Military 3D and 4D Printing Industry, consider subscribing to industry newsletters, following relevant companies and organizations, or regularly checking reputable industry news sources and publications.
Methodology
Step 1 - Identification of Relevant Samples Size from Population Database


Step 2 - Approaches for Defining Global Market Size (Value, Volume* & Price*)

Note*: In applicable scenarios
Step 3 - Data Sources
Primary Research
- Web Analytics
- Survey Reports
- Research Institute
- Latest Research Reports
- Opinion Leaders
Secondary Research
- Annual Reports
- White Paper
- Latest Press Release
- Industry Association
- Paid Database
- Investor Presentations

Step 4 - Data Triangulation
Involves using different sources of information in order to increase the validity of a study
These sources are likely to be stakeholders in a program - participants, other researchers, program staff, other community members, and so on.
Then we put all data in single framework & apply various statistical tools to find out the dynamic on the market.
During the analysis stage, feedback from the stakeholder groups would be compared to determine areas of agreement as well as areas of divergence