

Key Insights
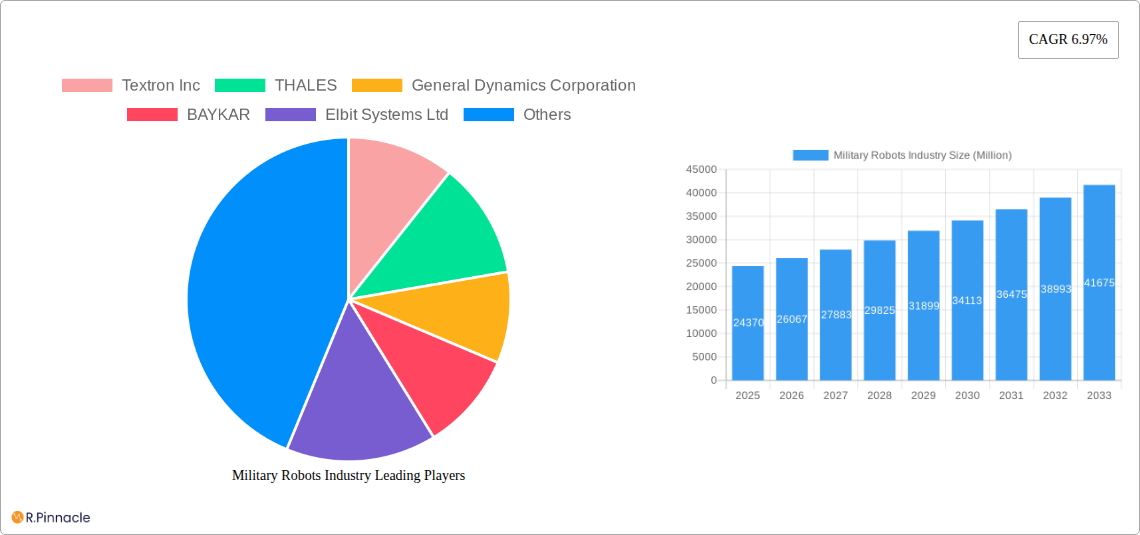
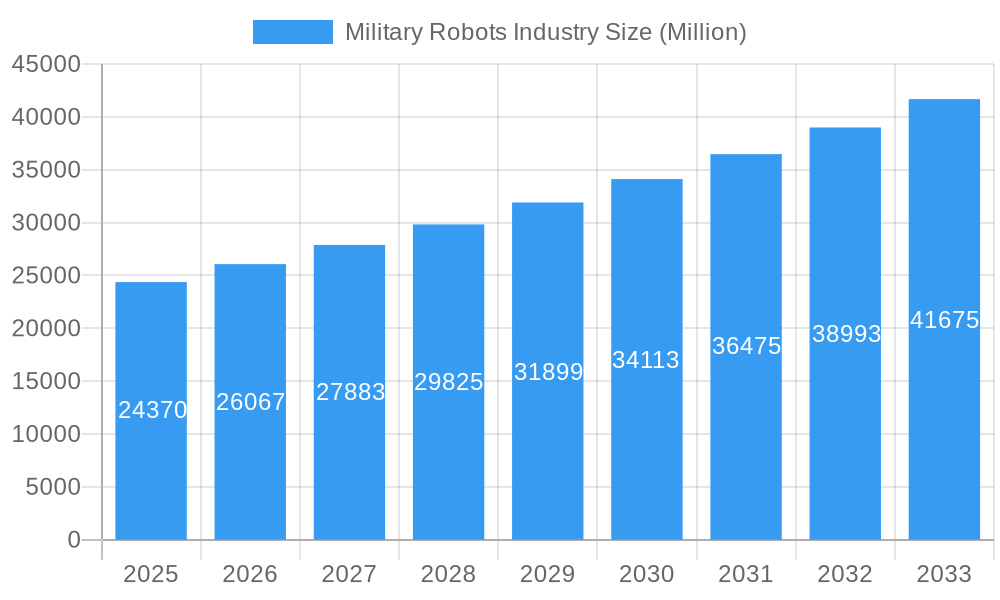
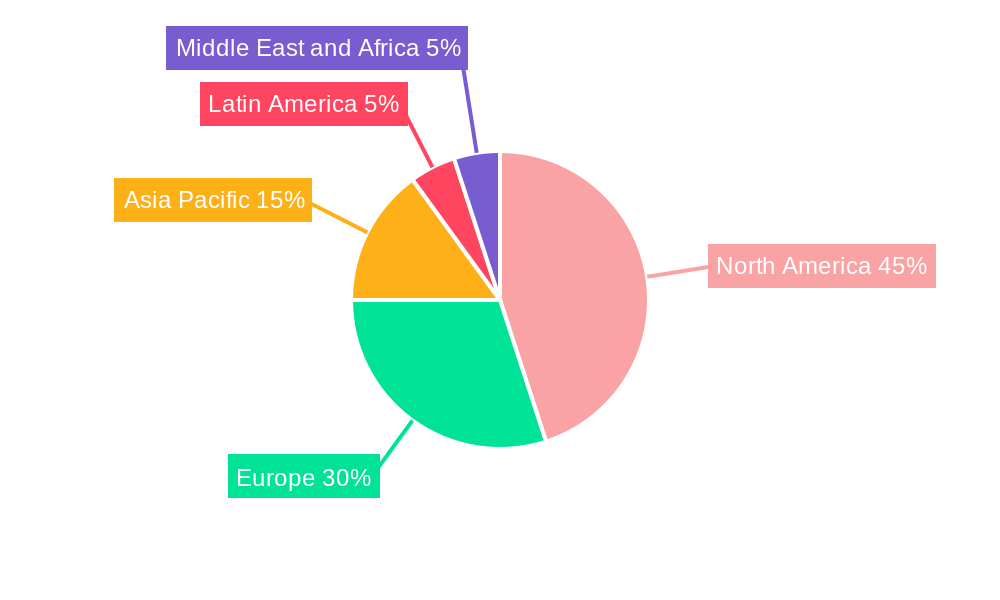
The Military Robots market, valued at $24.37 billion in 2025, is projected to experience robust growth, driven by increasing demand for unmanned systems in defense operations. A Compound Annual Growth Rate (CAGR) of 6.97% from 2025 to 2033 indicates a significant expansion, reaching an estimated $40 billion by 2033. This growth is fueled by several key factors: the rising adoption of autonomous and remotely operated systems to minimize human casualties, advancements in artificial intelligence and robotics enhancing operational capabilities, and escalating geopolitical tensions leading to increased defense spending globally. The market segmentation reveals significant potential across various platforms (land, marine, airborne) and operational modes (human-operated, autonomous). Autonomous systems are expected to witness particularly rapid growth, driven by continuous technological advancements and decreasing costs. The prominent players like Textron, Thales, and Lockheed Martin are heavily investing in R&D, fostering innovation and competition within this dynamic sector. Regional analysis reveals that North America and Europe currently dominate the market, but the Asia-Pacific region is expected to show significant growth due to increased defense budgets and technological advancements in countries like China and India.
Military Robots Industry Market Size (In Billion)
The market’s expansion is further influenced by the increasing focus on enhancing situational awareness through improved sensor technologies and data analytics, enabling more effective decision-making in complex military scenarios. Challenges remain, such as regulatory hurdles surrounding the deployment of autonomous weapons systems, ethical concerns regarding their usage, and the need for robust cybersecurity measures to protect against potential vulnerabilities. However, ongoing technological advancements in areas like swarm robotics, improved navigation systems, and advanced AI algorithms are expected to overcome these challenges and further propel market growth. The market landscape is characterized by intense competition among major defense contractors, leading to continuous innovation and the development of more sophisticated and capable military robots.
Military Robots Industry Company Market Share
Military Robots Industry Report: 2019-2033 Forecast
This comprehensive report provides an in-depth analysis of the Military Robots Industry, projecting robust growth from 2025 to 2033. We analyze market structure, dynamics, leading players, and emerging opportunities, offering actionable insights for industry professionals and investors. The report covers a historical period of 2019-2024, with 2025 serving as the base and estimated year, and forecasts extending to 2033. The total market size is estimated at xx Million in 2025, with a projected CAGR of xx% during the forecast period.
Military Robots Industry Market Structure & Innovation Trends
The Military Robots Industry is characterized by a moderately concentrated market structure, with key players such as Textron Inc, Thales, General Dynamics Corporation, and Lockheed Martin Corporation holding significant market share. The industry is driven by technological advancements in AI, robotics, and sensor technologies, pushing the development of more autonomous and sophisticated robots for diverse military applications.
- Market Concentration: The top 5 players account for approximately xx% of the global market share (2025).
- Innovation Drivers: Advancements in AI, autonomous navigation, and sensor integration are key drivers. Miniaturization and enhanced payload capabilities are also significant factors.
- Regulatory Frameworks: Stringent regulations surrounding the development and deployment of autonomous weapon systems are shaping industry dynamics. Export controls and ethical considerations significantly influence market growth.
- Product Substitutes: Traditional military equipment and personnel remain substitutes, but the increasing capabilities of military robots are gradually reducing reliance on these alternatives.
- End-User Demographics: Major end-users include national armed forces, defense agencies, and specialized military units globally.
- M&A Activities: The industry has witnessed several mergers and acquisitions (M&A) in recent years, with deal values exceeding xx Million in the period 2019-2024, mostly focused on technology acquisition and consolidation.
Military Robots Industry Market Dynamics & Trends
The Military Robots market is experiencing significant growth fueled by escalating defense budgets globally, the demand for enhanced battlefield capabilities, and the increasing adoption of autonomous systems. Technological disruptions, such as the integration of AI and advanced sensors, are revolutionizing military robot capabilities, creating new opportunities and enhancing operational efficiency. Consumer preferences (i.e., military end-users) are shifting towards systems offering increased autonomy, improved reliability, and reduced human intervention. Intense competition among key players drives innovation and necessitates continuous product improvement.
Dominant Regions & Segments in Military Robots Industry
The North American market currently holds the largest share in the military robots industry, driven by substantial defense spending, a robust technological ecosystem, and active government support for research and development. Within segments:
- Platform: The Airborne segment dominates, driven by the increased demand for unmanned aerial vehicles (UAVs) for surveillance, reconnaissance, and strike missions. The Land segment is experiencing strong growth, driven by the need for robots in ground-based operations. The Marine segment shows moderate growth, driven by the demand for unmanned underwater vehicles (UUVs).
- Mode of Operation: The Human Operated segment currently holds a larger market share, while the Autonomous segment is experiencing rapid growth, driven by technological advancements and the potential for reduced human risk.
Key Drivers (North America):
- High defense expenditure
- Strong technological base
- Supportive government policies
- Presence of major industry players
Military Robots Industry Product Innovations
Recent innovations include the development of highly maneuverable, autonomous ground robots capable of operating in complex terrains and carrying heavier payloads. The integration of AI and machine learning enhances their decision-making capabilities, enabling them to operate more effectively in challenging environments. These advancements translate to greater battlefield effectiveness and reduced risk to human personnel, significantly improving market fit.
Report Scope & Segmentation Analysis
This report segments the military robots market based on platform (Land, Marine, Airborne) and mode of operation (Human Operated, Autonomous). Each segment offers unique growth prospects and competitive dynamics. The Airborne segment is expected to exhibit the highest CAGR, while the Autonomous mode of operation segment shows the most promising growth trajectory. Market size and competitive landscapes are analyzed for each segment individually.
- Land: xx Million in 2025, xx% CAGR.
- Marine: xx Million in 2025, xx% CAGR.
- Airborne: xx Million in 2025, xx% CAGR.
- Human Operated: xx Million in 2025, xx% CAGR.
- Autonomous: xx Million in 2025, xx% CAGR.
Key Drivers of Military Robots Industry Growth
Technological advancements, increasing defense budgets, and the need for enhanced battlefield capabilities are the key drivers. The development of AI-powered autonomous systems, improved sensor technologies, and miniaturization are significantly expanding the operational capabilities of military robots. Government initiatives supporting R&D and the adoption of military robotics also contribute significantly.
Challenges in the Military Robots Industry Sector
Regulatory hurdles related to the deployment of autonomous weapon systems, supply chain disruptions affecting the procurement of critical components, and intense competition from established players and new entrants pose significant challenges. The high cost of development and integration, along with cybersecurity concerns, also limit market expansion. These factors cumulatively reduce market penetration by approximately xx% (projected).
Emerging Opportunities in Military Robots Industry
Emerging opportunities lie in the development of more sophisticated AI-powered robots, the integration of advanced sensor technologies, and the expansion into new applications such as logistics and reconnaissance. The increasing adoption of swarm robotics and the development of collaborative human-robot teams offer significant potential. New markets in developing nations also represent significant growth opportunities.
Leading Players in the Military Robots Industry Market
- Textron Inc (https://www.textron.com/)
- THALES (https://www.thalesgroup.com/)
- General Dynamics Corporation (https://www.generaldynamics.com/)
- BAYKAR
- Elbit Systems Ltd (https://www.elbitsystems.com/)
- Lockheed Martin Corporation (https://www.lockheedmartin.com/)
- QinetiQ Group PLC (https://www.qinetiq.com/)
- Cobham Ltd
- AeroVironment Inc (https://www.avinc.com/)
- IAI
- Aeronautics Ltd
- BAE Systems plc (https://www.baesystems.com/)
- Northrop Grumman Corporation (https://www.northropgrumman.com/)
- Saab AB (https://www.saab.com/)
- Teledyne FLIR LLC (https://www.teledyneflir.com/)
Key Developments in Military Robots Industry
- October 2023: The US Army initiates the development of integrated formations of robots and human operators, aiming to optimize battlefield coordination.
- July 2022: Teledyne FLIR Defense secures a USD 62.1 Million contract for the supply of 500 Centaur multi-mission robots to the US Armed Services.
- January 2022: China unveils a large electrically powered quadruped robot for military logistics and reconnaissance.
Future Outlook for Military Robots Industry Market
The Military Robots market is poised for continued growth, driven by ongoing technological advancements, increasing defense spending, and the expanding range of applications. Strategic partnerships, investments in R&D, and the development of innovative solutions will further propel market expansion and create significant opportunities for key players. The integration of AI and autonomous capabilities will be a major factor in shaping future market dynamics.
Military Robots Industry Segmentation
- 1. Production Analysis
- 2. Consumption Analysis
- 3. Import Market Analysis (Value & Volume)
- 4. Export Market Analysis (Value & Volume)
- 5. Price Trend Analysis
Military Robots Industry Segmentation By Geography
-
1. North America
- 1.1. United States
- 1.2. Canada
- 1.3. Mexico
-
2. South America
- 2.1. Brazil
- 2.2. Argentina
- 2.3. Rest of South America
-
3. Europe
- 3.1. United Kingdom
- 3.2. Germany
- 3.3. France
- 3.4. Italy
- 3.5. Spain
- 3.6. Russia
- 3.7. Benelux
- 3.8. Nordics
- 3.9. Rest of Europe
-
4. Middle East & Africa
- 4.1. Turkey
- 4.2. Israel
- 4.3. GCC
- 4.4. North Africa
- 4.5. South Africa
- 4.6. Rest of Middle East & Africa
-
5. Asia Pacific
- 5.1. China
- 5.2. India
- 5.3. Japan
- 5.4. South Korea
- 5.5. ASEAN
- 5.6. Oceania
- 5.7. Rest of Asia Pacific
Military Robots Industry Regional Market Share
Geographic Coverage of Military Robots Industry
Military Robots Industry REPORT HIGHLIGHTS
| Aspects | Details |
|---|---|
| Study Period | 2020-2034 |
| Base Year | 2025 |
| Estimated Year | 2026 |
| Forecast Period | 2026-2034 |
| Historical Period | 2020-2025 |
| Growth Rate | CAGR of 6.97% from 2020-2034 |
| Segmentation |
|
Table of Contents
- 1. Introduction
- 1.1. Research Scope
- 1.2. Market Segmentation
- 1.3. Research Objective
- 1.4. Definitions and Assumptions
- 2. Executive Summary
- 2.1. Market Snapshot
- 3. Market Dynamics
- 3.1. Market Drivers
- 3.2. Market Restrains
- 3.3. Market Trends
- 3.4. Market Opportunities
- 4. Market Factor Analysis
- 4.1. Porters Five Forces
- 4.1.1. Bargaining Power of Suppliers
- 4.1.2. Bargaining Power of Buyers
- 4.1.3. Threat of New Entrants
- 4.1.4. Threat of Substitutes
- 4.1.5. Competitive Rivalry
- 4.2. PESTEL analysis
- 4.3. BCG Analysis
- 4.3.1. Stars (High Growth, High Market Share)
- 4.3.2. Cash Cows (Low Growth, High Market Share)
- 4.3.3. Question Mark (High Growth, Low Market Share)
- 4.3.4. Dogs (Low Growth, Low Market Share)
- 4.4. Ansoff Matrix Analysis
- 4.5. Supply Chain Analysis
- 4.6. Regulatory Landscape
- 4.7. Current Market Potential and Opportunity Assessment (TAM–SAM–SOM Framework)
- 4.8. PRI Analyst Note
- 4.1. Porters Five Forces
- 5. Market Analysis, Insights and Forecast 2021-2033
- 5.1. Market Analysis, Insights and Forecast - by Production Analysis
- 5.2. Market Analysis, Insights and Forecast - by Consumption Analysis
- 5.3. Market Analysis, Insights and Forecast - by Import Market Analysis (Value & Volume)
- 5.4. Market Analysis, Insights and Forecast - by Export Market Analysis (Value & Volume)
- 5.5. Market Analysis, Insights and Forecast - by Price Trend Analysis
- 5.6. Market Analysis, Insights and Forecast - by Region
- 5.6.1. North America
- 5.6.2. South America
- 5.6.3. Europe
- 5.6.4. Middle East & Africa
- 5.6.5. Asia Pacific
- 6. Global Military Robots Industry Analysis, Insights and Forecast, 2021-2033
- 6.1. Market Analysis, Insights and Forecast - by Production Analysis
- 6.2. Market Analysis, Insights and Forecast - by Consumption Analysis
- 6.3. Market Analysis, Insights and Forecast - by Import Market Analysis (Value & Volume)
- 6.4. Market Analysis, Insights and Forecast - by Export Market Analysis (Value & Volume)
- 6.5. Market Analysis, Insights and Forecast - by Price Trend Analysis
- 7. North America Military Robots Industry Analysis, Insights and Forecast, 2020-2032
- 7.1. Market Analysis, Insights and Forecast - by Production Analysis
- 7.2. Market Analysis, Insights and Forecast - by Consumption Analysis
- 7.3. Market Analysis, Insights and Forecast - by Import Market Analysis (Value & Volume)
- 7.4. Market Analysis, Insights and Forecast - by Export Market Analysis (Value & Volume)
- 7.5. Market Analysis, Insights and Forecast - by Price Trend Analysis
- 8. South America Military Robots Industry Analysis, Insights and Forecast, 2020-2032
- 8.1. Market Analysis, Insights and Forecast - by Production Analysis
- 8.2. Market Analysis, Insights and Forecast - by Consumption Analysis
- 8.3. Market Analysis, Insights and Forecast - by Import Market Analysis (Value & Volume)
- 8.4. Market Analysis, Insights and Forecast - by Export Market Analysis (Value & Volume)
- 8.5. Market Analysis, Insights and Forecast - by Price Trend Analysis
- 9. Europe Military Robots Industry Analysis, Insights and Forecast, 2020-2032
- 9.1. Market Analysis, Insights and Forecast - by Production Analysis
- 9.2. Market Analysis, Insights and Forecast - by Consumption Analysis
- 9.3. Market Analysis, Insights and Forecast - by Import Market Analysis (Value & Volume)
- 9.4. Market Analysis, Insights and Forecast - by Export Market Analysis (Value & Volume)
- 9.5. Market Analysis, Insights and Forecast - by Price Trend Analysis
- 10. Middle East & Africa Military Robots Industry Analysis, Insights and Forecast, 2020-2032
- 10.1. Market Analysis, Insights and Forecast - by Production Analysis
- 10.2. Market Analysis, Insights and Forecast - by Consumption Analysis
- 10.3. Market Analysis, Insights and Forecast - by Import Market Analysis (Value & Volume)
- 10.4. Market Analysis, Insights and Forecast - by Export Market Analysis (Value & Volume)
- 10.5. Market Analysis, Insights and Forecast - by Price Trend Analysis
- 11. Asia Pacific Military Robots Industry Analysis, Insights and Forecast, 2020-2032
- 11.1. Market Analysis, Insights and Forecast - by Production Analysis
- 11.2. Market Analysis, Insights and Forecast - by Consumption Analysis
- 11.3. Market Analysis, Insights and Forecast - by Import Market Analysis (Value & Volume)
- 11.4. Market Analysis, Insights and Forecast - by Export Market Analysis (Value & Volume)
- 11.5. Market Analysis, Insights and Forecast - by Price Trend Analysis
- 12. Competitive Analysis
- 12.1. Company Profiles
- 12.1.1 Textron Inc
- 12.1.1.1. Company Overview
- 12.1.1.2. Products
- 12.1.1.3. Company Financials
- 12.1.1.4. SWOT Analysis
- 12.1.2 THALES
- 12.1.2.1. Company Overview
- 12.1.2.2. Products
- 12.1.2.3. Company Financials
- 12.1.2.4. SWOT Analysis
- 12.1.3 General Dynamics Corporation
- 12.1.3.1. Company Overview
- 12.1.3.2. Products
- 12.1.3.3. Company Financials
- 12.1.3.4. SWOT Analysis
- 12.1.4 BAYKAR
- 12.1.4.1. Company Overview
- 12.1.4.2. Products
- 12.1.4.3. Company Financials
- 12.1.4.4. SWOT Analysis
- 12.1.5 Elbit Systems Ltd
- 12.1.5.1. Company Overview
- 12.1.5.2. Products
- 12.1.5.3. Company Financials
- 12.1.5.4. SWOT Analysis
- 12.1.6 Lockheed Martin Corporation
- 12.1.6.1. Company Overview
- 12.1.6.2. Products
- 12.1.6.3. Company Financials
- 12.1.6.4. SWOT Analysis
- 12.1.7 QinetiQ Group PLC
- 12.1.7.1. Company Overview
- 12.1.7.2. Products
- 12.1.7.3. Company Financials
- 12.1.7.4. SWOT Analysis
- 12.1.8 Cobham Ltd
- 12.1.8.1. Company Overview
- 12.1.8.2. Products
- 12.1.8.3. Company Financials
- 12.1.8.4. SWOT Analysis
- 12.1.9 AeroVironment Inc
- 12.1.9.1. Company Overview
- 12.1.9.2. Products
- 12.1.9.3. Company Financials
- 12.1.9.4. SWOT Analysis
- 12.1.10 IAI
- 12.1.10.1. Company Overview
- 12.1.10.2. Products
- 12.1.10.3. Company Financials
- 12.1.10.4. SWOT Analysis
- 12.1.11 Aeronautics Ltd
- 12.1.11.1. Company Overview
- 12.1.11.2. Products
- 12.1.11.3. Company Financials
- 12.1.11.4. SWOT Analysis
- 12.1.12 BAE Systems plc
- 12.1.12.1. Company Overview
- 12.1.12.2. Products
- 12.1.12.3. Company Financials
- 12.1.12.4. SWOT Analysis
- 12.1.13 Northrop Grumman Corporation
- 12.1.13.1. Company Overview
- 12.1.13.2. Products
- 12.1.13.3. Company Financials
- 12.1.13.4. SWOT Analysis
- 12.1.14 Saab AB
- 12.1.14.1. Company Overview
- 12.1.14.2. Products
- 12.1.14.3. Company Financials
- 12.1.14.4. SWOT Analysis
- 12.1.15 Teledyne FLIR LLC
- 12.1.15.1. Company Overview
- 12.1.15.2. Products
- 12.1.15.3. Company Financials
- 12.1.15.4. SWOT Analysis
- 12.1.1 Textron Inc
- 12.2. Market Entropy
- 12.2.1 Company's Key Areas Served
- 12.2.2 Recent Developments
- 12.3. Company Market Share Analysis 2025
- 12.3.1 Top 5 Companies Market Share Analysis
- 12.3.2 Top 3 Companies Market Share Analysis
- 12.4. List of Potential Customers
- 13. Research Methodology
List of Figures
- Figure 1: Global Military Robots Industry Revenue Breakdown (Million, %) by Region 2025 & 2033
- Figure 2: North America Military Robots Industry Revenue (Million), by Production Analysis 2025 & 2033
- Figure 3: North America Military Robots Industry Revenue Share (%), by Production Analysis 2025 & 2033
- Figure 4: North America Military Robots Industry Revenue (Million), by Consumption Analysis 2025 & 2033
- Figure 5: North America Military Robots Industry Revenue Share (%), by Consumption Analysis 2025 & 2033
- Figure 6: North America Military Robots Industry Revenue (Million), by Import Market Analysis (Value & Volume) 2025 & 2033
- Figure 7: North America Military Robots Industry Revenue Share (%), by Import Market Analysis (Value & Volume) 2025 & 2033
- Figure 8: North America Military Robots Industry Revenue (Million), by Export Market Analysis (Value & Volume) 2025 & 2033
- Figure 9: North America Military Robots Industry Revenue Share (%), by Export Market Analysis (Value & Volume) 2025 & 2033
- Figure 10: North America Military Robots Industry Revenue (Million), by Price Trend Analysis 2025 & 2033
- Figure 11: North America Military Robots Industry Revenue Share (%), by Price Trend Analysis 2025 & 2033
- Figure 12: North America Military Robots Industry Revenue (Million), by Country 2025 & 2033
- Figure 13: North America Military Robots Industry Revenue Share (%), by Country 2025 & 2033
- Figure 14: South America Military Robots Industry Revenue (Million), by Production Analysis 2025 & 2033
- Figure 15: South America Military Robots Industry Revenue Share (%), by Production Analysis 2025 & 2033
- Figure 16: South America Military Robots Industry Revenue (Million), by Consumption Analysis 2025 & 2033
- Figure 17: South America Military Robots Industry Revenue Share (%), by Consumption Analysis 2025 & 2033
- Figure 18: South America Military Robots Industry Revenue (Million), by Import Market Analysis (Value & Volume) 2025 & 2033
- Figure 19: South America Military Robots Industry Revenue Share (%), by Import Market Analysis (Value & Volume) 2025 & 2033
- Figure 20: South America Military Robots Industry Revenue (Million), by Export Market Analysis (Value & Volume) 2025 & 2033
- Figure 21: South America Military Robots Industry Revenue Share (%), by Export Market Analysis (Value & Volume) 2025 & 2033
- Figure 22: South America Military Robots Industry Revenue (Million), by Price Trend Analysis 2025 & 2033
- Figure 23: South America Military Robots Industry Revenue Share (%), by Price Trend Analysis 2025 & 2033
- Figure 24: South America Military Robots Industry Revenue (Million), by Country 2025 & 2033
- Figure 25: South America Military Robots Industry Revenue Share (%), by Country 2025 & 2033
- Figure 26: Europe Military Robots Industry Revenue (Million), by Production Analysis 2025 & 2033
- Figure 27: Europe Military Robots Industry Revenue Share (%), by Production Analysis 2025 & 2033
- Figure 28: Europe Military Robots Industry Revenue (Million), by Consumption Analysis 2025 & 2033
- Figure 29: Europe Military Robots Industry Revenue Share (%), by Consumption Analysis 2025 & 2033
- Figure 30: Europe Military Robots Industry Revenue (Million), by Import Market Analysis (Value & Volume) 2025 & 2033
- Figure 31: Europe Military Robots Industry Revenue Share (%), by Import Market Analysis (Value & Volume) 2025 & 2033
- Figure 32: Europe Military Robots Industry Revenue (Million), by Export Market Analysis (Value & Volume) 2025 & 2033
- Figure 33: Europe Military Robots Industry Revenue Share (%), by Export Market Analysis (Value & Volume) 2025 & 2033
- Figure 34: Europe Military Robots Industry Revenue (Million), by Price Trend Analysis 2025 & 2033
- Figure 35: Europe Military Robots Industry Revenue Share (%), by Price Trend Analysis 2025 & 2033
- Figure 36: Europe Military Robots Industry Revenue (Million), by Country 2025 & 2033
- Figure 37: Europe Military Robots Industry Revenue Share (%), by Country 2025 & 2033
- Figure 38: Middle East & Africa Military Robots Industry Revenue (Million), by Production Analysis 2025 & 2033
- Figure 39: Middle East & Africa Military Robots Industry Revenue Share (%), by Production Analysis 2025 & 2033
- Figure 40: Middle East & Africa Military Robots Industry Revenue (Million), by Consumption Analysis 2025 & 2033
- Figure 41: Middle East & Africa Military Robots Industry Revenue Share (%), by Consumption Analysis 2025 & 2033
- Figure 42: Middle East & Africa Military Robots Industry Revenue (Million), by Import Market Analysis (Value & Volume) 2025 & 2033
- Figure 43: Middle East & Africa Military Robots Industry Revenue Share (%), by Import Market Analysis (Value & Volume) 2025 & 2033
- Figure 44: Middle East & Africa Military Robots Industry Revenue (Million), by Export Market Analysis (Value & Volume) 2025 & 2033
- Figure 45: Middle East & Africa Military Robots Industry Revenue Share (%), by Export Market Analysis (Value & Volume) 2025 & 2033
- Figure 46: Middle East & Africa Military Robots Industry Revenue (Million), by Price Trend Analysis 2025 & 2033
- Figure 47: Middle East & Africa Military Robots Industry Revenue Share (%), by Price Trend Analysis 2025 & 2033
- Figure 48: Middle East & Africa Military Robots Industry Revenue (Million), by Country 2025 & 2033
- Figure 49: Middle East & Africa Military Robots Industry Revenue Share (%), by Country 2025 & 2033
- Figure 50: Asia Pacific Military Robots Industry Revenue (Million), by Production Analysis 2025 & 2033
- Figure 51: Asia Pacific Military Robots Industry Revenue Share (%), by Production Analysis 2025 & 2033
- Figure 52: Asia Pacific Military Robots Industry Revenue (Million), by Consumption Analysis 2025 & 2033
- Figure 53: Asia Pacific Military Robots Industry Revenue Share (%), by Consumption Analysis 2025 & 2033
- Figure 54: Asia Pacific Military Robots Industry Revenue (Million), by Import Market Analysis (Value & Volume) 2025 & 2033
- Figure 55: Asia Pacific Military Robots Industry Revenue Share (%), by Import Market Analysis (Value & Volume) 2025 & 2033
- Figure 56: Asia Pacific Military Robots Industry Revenue (Million), by Export Market Analysis (Value & Volume) 2025 & 2033
- Figure 57: Asia Pacific Military Robots Industry Revenue Share (%), by Export Market Analysis (Value & Volume) 2025 & 2033
- Figure 58: Asia Pacific Military Robots Industry Revenue (Million), by Price Trend Analysis 2025 & 2033
- Figure 59: Asia Pacific Military Robots Industry Revenue Share (%), by Price Trend Analysis 2025 & 2033
- Figure 60: Asia Pacific Military Robots Industry Revenue (Million), by Country 2025 & 2033
- Figure 61: Asia Pacific Military Robots Industry Revenue Share (%), by Country 2025 & 2033
List of Tables
- Table 1: Global Military Robots Industry Revenue Million Forecast, by Production Analysis 2020 & 2033
- Table 2: Global Military Robots Industry Revenue Million Forecast, by Consumption Analysis 2020 & 2033
- Table 3: Global Military Robots Industry Revenue Million Forecast, by Import Market Analysis (Value & Volume) 2020 & 2033
- Table 4: Global Military Robots Industry Revenue Million Forecast, by Export Market Analysis (Value & Volume) 2020 & 2033
- Table 5: Global Military Robots Industry Revenue Million Forecast, by Price Trend Analysis 2020 & 2033
- Table 6: Global Military Robots Industry Revenue Million Forecast, by Region 2020 & 2033
- Table 7: Global Military Robots Industry Revenue Million Forecast, by Production Analysis 2020 & 2033
- Table 8: Global Military Robots Industry Revenue Million Forecast, by Consumption Analysis 2020 & 2033
- Table 9: Global Military Robots Industry Revenue Million Forecast, by Import Market Analysis (Value & Volume) 2020 & 2033
- Table 10: Global Military Robots Industry Revenue Million Forecast, by Export Market Analysis (Value & Volume) 2020 & 2033
- Table 11: Global Military Robots Industry Revenue Million Forecast, by Price Trend Analysis 2020 & 2033
- Table 12: Global Military Robots Industry Revenue Million Forecast, by Country 2020 & 2033
- Table 13: United States Military Robots Industry Revenue (Million) Forecast, by Application 2020 & 2033
- Table 14: Canada Military Robots Industry Revenue (Million) Forecast, by Application 2020 & 2033
- Table 15: Mexico Military Robots Industry Revenue (Million) Forecast, by Application 2020 & 2033
- Table 16: Global Military Robots Industry Revenue Million Forecast, by Production Analysis 2020 & 2033
- Table 17: Global Military Robots Industry Revenue Million Forecast, by Consumption Analysis 2020 & 2033
- Table 18: Global Military Robots Industry Revenue Million Forecast, by Import Market Analysis (Value & Volume) 2020 & 2033
- Table 19: Global Military Robots Industry Revenue Million Forecast, by Export Market Analysis (Value & Volume) 2020 & 2033
- Table 20: Global Military Robots Industry Revenue Million Forecast, by Price Trend Analysis 2020 & 2033
- Table 21: Global Military Robots Industry Revenue Million Forecast, by Country 2020 & 2033
- Table 22: Brazil Military Robots Industry Revenue (Million) Forecast, by Application 2020 & 2033
- Table 23: Argentina Military Robots Industry Revenue (Million) Forecast, by Application 2020 & 2033
- Table 24: Rest of South America Military Robots Industry Revenue (Million) Forecast, by Application 2020 & 2033
- Table 25: Global Military Robots Industry Revenue Million Forecast, by Production Analysis 2020 & 2033
- Table 26: Global Military Robots Industry Revenue Million Forecast, by Consumption Analysis 2020 & 2033
- Table 27: Global Military Robots Industry Revenue Million Forecast, by Import Market Analysis (Value & Volume) 2020 & 2033
- Table 28: Global Military Robots Industry Revenue Million Forecast, by Export Market Analysis (Value & Volume) 2020 & 2033
- Table 29: Global Military Robots Industry Revenue Million Forecast, by Price Trend Analysis 2020 & 2033
- Table 30: Global Military Robots Industry Revenue Million Forecast, by Country 2020 & 2033
- Table 31: United Kingdom Military Robots Industry Revenue (Million) Forecast, by Application 2020 & 2033
- Table 32: Germany Military Robots Industry Revenue (Million) Forecast, by Application 2020 & 2033
- Table 33: France Military Robots Industry Revenue (Million) Forecast, by Application 2020 & 2033
- Table 34: Italy Military Robots Industry Revenue (Million) Forecast, by Application 2020 & 2033
- Table 35: Spain Military Robots Industry Revenue (Million) Forecast, by Application 2020 & 2033
- Table 36: Russia Military Robots Industry Revenue (Million) Forecast, by Application 2020 & 2033
- Table 37: Benelux Military Robots Industry Revenue (Million) Forecast, by Application 2020 & 2033
- Table 38: Nordics Military Robots Industry Revenue (Million) Forecast, by Application 2020 & 2033
- Table 39: Rest of Europe Military Robots Industry Revenue (Million) Forecast, by Application 2020 & 2033
- Table 40: Global Military Robots Industry Revenue Million Forecast, by Production Analysis 2020 & 2033
- Table 41: Global Military Robots Industry Revenue Million Forecast, by Consumption Analysis 2020 & 2033
- Table 42: Global Military Robots Industry Revenue Million Forecast, by Import Market Analysis (Value & Volume) 2020 & 2033
- Table 43: Global Military Robots Industry Revenue Million Forecast, by Export Market Analysis (Value & Volume) 2020 & 2033
- Table 44: Global Military Robots Industry Revenue Million Forecast, by Price Trend Analysis 2020 & 2033
- Table 45: Global Military Robots Industry Revenue Million Forecast, by Country 2020 & 2033
- Table 46: Turkey Military Robots Industry Revenue (Million) Forecast, by Application 2020 & 2033
- Table 47: Israel Military Robots Industry Revenue (Million) Forecast, by Application 2020 & 2033
- Table 48: GCC Military Robots Industry Revenue (Million) Forecast, by Application 2020 & 2033
- Table 49: North Africa Military Robots Industry Revenue (Million) Forecast, by Application 2020 & 2033
- Table 50: South Africa Military Robots Industry Revenue (Million) Forecast, by Application 2020 & 2033
- Table 51: Rest of Middle East & Africa Military Robots Industry Revenue (Million) Forecast, by Application 2020 & 2033
- Table 52: Global Military Robots Industry Revenue Million Forecast, by Production Analysis 2020 & 2033
- Table 53: Global Military Robots Industry Revenue Million Forecast, by Consumption Analysis 2020 & 2033
- Table 54: Global Military Robots Industry Revenue Million Forecast, by Import Market Analysis (Value & Volume) 2020 & 2033
- Table 55: Global Military Robots Industry Revenue Million Forecast, by Export Market Analysis (Value & Volume) 2020 & 2033
- Table 56: Global Military Robots Industry Revenue Million Forecast, by Price Trend Analysis 2020 & 2033
- Table 57: Global Military Robots Industry Revenue Million Forecast, by Country 2020 & 2033
- Table 58: China Military Robots Industry Revenue (Million) Forecast, by Application 2020 & 2033
- Table 59: India Military Robots Industry Revenue (Million) Forecast, by Application 2020 & 2033
- Table 60: Japan Military Robots Industry Revenue (Million) Forecast, by Application 2020 & 2033
- Table 61: South Korea Military Robots Industry Revenue (Million) Forecast, by Application 2020 & 2033
- Table 62: ASEAN Military Robots Industry Revenue (Million) Forecast, by Application 2020 & 2033
- Table 63: Oceania Military Robots Industry Revenue (Million) Forecast, by Application 2020 & 2033
- Table 64: Rest of Asia Pacific Military Robots Industry Revenue (Million) Forecast, by Application 2020 & 2033
Frequently Asked Questions
1. What is the projected Compound Annual Growth Rate (CAGR) of the Military Robots Industry?
The projected CAGR is approximately 6.97%.
2. Which companies are prominent players in the Military Robots Industry?
Key companies in the market include Textron Inc, THALES, General Dynamics Corporation, BAYKAR, Elbit Systems Ltd, Lockheed Martin Corporation, QinetiQ Group PLC, Cobham Ltd, AeroVironment Inc, IAI, Aeronautics Ltd, BAE Systems plc, Northrop Grumman Corporation, Saab AB, Teledyne FLIR LLC.
3. What are the main segments of the Military Robots Industry?
The market segments include Production Analysis, Consumption Analysis, Import Market Analysis (Value & Volume), Export Market Analysis (Value & Volume), Price Trend Analysis.
4. Can you provide details about the market size?
The market size is estimated to be USD 24.37 Million as of 2022.
5. What are some drivers contributing to market growth?
; Increasing Number Of Air Passengers; Use Of Portable Electronic Devices.
6. What are the notable trends driving market growth?
Land Segment Anticipated to Generate Highest Growth During the Forecast Period.
7. Are there any restraints impacting market growth?
; High Cost Of Connectivity Equipments.
8. Can you provide examples of recent developments in the market?
October 2023: The US Army is reportedly developing integrated formations of robots and human operators as part of the modernization efforts. The US Army’s Rapid Capabilities and Critical Technologies Office (RCCTO) plans to use existing science and technology as well as information from fielded programs to figure out how to combine capabilities to maximize coordination on the battlefield.
9. What pricing options are available for accessing the report?
Pricing options include single-user, multi-user, and enterprise licenses priced at USD 4750, USD 5250, and USD 8750 respectively.
10. Is the market size provided in terms of value or volume?
The market size is provided in terms of value, measured in Million.
11. Are there any specific market keywords associated with the report?
Yes, the market keyword associated with the report is "Military Robots Industry," which aids in identifying and referencing the specific market segment covered.
12. How do I determine which pricing option suits my needs best?
The pricing options vary based on user requirements and access needs. Individual users may opt for single-user licenses, while businesses requiring broader access may choose multi-user or enterprise licenses for cost-effective access to the report.
13. Are there any additional resources or data provided in the Military Robots Industry report?
While the report offers comprehensive insights, it's advisable to review the specific contents or supplementary materials provided to ascertain if additional resources or data are available.
14. How can I stay updated on further developments or reports in the Military Robots Industry?
To stay informed about further developments, trends, and reports in the Military Robots Industry, consider subscribing to industry newsletters, following relevant companies and organizations, or regularly checking reputable industry news sources and publications.
Methodology
Step 1 - Identification of Relevant Samples Size from Population Database


Step 2 - Approaches for Defining Global Market Size (Value, Volume* & Price*)

Note*: In applicable scenarios
Step 3 - Data Sources
Primary Research
- Web Analytics
- Survey Reports
- Research Institute
- Latest Research Reports
- Opinion Leaders
Secondary Research
- Annual Reports
- White Paper
- Latest Press Release
- Industry Association
- Paid Database
- Investor Presentations

Step 4 - Data Triangulation
Involves using different sources of information in order to increase the validity of a study
These sources are likely to be stakeholders in a program - participants, other researchers, program staff, other community members, and so on.
Then we put all data in single framework & apply various statistical tools to find out the dynamic on the market.
During the analysis stage, feedback from the stakeholder groups would be compared to determine areas of agreement as well as areas of divergence