

Key Insights
The global mini-spectrometer market is poised for significant expansion, projected to reach a market size of $472 million by 2025, driven by an impressive compound annual growth rate (CAGR) of 8.4%. This robust growth is fueled by a confluence of technological advancements and increasing adoption across diverse industries. Mini-spectrometers, known for their compact size, portability, and cost-effectiveness, are revolutionizing how spectral analysis is performed. Key drivers include the escalating demand for real-time monitoring and quality control in applications ranging from agriculture and food safety to environmental monitoring and industrial process optimization. The burgeoning "Internet of Things" (IoT) ecosystem further propels this market, enabling the integration of mini-spectrometers into smart devices for enhanced data collection and analysis. Furthermore, advancements in sensor technology, miniaturization, and improved spectral resolution are continuously expanding the capabilities and applications of these devices.

Mini-spectrometers Market Size (In Million)
The market's trajectory is further shaped by prevailing trends such as the rise of portable and handheld spectroscopy solutions, enabling on-site analysis and faster decision-making. The growing emphasis on precision farming and smart agriculture, where mini-spectrometers are used for soil analysis, crop health monitoring, and yield prediction, is a major growth catalyst. In the medical sector, these devices are finding applications in non-invasive diagnostics, drug discovery, and personalized medicine. While the market exhibits strong growth potential, certain restraints, such as the initial cost of advanced mini-spectrometers and the need for specialized expertise for data interpretation in some niche applications, may temper the pace of adoption in specific segments. However, the continuous innovation by leading companies like Hamamatsu Photonics, Ocean Insight, and Horiba, focusing on developing more affordable and user-friendly solutions, is expected to mitigate these challenges and ensure sustained market expansion throughout the forecast period of 2025-2033.

Mini-spectrometers Company Market Share
Mini-spectrometers Market Report: Comprehensive Analysis & Future Outlook (2019–2033)
This in-depth market research report provides a comprehensive analysis of the global mini-spectrometers market, a critical technology enabling advanced spectral analysis across a multitude of industries. With applications spanning farming, smart buildings, medical diagnostics, automotive, and consumer electronics, mini-spectrometers are witnessing unprecedented growth driven by miniaturization, cost reduction, and increasing demand for real-time, on-site chemical and material identification. This report offers actionable insights for stakeholders, including manufacturers, suppliers, investors, and end-users, guiding strategic decision-making and identifying lucrative market opportunities.
Mini-spectrometers Market Structure & Innovation Trends
The mini-spectrometers market is characterized by a moderate to high level of fragmentation, with a mix of established multinational corporations and agile niche players driving innovation. Key innovation drivers include advancements in detector technologies, optics miniaturization, and integration with IoT and AI platforms. Regulatory frameworks, particularly in the medical and food safety sectors, are increasingly shaping product development, demanding higher accuracy and compliance. Product substitutes, such as traditional laboratory spectrometers or chemical sensors, are being steadily displaced by the portability and cost-effectiveness of mini-spectrometers. End-user demographics are expanding beyond traditional R&D labs to encompass field technicians, quality control personnel, and even consumers in specialized applications. Merger and acquisition (M&A) activities are notable, with strategic consolidations aimed at expanding product portfolios, market reach, and technological capabilities. Estimated M&A deal values are projected to exceed $500 million annually during the forecast period, reflecting the sector's dynamic growth. Market share is currently led by players offering a diverse range of both chip-type and modular spectrometer solutions.
Mini-spectrometers Market Dynamics & Trends
The global mini-spectrometers market is poised for robust expansion, projecting a Compound Annual Growth Rate (CAGR) of approximately 18.5% from 2025 to 2033, reaching an estimated market value of over $3.5 billion by 2033. This significant growth is underpinned by several key market dynamics and trends. The relentless pursuit of miniaturization and cost reduction in electronic components, particularly in semiconductor fabrication and optics, has made mini-spectrometers more accessible and integrated into a wider array of devices. Technological disruptions, such as the advent of advanced photonic integrated circuits (PICs) and the development of highly sensitive and compact detectors, are enabling higher performance and lower power consumption. Consumer preferences are increasingly shifting towards on-demand, real-time data and analysis, fueling the adoption of portable spectroscopic solutions in everyday applications. For instance, the growing demand for personalized health monitoring and accurate food safety checks is driving the integration of mini-spectrometers into wearable devices and smart appliances. Competitive dynamics are intensifying, with companies differentiating themselves through specialized sensor technologies, software analytics, and tailored application solutions. Market penetration is rapidly increasing across all key application segments, particularly in agriculture for soil analysis and crop health monitoring, and in the automotive sector for material identification and quality control during manufacturing. The development of user-friendly interfaces and cloud-based data analysis platforms is further lowering adoption barriers for non-expert users. The increasing prevalence of smart cities and smart building initiatives is also a significant catalyst, requiring on-site environmental monitoring and material authentication, which mini-spectrometers are ideally suited to provide. Furthermore, the ongoing miniaturization trend extends to the packaging and form factors of these devices, allowing for integration into handheld tools, drones, and even mobile phones in the future.
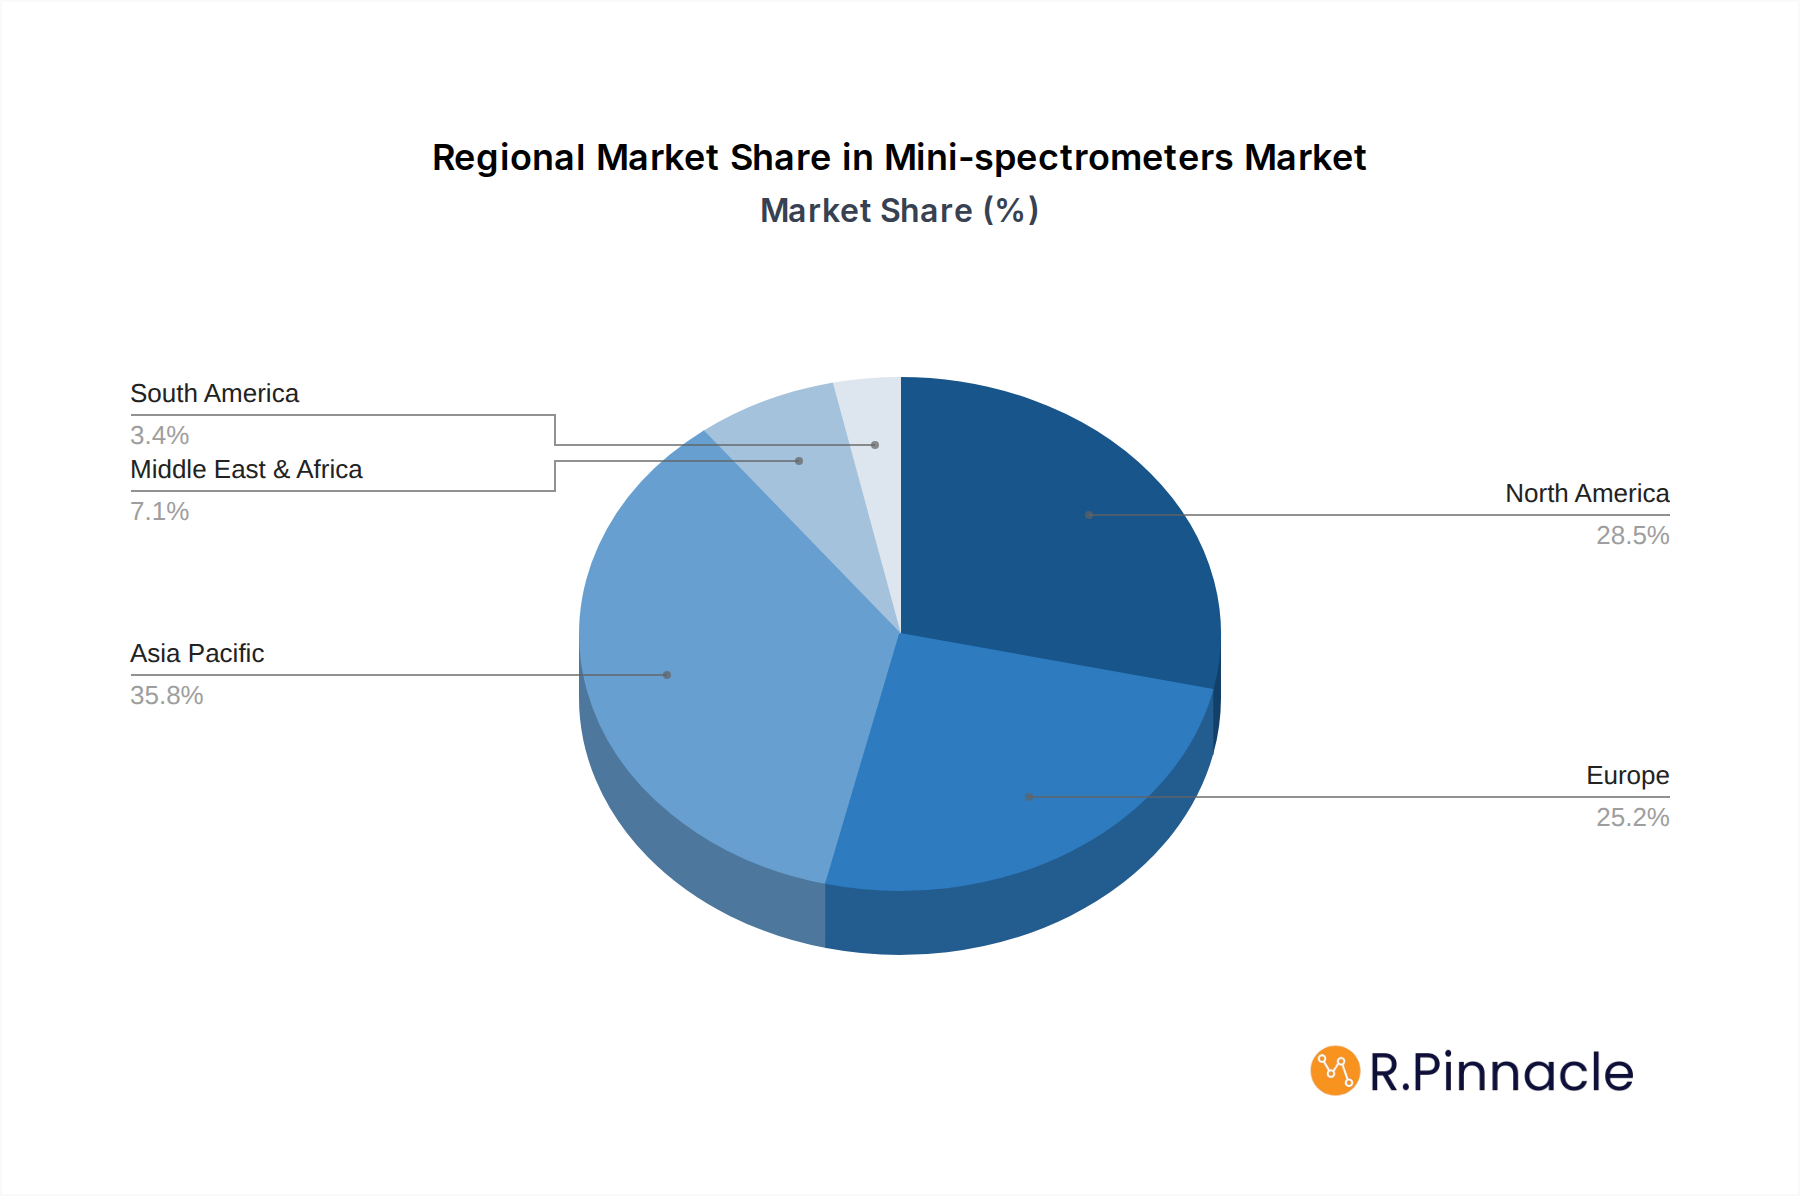
Dominant Regions & Segments in Mini-spectrometers
North America currently dominates the global mini-spectrometers market, driven by its strong technological infrastructure, significant R&D investments, and early adoption of advanced technologies across key sectors like healthcare, agriculture, and automotive. The United States, in particular, leads in market penetration and innovation, supported by favorable government policies promoting technological advancement and a robust ecosystem of technology companies and research institutions.
- Key Drivers in North America:
- High R&D expenditure in universities and private companies.
- Stringent quality control regulations in medical and food industries.
- Rapid adoption of IoT and AI technologies in smart buildings and smart agriculture.
- Government initiatives supporting advanced manufacturing and technological innovation.
Application Dominance:
The Medical application segment is a primary growth engine, accounting for an estimated 35% of the total market share. The demand for point-of-care diagnostics, personalized medicine, and non-invasive disease detection is accelerating the integration of mini-spectrometers into medical devices.
- Medical Application Drivers:
- Advancements in disease diagnostics and drug discovery.
- Demand for portable and in-vitro diagnostic tools.
- Increasing prevalence of chronic diseases requiring continuous monitoring.
- Development of wearable health monitoring devices.
Types Dominance:
Modular Type mini-spectrometers currently hold a larger market share due to their versatility, upgradeability, and broader range of functionalities, catering to complex research and industrial applications. However, Chip Type mini-spectrometers are rapidly gaining traction, driven by their ultra-compact size, lower cost, and suitability for mass-produced consumer electronics and IoT devices.
- Modular Type Dominance Factors:
- Flexibility and customization for specific applications.
- Higher performance and sensitivity for demanding tasks.
- Established presence in laboratory and industrial settings.
- Chip Type Growth Factors:
- Enabling integration into smaller devices.
- Cost-effectiveness for high-volume production.
- Advancements in MEMS and photonic integration.
The Automotive sector is also a significant contributor, with mini-spectrometers being utilized for material identification, quality control of components, and advanced driver-assistance systems (ADAS) sensor calibration. The drive towards electric vehicles and autonomous driving is further propelling the demand for sophisticated material analysis and sensor validation.
Mini-spectrometers Product Innovations
Recent product innovations in the mini-spectrometers market are centered on enhanced sensitivity, broader spectral range, improved robustness, and seamless integration with digital platforms. Companies are developing ultra-compact, chip-scale spectrometers that leverage advanced materials like silicon photonics to achieve laboratory-grade performance in handheld and embedded devices. New applications are emerging in areas such as counterfeit detection in pharmaceuticals and luxury goods, environmental monitoring for pollutants, and advanced quality control in food and beverage production. The competitive advantage lies in offering compact, cost-effective, and user-friendly solutions that provide real-time, actionable data, enabling rapid decision-making and process optimization across diverse industries.
Report Scope & Segmentation Analysis
This report provides a detailed segmentation of the mini-spectrometers market across key applications and product types.
Application Segments: The Medical segment is projected to exhibit a CAGR of over 20%, driven by advancements in diagnostics and personalized healthcare. Farming applications, including soil analysis and crop health monitoring, are expected to grow at approximately 19%. Smart Buildings will see a CAGR of around 18%, fueled by environmental monitoring and material authentication needs. The Automotive sector, with its focus on material inspection and sensor calibration, is anticipated to grow at 17%. Consumer Electronics and Others (including industrial inspection, security, and research) also represent significant growth opportunities.
Type Segments: Modular Type spectrometers, while currently dominant, are expected to maintain a steady growth rate of 16%. Chip Type spectrometers are poised for exponential growth, with a projected CAGR exceeding 22%, due to their miniaturization and cost advantages, making them ideal for integration into mass-market devices.
Key Drivers of Mini-spectrometers Growth
The growth of the mini-spectrometers market is propelled by several interconnected factors. Technologically, advancements in semiconductor manufacturing, MEMS technology, and photonic integrated circuits are enabling the creation of smaller, more affordable, and higher-performing devices. Economically, the increasing demand for process efficiency, quality control, and counterfeit detection across industries like pharmaceuticals, food & beverage, and manufacturing is creating a strong market pull. Regulatory bodies are increasingly mandating rigorous testing and authentication, driving the adoption of spectroscopic solutions. For example, stricter food safety regulations globally are pushing for on-site, real-time analysis capabilities. Furthermore, the proliferation of the Internet of Things (IoT) and the growing adoption of AI and machine learning for data analysis are creating new opportunities for intelligent spectroscopic solutions that can provide predictive insights.
Challenges in the Mini-spectrometers Sector
Despite the promising growth trajectory, the mini-spectrometers sector faces several challenges. Regulatory hurdles, particularly in highly regulated industries like healthcare, can slow down the approval and adoption process for new devices. Supply chain complexities, especially concerning specialized components and rare earth materials used in some optical systems, can lead to production delays and cost fluctuations. Competitive pressures are intense, with numerous players vying for market share, leading to price erosion in certain segments. Furthermore, the development of standardized protocols and data interpretation frameworks for diverse applications remains an ongoing challenge, impacting interoperability and widespread adoption. Educating end-users about the capabilities and benefits of mini-spectrometers also requires continuous effort.
Emerging Opportunities in Mini-spectrometers
Emerging opportunities in the mini-spectrometers market are abundant and diverse. The expansion of personalized medicine and at-home diagnostics presents a significant avenue for growth, with potential for integration into consumer healthcare devices. The burgeoning field of precision agriculture, requiring detailed soil and plant analysis for optimized yields and reduced environmental impact, offers substantial untapped potential. The development of smart city infrastructure, with its emphasis on environmental monitoring, public safety, and resource management, will also drive demand. Furthermore, advancements in wearable technology and flexible electronics are paving the way for novel form factors and applications, such as smart textiles with embedded spectroscopic sensing capabilities. The increasing focus on sustainability and circular economy principles will also create demand for mini-spectrometers in material recycling and waste management for accurate sorting and identification.
Leading Players in the Mini-spectrometers Market
- Hamamatsu Photonics
- Ocean Insight
- Viavi
- Horiba
- Si-Ware Systems
- OTO Photonics
- B&W Tek
- INSION
- Nanolambda
- Avantes
- Stellarnet
- ideaoptics
- Flight Technology
- Chromation
- Optosky Technology
Key Developments in Mini-spectrometers Industry
- 2024 Q1: Launch of a new generation of ultra-compact, chip-type spectrometers with enhanced near-infrared (NIR) capabilities for material analysis.
- 2023 Q4: Acquisition of a specialized optical sensor technology company by a major player to bolster its NIR spectroscopy portfolio.
- 2023 Q3: Introduction of cloud-connected mini-spectrometer platforms enabling remote diagnostics and data sharing in agricultural applications.
- 2023 Q2: Significant investment in R&D for silicon photonics-based mini-spectrometers aimed at reducing manufacturing costs and improving performance.
- 2022 Q4: Development of miniaturized spectrometer modules for integration into portable food safety testing devices, enhancing consumer protection.
- 2022 Q3: Partnership formed between a sensor manufacturer and a leading automotive supplier to develop integrated spectral analysis for vehicle component quality control.
- 2021 Q4: Breakthrough in detector sensitivity for visible and UV range mini-spectrometers, enabling new applications in environmental monitoring.
Future Outlook for Mini-spectrometers Market
The future outlook for the mini-spectrometers market is exceptionally bright, fueled by continuous technological advancements and expanding application landscapes. The convergence of spectroscopy with artificial intelligence and the Internet of Things will lead to the development of highly intelligent and autonomous sensing systems. We anticipate a significant shift towards chip-scale spectrometers, making spectroscopic analysis ubiquitous across a wide range of consumer products and industrial equipment. The increasing demand for real-time, on-site data across sectors like healthcare, agriculture, and environmental monitoring will continue to be the primary growth accelerator. Strategic collaborations and further M&A activities are expected to shape the competitive landscape, leading to more integrated and comprehensive solutions for end-users. The market is poised to become a cornerstone of future technological innovation, enabling smarter, safer, and more efficient solutions across global industries.
Mini-spectrometers Segmentation
-
1. Application
- 1.1. Farming
- 1.2. Smart Buildings
- 1.3. Medical
- 1.4. Automotive
- 1.5. Consumer Electronics
- 1.6. Others
-
2. Types
- 2.1. Chip Type
- 2.2. Modular Type
Mini-spectrometers Segmentation By Geography
-
1. North America
- 1.1. United States
- 1.2. Canada
- 1.3. Mexico
-
2. South America
- 2.1. Brazil
- 2.2. Argentina
- 2.3. Rest of South America
-
3. Europe
- 3.1. United Kingdom
- 3.2. Germany
- 3.3. France
- 3.4. Italy
- 3.5. Spain
- 3.6. Russia
- 3.7. Benelux
- 3.8. Nordics
- 3.9. Rest of Europe
-
4. Middle East & Africa
- 4.1. Turkey
- 4.2. Israel
- 4.3. GCC
- 4.4. North Africa
- 4.5. South Africa
- 4.6. Rest of Middle East & Africa
-
5. Asia Pacific
- 5.1. China
- 5.2. India
- 5.3. Japan
- 5.4. South Korea
- 5.5. ASEAN
- 5.6. Oceania
- 5.7. Rest of Asia Pacific
Mini-spectrometers Regional Market Share
Geographic Coverage of Mini-spectrometers
Mini-spectrometers REPORT HIGHLIGHTS
| Aspects | Details |
|---|---|
| Study Period | 2020-2034 |
| Base Year | 2025 |
| Estimated Year | 2026 |
| Forecast Period | 2026-2034 |
| Historical Period | 2020-2025 |
| Growth Rate | CAGR of 10.98% from 2020-2034 |
| Segmentation |
|
Table of Contents
- 1. Introduction
- 1.1. Research Scope
- 1.2. Market Segmentation
- 1.3. Research Methodology
- 1.4. Definitions and Assumptions
- 2. Executive Summary
- 2.1. Introduction
- 3. Market Dynamics
- 3.1. Introduction
- 3.2. Market Drivers
- 3.3. Market Restrains
- 3.4. Market Trends
- 4. Market Factor Analysis
- 4.1. Porters Five Forces
- 4.2. Supply/Value Chain
- 4.3. PESTEL analysis
- 4.4. Market Entropy
- 4.5. Patent/Trademark Analysis
- 5. Global Mini-spectrometers Analysis, Insights and Forecast, 2020-2032
- 5.1. Market Analysis, Insights and Forecast - by Application
- 5.1.1. Farming
- 5.1.2. Smart Buildings
- 5.1.3. Medical
- 5.1.4. Automotive
- 5.1.5. Consumer Electronics
- 5.1.6. Others
- 5.2. Market Analysis, Insights and Forecast - by Types
- 5.2.1. Chip Type
- 5.2.2. Modular Type
- 5.3. Market Analysis, Insights and Forecast - by Region
- 5.3.1. North America
- 5.3.2. South America
- 5.3.3. Europe
- 5.3.4. Middle East & Africa
- 5.3.5. Asia Pacific
- 5.1. Market Analysis, Insights and Forecast - by Application
- 6. North America Mini-spectrometers Analysis, Insights and Forecast, 2020-2032
- 6.1. Market Analysis, Insights and Forecast - by Application
- 6.1.1. Farming
- 6.1.2. Smart Buildings
- 6.1.3. Medical
- 6.1.4. Automotive
- 6.1.5. Consumer Electronics
- 6.1.6. Others
- 6.2. Market Analysis, Insights and Forecast - by Types
- 6.2.1. Chip Type
- 6.2.2. Modular Type
- 6.1. Market Analysis, Insights and Forecast - by Application
- 7. South America Mini-spectrometers Analysis, Insights and Forecast, 2020-2032
- 7.1. Market Analysis, Insights and Forecast - by Application
- 7.1.1. Farming
- 7.1.2. Smart Buildings
- 7.1.3. Medical
- 7.1.4. Automotive
- 7.1.5. Consumer Electronics
- 7.1.6. Others
- 7.2. Market Analysis, Insights and Forecast - by Types
- 7.2.1. Chip Type
- 7.2.2. Modular Type
- 7.1. Market Analysis, Insights and Forecast - by Application
- 8. Europe Mini-spectrometers Analysis, Insights and Forecast, 2020-2032
- 8.1. Market Analysis, Insights and Forecast - by Application
- 8.1.1. Farming
- 8.1.2. Smart Buildings
- 8.1.3. Medical
- 8.1.4. Automotive
- 8.1.5. Consumer Electronics
- 8.1.6. Others
- 8.2. Market Analysis, Insights and Forecast - by Types
- 8.2.1. Chip Type
- 8.2.2. Modular Type
- 8.1. Market Analysis, Insights and Forecast - by Application
- 9. Middle East & Africa Mini-spectrometers Analysis, Insights and Forecast, 2020-2032
- 9.1. Market Analysis, Insights and Forecast - by Application
- 9.1.1. Farming
- 9.1.2. Smart Buildings
- 9.1.3. Medical
- 9.1.4. Automotive
- 9.1.5. Consumer Electronics
- 9.1.6. Others
- 9.2. Market Analysis, Insights and Forecast - by Types
- 9.2.1. Chip Type
- 9.2.2. Modular Type
- 9.1. Market Analysis, Insights and Forecast - by Application
- 10. Asia Pacific Mini-spectrometers Analysis, Insights and Forecast, 2020-2032
- 10.1. Market Analysis, Insights and Forecast - by Application
- 10.1.1. Farming
- 10.1.2. Smart Buildings
- 10.1.3. Medical
- 10.1.4. Automotive
- 10.1.5. Consumer Electronics
- 10.1.6. Others
- 10.2. Market Analysis, Insights and Forecast - by Types
- 10.2.1. Chip Type
- 10.2.2. Modular Type
- 10.1. Market Analysis, Insights and Forecast - by Application
- 11. Competitive Analysis
- 11.1. Global Market Share Analysis 2025
- 11.2. Company Profiles
- 11.2.1 Hamamatsu Photonics
- 11.2.1.1. Overview
- 11.2.1.2. Products
- 11.2.1.3. SWOT Analysis
- 11.2.1.4. Recent Developments
- 11.2.1.5. Financials (Based on Availability)
- 11.2.2 Ocean Insight
- 11.2.2.1. Overview
- 11.2.2.2. Products
- 11.2.2.3. SWOT Analysis
- 11.2.2.4. Recent Developments
- 11.2.2.5. Financials (Based on Availability)
- 11.2.3 Viavi
- 11.2.3.1. Overview
- 11.2.3.2. Products
- 11.2.3.3. SWOT Analysis
- 11.2.3.4. Recent Developments
- 11.2.3.5. Financials (Based on Availability)
- 11.2.4 Horiba
- 11.2.4.1. Overview
- 11.2.4.2. Products
- 11.2.4.3. SWOT Analysis
- 11.2.4.4. Recent Developments
- 11.2.4.5. Financials (Based on Availability)
- 11.2.5 Si-Ware Systems
- 11.2.5.1. Overview
- 11.2.5.2. Products
- 11.2.5.3. SWOT Analysis
- 11.2.5.4. Recent Developments
- 11.2.5.5. Financials (Based on Availability)
- 11.2.6 OTO Photonics
- 11.2.6.1. Overview
- 11.2.6.2. Products
- 11.2.6.3. SWOT Analysis
- 11.2.6.4. Recent Developments
- 11.2.6.5. Financials (Based on Availability)
- 11.2.7 B&W Tek
- 11.2.7.1. Overview
- 11.2.7.2. Products
- 11.2.7.3. SWOT Analysis
- 11.2.7.4. Recent Developments
- 11.2.7.5. Financials (Based on Availability)
- 11.2.8 INSION
- 11.2.8.1. Overview
- 11.2.8.2. Products
- 11.2.8.3. SWOT Analysis
- 11.2.8.4. Recent Developments
- 11.2.8.5. Financials (Based on Availability)
- 11.2.9 Nanolambda
- 11.2.9.1. Overview
- 11.2.9.2. Products
- 11.2.9.3. SWOT Analysis
- 11.2.9.4. Recent Developments
- 11.2.9.5. Financials (Based on Availability)
- 11.2.10 Avantes
- 11.2.10.1. Overview
- 11.2.10.2. Products
- 11.2.10.3. SWOT Analysis
- 11.2.10.4. Recent Developments
- 11.2.10.5. Financials (Based on Availability)
- 11.2.11 Stellarnet
- 11.2.11.1. Overview
- 11.2.11.2. Products
- 11.2.11.3. SWOT Analysis
- 11.2.11.4. Recent Developments
- 11.2.11.5. Financials (Based on Availability)
- 11.2.12 ideaoptics
- 11.2.12.1. Overview
- 11.2.12.2. Products
- 11.2.12.3. SWOT Analysis
- 11.2.12.4. Recent Developments
- 11.2.12.5. Financials (Based on Availability)
- 11.2.13 Flight Technology
- 11.2.13.1. Overview
- 11.2.13.2. Products
- 11.2.13.3. SWOT Analysis
- 11.2.13.4. Recent Developments
- 11.2.13.5. Financials (Based on Availability)
- 11.2.14 Chromation
- 11.2.14.1. Overview
- 11.2.14.2. Products
- 11.2.14.3. SWOT Analysis
- 11.2.14.4. Recent Developments
- 11.2.14.5. Financials (Based on Availability)
- 11.2.15 Optosky Technology
- 11.2.15.1. Overview
- 11.2.15.2. Products
- 11.2.15.3. SWOT Analysis
- 11.2.15.4. Recent Developments
- 11.2.15.5. Financials (Based on Availability)
- 11.2.1 Hamamatsu Photonics
List of Figures
- Figure 1: Global Mini-spectrometers Revenue Breakdown (undefined, %) by Region 2025 & 2033
- Figure 2: North America Mini-spectrometers Revenue (undefined), by Application 2025 & 2033
- Figure 3: North America Mini-spectrometers Revenue Share (%), by Application 2025 & 2033
- Figure 4: North America Mini-spectrometers Revenue (undefined), by Types 2025 & 2033
- Figure 5: North America Mini-spectrometers Revenue Share (%), by Types 2025 & 2033
- Figure 6: North America Mini-spectrometers Revenue (undefined), by Country 2025 & 2033
- Figure 7: North America Mini-spectrometers Revenue Share (%), by Country 2025 & 2033
- Figure 8: South America Mini-spectrometers Revenue (undefined), by Application 2025 & 2033
- Figure 9: South America Mini-spectrometers Revenue Share (%), by Application 2025 & 2033
- Figure 10: South America Mini-spectrometers Revenue (undefined), by Types 2025 & 2033
- Figure 11: South America Mini-spectrometers Revenue Share (%), by Types 2025 & 2033
- Figure 12: South America Mini-spectrometers Revenue (undefined), by Country 2025 & 2033
- Figure 13: South America Mini-spectrometers Revenue Share (%), by Country 2025 & 2033
- Figure 14: Europe Mini-spectrometers Revenue (undefined), by Application 2025 & 2033
- Figure 15: Europe Mini-spectrometers Revenue Share (%), by Application 2025 & 2033
- Figure 16: Europe Mini-spectrometers Revenue (undefined), by Types 2025 & 2033
- Figure 17: Europe Mini-spectrometers Revenue Share (%), by Types 2025 & 2033
- Figure 18: Europe Mini-spectrometers Revenue (undefined), by Country 2025 & 2033
- Figure 19: Europe Mini-spectrometers Revenue Share (%), by Country 2025 & 2033
- Figure 20: Middle East & Africa Mini-spectrometers Revenue (undefined), by Application 2025 & 2033
- Figure 21: Middle East & Africa Mini-spectrometers Revenue Share (%), by Application 2025 & 2033
- Figure 22: Middle East & Africa Mini-spectrometers Revenue (undefined), by Types 2025 & 2033
- Figure 23: Middle East & Africa Mini-spectrometers Revenue Share (%), by Types 2025 & 2033
- Figure 24: Middle East & Africa Mini-spectrometers Revenue (undefined), by Country 2025 & 2033
- Figure 25: Middle East & Africa Mini-spectrometers Revenue Share (%), by Country 2025 & 2033
- Figure 26: Asia Pacific Mini-spectrometers Revenue (undefined), by Application 2025 & 2033
- Figure 27: Asia Pacific Mini-spectrometers Revenue Share (%), by Application 2025 & 2033
- Figure 28: Asia Pacific Mini-spectrometers Revenue (undefined), by Types 2025 & 2033
- Figure 29: Asia Pacific Mini-spectrometers Revenue Share (%), by Types 2025 & 2033
- Figure 30: Asia Pacific Mini-spectrometers Revenue (undefined), by Country 2025 & 2033
- Figure 31: Asia Pacific Mini-spectrometers Revenue Share (%), by Country 2025 & 2033
List of Tables
- Table 1: Global Mini-spectrometers Revenue undefined Forecast, by Application 2020 & 2033
- Table 2: Global Mini-spectrometers Revenue undefined Forecast, by Types 2020 & 2033
- Table 3: Global Mini-spectrometers Revenue undefined Forecast, by Region 2020 & 2033
- Table 4: Global Mini-spectrometers Revenue undefined Forecast, by Application 2020 & 2033
- Table 5: Global Mini-spectrometers Revenue undefined Forecast, by Types 2020 & 2033
- Table 6: Global Mini-spectrometers Revenue undefined Forecast, by Country 2020 & 2033
- Table 7: United States Mini-spectrometers Revenue (undefined) Forecast, by Application 2020 & 2033
- Table 8: Canada Mini-spectrometers Revenue (undefined) Forecast, by Application 2020 & 2033
- Table 9: Mexico Mini-spectrometers Revenue (undefined) Forecast, by Application 2020 & 2033
- Table 10: Global Mini-spectrometers Revenue undefined Forecast, by Application 2020 & 2033
- Table 11: Global Mini-spectrometers Revenue undefined Forecast, by Types 2020 & 2033
- Table 12: Global Mini-spectrometers Revenue undefined Forecast, by Country 2020 & 2033
- Table 13: Brazil Mini-spectrometers Revenue (undefined) Forecast, by Application 2020 & 2033
- Table 14: Argentina Mini-spectrometers Revenue (undefined) Forecast, by Application 2020 & 2033
- Table 15: Rest of South America Mini-spectrometers Revenue (undefined) Forecast, by Application 2020 & 2033
- Table 16: Global Mini-spectrometers Revenue undefined Forecast, by Application 2020 & 2033
- Table 17: Global Mini-spectrometers Revenue undefined Forecast, by Types 2020 & 2033
- Table 18: Global Mini-spectrometers Revenue undefined Forecast, by Country 2020 & 2033
- Table 19: United Kingdom Mini-spectrometers Revenue (undefined) Forecast, by Application 2020 & 2033
- Table 20: Germany Mini-spectrometers Revenue (undefined) Forecast, by Application 2020 & 2033
- Table 21: France Mini-spectrometers Revenue (undefined) Forecast, by Application 2020 & 2033
- Table 22: Italy Mini-spectrometers Revenue (undefined) Forecast, by Application 2020 & 2033
- Table 23: Spain Mini-spectrometers Revenue (undefined) Forecast, by Application 2020 & 2033
- Table 24: Russia Mini-spectrometers Revenue (undefined) Forecast, by Application 2020 & 2033
- Table 25: Benelux Mini-spectrometers Revenue (undefined) Forecast, by Application 2020 & 2033
- Table 26: Nordics Mini-spectrometers Revenue (undefined) Forecast, by Application 2020 & 2033
- Table 27: Rest of Europe Mini-spectrometers Revenue (undefined) Forecast, by Application 2020 & 2033
- Table 28: Global Mini-spectrometers Revenue undefined Forecast, by Application 2020 & 2033
- Table 29: Global Mini-spectrometers Revenue undefined Forecast, by Types 2020 & 2033
- Table 30: Global Mini-spectrometers Revenue undefined Forecast, by Country 2020 & 2033
- Table 31: Turkey Mini-spectrometers Revenue (undefined) Forecast, by Application 2020 & 2033
- Table 32: Israel Mini-spectrometers Revenue (undefined) Forecast, by Application 2020 & 2033
- Table 33: GCC Mini-spectrometers Revenue (undefined) Forecast, by Application 2020 & 2033
- Table 34: North Africa Mini-spectrometers Revenue (undefined) Forecast, by Application 2020 & 2033
- Table 35: South Africa Mini-spectrometers Revenue (undefined) Forecast, by Application 2020 & 2033
- Table 36: Rest of Middle East & Africa Mini-spectrometers Revenue (undefined) Forecast, by Application 2020 & 2033
- Table 37: Global Mini-spectrometers Revenue undefined Forecast, by Application 2020 & 2033
- Table 38: Global Mini-spectrometers Revenue undefined Forecast, by Types 2020 & 2033
- Table 39: Global Mini-spectrometers Revenue undefined Forecast, by Country 2020 & 2033
- Table 40: China Mini-spectrometers Revenue (undefined) Forecast, by Application 2020 & 2033
- Table 41: India Mini-spectrometers Revenue (undefined) Forecast, by Application 2020 & 2033
- Table 42: Japan Mini-spectrometers Revenue (undefined) Forecast, by Application 2020 & 2033
- Table 43: South Korea Mini-spectrometers Revenue (undefined) Forecast, by Application 2020 & 2033
- Table 44: ASEAN Mini-spectrometers Revenue (undefined) Forecast, by Application 2020 & 2033
- Table 45: Oceania Mini-spectrometers Revenue (undefined) Forecast, by Application 2020 & 2033
- Table 46: Rest of Asia Pacific Mini-spectrometers Revenue (undefined) Forecast, by Application 2020 & 2033
Frequently Asked Questions
1. What is the projected Compound Annual Growth Rate (CAGR) of the Mini-spectrometers?
The projected CAGR is approximately 10.98%.
2. Which companies are prominent players in the Mini-spectrometers?
Key companies in the market include Hamamatsu Photonics, Ocean Insight, Viavi, Horiba, Si-Ware Systems, OTO Photonics, B&W Tek, INSION, Nanolambda, Avantes, Stellarnet, ideaoptics, Flight Technology, Chromation, Optosky Technology.
3. What are the main segments of the Mini-spectrometers?
The market segments include Application, Types.
4. Can you provide details about the market size?
The market size is estimated to be USD XXX N/A as of 2022.
5. What are some drivers contributing to market growth?
N/A
6. What are the notable trends driving market growth?
N/A
7. Are there any restraints impacting market growth?
N/A
8. Can you provide examples of recent developments in the market?
N/A
9. What pricing options are available for accessing the report?
Pricing options include single-user, multi-user, and enterprise licenses priced at USD 2900.00, USD 4350.00, and USD 5800.00 respectively.
10. Is the market size provided in terms of value or volume?
The market size is provided in terms of value, measured in N/A.
11. Are there any specific market keywords associated with the report?
Yes, the market keyword associated with the report is "Mini-spectrometers," which aids in identifying and referencing the specific market segment covered.
12. How do I determine which pricing option suits my needs best?
The pricing options vary based on user requirements and access needs. Individual users may opt for single-user licenses, while businesses requiring broader access may choose multi-user or enterprise licenses for cost-effective access to the report.
13. Are there any additional resources or data provided in the Mini-spectrometers report?
While the report offers comprehensive insights, it's advisable to review the specific contents or supplementary materials provided to ascertain if additional resources or data are available.
14. How can I stay updated on further developments or reports in the Mini-spectrometers?
To stay informed about further developments, trends, and reports in the Mini-spectrometers, consider subscribing to industry newsletters, following relevant companies and organizations, or regularly checking reputable industry news sources and publications.
Methodology
Step 1 - Identification of Relevant Samples Size from Population Database


Step 2 - Approaches for Defining Global Market Size (Value, Volume* & Price*)

Note*: In applicable scenarios
Step 3 - Data Sources
Primary Research
- Web Analytics
- Survey Reports
- Research Institute
- Latest Research Reports
- Opinion Leaders
Secondary Research
- Annual Reports
- White Paper
- Latest Press Release
- Industry Association
- Paid Database
- Investor Presentations

Step 4 - Data Triangulation
Involves using different sources of information in order to increase the validity of a study
These sources are likely to be stakeholders in a program - participants, other researchers, program staff, other community members, and so on.
Then we put all data in single framework & apply various statistical tools to find out the dynamic on the market.
During the analysis stage, feedback from the stakeholder groups would be compared to determine areas of agreement as well as areas of divergence