

Key Insights
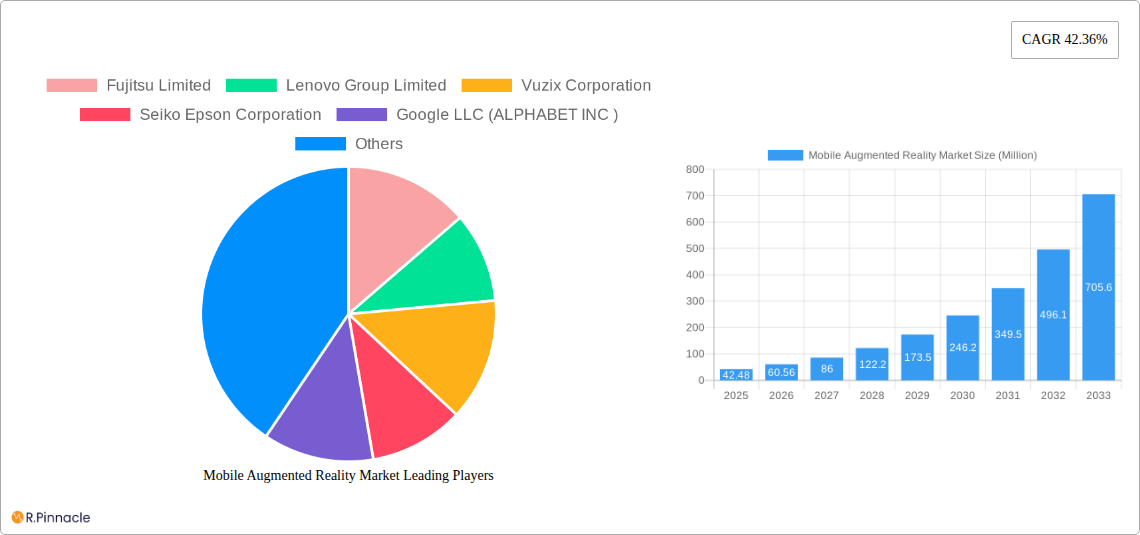
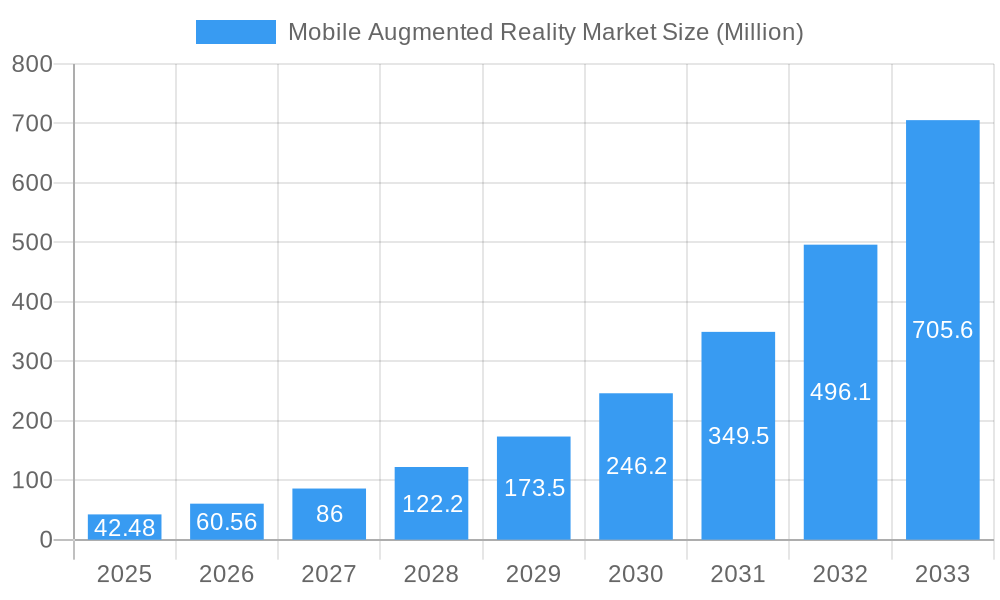
The mobile augmented reality (MAR) market is experiencing explosive growth, projected to reach \$42.48 million in 2025 and exhibiting a remarkable Compound Annual Growth Rate (CAGR) of 42.36%. This surge is fueled by several key drivers. The increasing affordability and accessibility of smartphones with advanced processing power and camera capabilities are making MAR technology more readily available to consumers and businesses. Furthermore, the proliferation of robust software solutions—including advanced object tracking, image recognition, and data analytics—is enhancing the capabilities and application possibilities of MAR, leading to wider adoption across various sectors. The gaming industry is a significant contributor, with immersive gaming experiences driving demand. However, education, healthcare (particularly in surgical planning and training), retail and marketing (through interactive product demonstrations and virtual try-ons), and the automotive industry (for enhanced navigation and maintenance) are also emerging as major market segments. The military and defense sector is leveraging MAR for training simulations and strategic planning, adding further impetus to market expansion.
Mobile Augmented Reality Market Market Size (In Million)
Looking ahead to 2033, the continued evolution of MAR technology and its integration into various aspects of daily life will likely sustain this growth trajectory. However, challenges remain. The need for further improvement in battery life, the potential for user fatigue due to extended use of AR devices, and concerns regarding data privacy and security could temper growth to some extent. Nevertheless, the ongoing development of lightweight and power-efficient hardware, coupled with the increasing sophistication of software algorithms, is likely to overcome these hurdles. The competitive landscape is robust, with key players like Fujitsu, Lenovo, Vuzix, Epson, Google, and Realwear vying for market share through innovation and strategic partnerships. Regional variations in adoption rates are expected, with North America and Asia Pacific likely leading the charge, driven by early adoption of technology and strong consumer demand.
Mobile Augmented Reality Market Company Market Share
Mobile Augmented Reality Market Report: 2019-2033
This comprehensive report provides an in-depth analysis of the Mobile Augmented Reality (MAR) market, offering valuable insights for industry professionals, investors, and strategists. With a study period spanning 2019-2033, a base year of 2025, and a forecast period of 2025-2033, this report delivers a meticulous examination of market dynamics, segmentation, key players, and future trends. The market is expected to reach xx Million by 2033, exhibiting a significant CAGR.
Mobile Augmented Reality Market Market Structure & Innovation Trends
This section analyzes the competitive landscape of the MAR market, encompassing market concentration, innovation drivers, regulatory frameworks, product substitutes, end-user demographics, and mergers and acquisitions (M&A) activities. The market exhibits a moderately consolidated structure with key players such as Fujitsu Limited, Lenovo Group Limited, Vuzix Corporation, and Google LLC (ALPHABET INC) holding significant market share. However, the emergence of smaller, innovative companies is also reshaping the competitive dynamics.
- Market Concentration: The top 5 players account for approximately xx% of the global market share in 2025.
- Innovation Drivers: Advancements in chip technology, improved display technologies, and the development of sophisticated software are driving innovation.
- Regulatory Frameworks: Government regulations regarding data privacy and security are shaping the market's trajectory.
- Product Substitutes: Virtual Reality (VR) technology presents a competitive alternative in certain end-user segments.
- End-User Demographics: The growing adoption of smartphones and tablets, coupled with increasing internet penetration, particularly among younger demographics, is fueling market expansion.
- M&A Activities: The past five years have witnessed several M&A deals in the MAR sector, with deal values exceeding xx Million in total. These activities reflect the consolidation trend and the strategic efforts of larger players to expand their market presence.
Mobile Augmented Reality Market Market Dynamics & Trends
The MAR market is experiencing robust growth driven by several factors. Technological advancements, such as improved processing power, enhanced display resolutions, and the development of advanced software applications, are significantly contributing to market expansion. Consumer preference for immersive experiences, particularly in gaming and entertainment, is also driving demand. The rising adoption of MAR technology across various end-user verticals, including healthcare, retail, and automotive, is further propelling market growth. The market is characterized by a dynamic competitive landscape, with established players and emerging companies vying for market share. This intense competition is fostering innovation and driving down costs, making MAR technology more accessible. The estimated CAGR for the forecast period (2025-2033) is projected at xx%. Market penetration is expected to reach xx% by 2033.
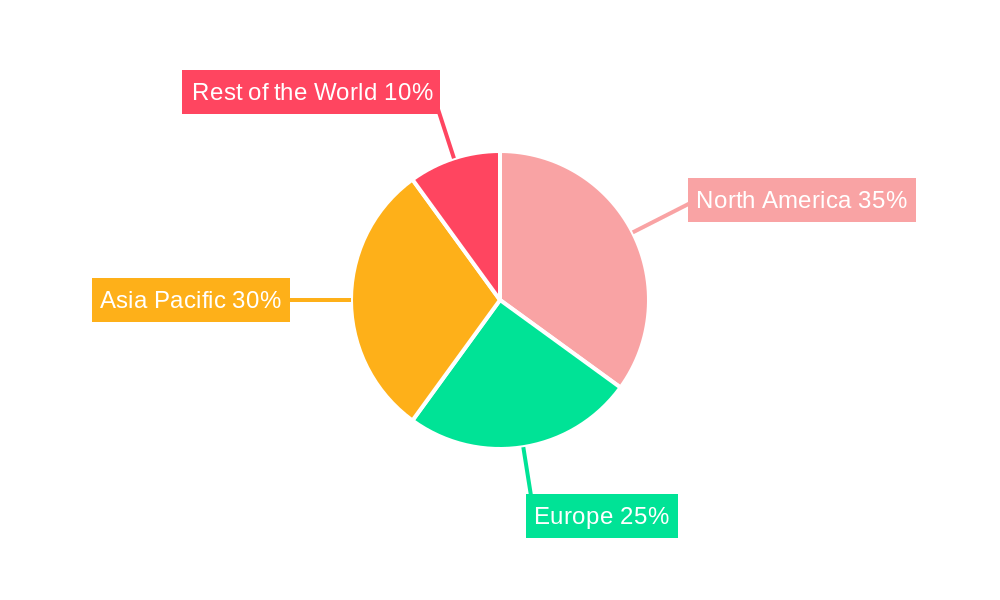
Dominant Regions & Segments in Mobile Augmented Reality Market
North America currently dominates the MAR market, followed by Europe and Asia-Pacific. This dominance is primarily attributed to the high adoption of smartphones, advanced technological infrastructure, and a strong consumer base willing to adopt new technologies.
- Key Drivers for North America: High disposable income, early adoption of new technologies, and robust technological infrastructure.
- Key Drivers for Europe: Growing investment in R&D, supportive government policies, and the presence of major technology companies.
- Key Drivers for Asia-Pacific: Rapidly expanding smartphone market, increasing internet penetration, and a large consumer base.
Segment Dominance:
- Type: Standalone AR devices are projected to hold the largest market share due to their portability and ease of use.
- End User: The gaming segment currently holds a significant market share, followed by the retail and marketing sector and healthcare applications. The automotive and military & defense sectors show promising growth potential.
- Software: Object tracking and image recognition software are currently the most widely adopted, with a strong growth trajectory predicted for data analytics applications.
Mobile Augmented Reality Market Product Innovations
Recent product innovations in the MAR market emphasize improved user experience, enhanced performance, and expanded applications. New devices are characterized by lighter weight, longer battery life, and better display quality. Software innovations focus on creating more realistic and engaging AR experiences, encompassing more robust object recognition, tracking, and data processing capabilities. These innovations are tailored to cater to the growing demands of diverse end-user segments, including gaming, healthcare, and industrial applications, driving overall market growth and adoption.
Report Scope & Segmentation Analysis
This report comprehensively analyzes the MAR market across several segments:
- Type: Standalone, Tethered, Screenless Viewer (Each segment includes projected market size and growth projections for the forecast period.)
- End User: Gaming, Education, Healthcare, Retail and Marketing, Automotive, Military and Defense, Other End-user Verticals (Each segment includes market size estimations and competitive dynamics.)
- Software: Object Tracking, Image Recognition, Data Analytics (Each segment includes growth projections and competitive landscape analyses.)
Each segment's analysis covers market size, growth rate, key players, and competitive dynamics.
Key Drivers of Mobile Augmented Reality Market Growth
The growth of the MAR market is propelled by technological advancements, economic factors, and supportive regulatory environments. The continuous improvement in processing power, display resolution, and sensor technology enhances the user experience, leading to increased adoption. The rising disposable income in developing economies fuels demand for premium AR experiences. Governments’ investments in R&D and supportive policies further promote growth within this sector.
Challenges in the Mobile Augmented Reality Market Sector
The MAR market faces several challenges, including high initial costs of development and deployment, concerns regarding data privacy and security, and the need for continuous technological upgrades to stay competitive. Supply chain disruptions may impact manufacturing and availability, leading to price volatility. Intense competition among players also presents challenges for maintaining market share and profitability.
Emerging Opportunities in Mobile Augmented Reality Market
The integration of MAR technology with other technologies, such as 5G, AI, and IoT, presents significant opportunities for growth. Expansion into new markets, particularly in emerging economies, offers considerable potential. The growing demand for immersive experiences in education, healthcare, and industrial applications presents further opportunities.
Leading Players in the Mobile Augmented Reality Market Market
- Fujitsu Limited
- Lenovo Group Limited
- Vuzix Corporation
- Seiko Epson Corporation
- Google LLC (ALPHABET INC)
- Realwear Inc
- Kopin Corporation
- Optinvent
- Daqri
- Dynabook Europe GmbH
Key Developments in Mobile Augmented Reality Market Industry
- January 2022: Qualcomm and Microsoft partnered to advance augmented reality and the metaverse, focusing on specialized AR chips and integrated software platforms. This collaboration is expected to significantly enhance AR capabilities and accelerate market growth.
- September 2022: Blippar integrated its WebAR SDK into Unity, simplifying AR experience creation and distribution for Unity developers. This development lowers the barrier to entry for AR development, potentially leading to a surge in new AR applications.
Future Outlook for Mobile Augmented Reality Market Market
The future of the MAR market is promising, driven by continuous technological advancements, increased consumer adoption, and expansion into new applications. Strategic partnerships and collaborations among technology companies, along with growing investments in R&D, will further accelerate market growth. The market's long-term potential lies in its ability to transform various sectors, offering immersive and engaging experiences across diverse applications.
Mobile Augmented Reality Market Segmentation
-
1. Type
- 1.1. Standalone
- 1.2. Tethered
- 1.3. Screenless Viewer
-
2. End User
- 2.1. Gaming
- 2.2. Education
- 2.3. Healthcare
- 2.4. Retail and Marketing
- 2.5. Automotive
- 2.6. Military and Defense
- 2.7. Other End-user Verticals
-
3. Software
- 3.1. Object Tracking
- 3.2. Image Recognition
- 3.3. Data Analytics
Mobile Augmented Reality Market Segmentation By Geography
-
1. North America
- 1.1. US
- 1.2. Canada
-
2. Europe
- 2.1. Germany
- 2.2. UK
- 2.3. France
- 2.4. Italy
- 2.5. Rest of Europe
-
3. Asia Pacific
- 3.1. India
- 3.2. China
- 3.3. Japan
- 3.4. Rest of Asia Pacific
- 4. Rest of the World
Mobile Augmented Reality Market Regional Market Share
Geographic Coverage of Mobile Augmented Reality Market
Mobile Augmented Reality Market REPORT HIGHLIGHTS
| Aspects | Details |
|---|---|
| Study Period | 2020-2034 |
| Base Year | 2025 |
| Estimated Year | 2026 |
| Forecast Period | 2026-2034 |
| Historical Period | 2020-2025 |
| Growth Rate | CAGR of 42.36% from 2020-2034 |
| Segmentation |
|
Table of Contents
- 1. Introduction
- 1.1. Research Scope
- 1.2. Market Segmentation
- 1.3. Research Objective
- 1.4. Definitions and Assumptions
- 2. Executive Summary
- 2.1. Market Snapshot
- 3. Market Dynamics
- 3.1. Market Drivers
- 3.2. Market Restrains
- 3.3. Market Trends
- 3.4. Market Opportunities
- 4. Market Factor Analysis
- 4.1. Porters Five Forces
- 4.1.1. Bargaining Power of Suppliers
- 4.1.2. Bargaining Power of Buyers
- 4.1.3. Threat of New Entrants
- 4.1.4. Threat of Substitutes
- 4.1.5. Competitive Rivalry
- 4.2. PESTEL analysis
- 4.3. BCG Analysis
- 4.3.1. Stars (High Growth, High Market Share)
- 4.3.2. Cash Cows (Low Growth, High Market Share)
- 4.3.3. Question Mark (High Growth, Low Market Share)
- 4.3.4. Dogs (Low Growth, Low Market Share)
- 4.4. Ansoff Matrix Analysis
- 4.5. Supply Chain Analysis
- 4.6. Regulatory Landscape
- 4.7. Current Market Potential and Opportunity Assessment (TAM–SAM–SOM Framework)
- 4.8. PRI Analyst Note
- 4.1. Porters Five Forces
- 5. Market Analysis, Insights and Forecast 2021-2033
- 5.1. Market Analysis, Insights and Forecast - by Type
- 5.1.1. Standalone
- 5.1.2. Tethered
- 5.1.3. Screenless Viewer
- 5.2. Market Analysis, Insights and Forecast - by End User
- 5.2.1. Gaming
- 5.2.2. Education
- 5.2.3. Healthcare
- 5.2.4. Retail and Marketing
- 5.2.5. Automotive
- 5.2.6. Military and Defense
- 5.2.7. Other End-user Verticals
- 5.3. Market Analysis, Insights and Forecast - by Software
- 5.3.1. Object Tracking
- 5.3.2. Image Recognition
- 5.3.3. Data Analytics
- 5.4. Market Analysis, Insights and Forecast - by Region
- 5.4.1. North America
- 5.4.2. Europe
- 5.4.3. Asia Pacific
- 5.4.4. Rest of the World
- 5.1. Market Analysis, Insights and Forecast - by Type
- 6. Global Mobile Augmented Reality Market Analysis, Insights and Forecast, 2021-2033
- 6.1. Market Analysis, Insights and Forecast - by Type
- 6.1.1. Standalone
- 6.1.2. Tethered
- 6.1.3. Screenless Viewer
- 6.2. Market Analysis, Insights and Forecast - by End User
- 6.2.1. Gaming
- 6.2.2. Education
- 6.2.3. Healthcare
- 6.2.4. Retail and Marketing
- 6.2.5. Automotive
- 6.2.6. Military and Defense
- 6.2.7. Other End-user Verticals
- 6.3. Market Analysis, Insights and Forecast - by Software
- 6.3.1. Object Tracking
- 6.3.2. Image Recognition
- 6.3.3. Data Analytics
- 6.1. Market Analysis, Insights and Forecast - by Type
- 7. North America Mobile Augmented Reality Market Analysis, Insights and Forecast, 2020-2032
- 7.1. Market Analysis, Insights and Forecast - by Type
- 7.1.1. Standalone
- 7.1.2. Tethered
- 7.1.3. Screenless Viewer
- 7.2. Market Analysis, Insights and Forecast - by End User
- 7.2.1. Gaming
- 7.2.2. Education
- 7.2.3. Healthcare
- 7.2.4. Retail and Marketing
- 7.2.5. Automotive
- 7.2.6. Military and Defense
- 7.2.7. Other End-user Verticals
- 7.3. Market Analysis, Insights and Forecast - by Software
- 7.3.1. Object Tracking
- 7.3.2. Image Recognition
- 7.3.3. Data Analytics
- 7.1. Market Analysis, Insights and Forecast - by Type
- 8. Europe Mobile Augmented Reality Market Analysis, Insights and Forecast, 2020-2032
- 8.1. Market Analysis, Insights and Forecast - by Type
- 8.1.1. Standalone
- 8.1.2. Tethered
- 8.1.3. Screenless Viewer
- 8.2. Market Analysis, Insights and Forecast - by End User
- 8.2.1. Gaming
- 8.2.2. Education
- 8.2.3. Healthcare
- 8.2.4. Retail and Marketing
- 8.2.5. Automotive
- 8.2.6. Military and Defense
- 8.2.7. Other End-user Verticals
- 8.3. Market Analysis, Insights and Forecast - by Software
- 8.3.1. Object Tracking
- 8.3.2. Image Recognition
- 8.3.3. Data Analytics
- 8.1. Market Analysis, Insights and Forecast - by Type
- 9. Asia Pacific Mobile Augmented Reality Market Analysis, Insights and Forecast, 2020-2032
- 9.1. Market Analysis, Insights and Forecast - by Type
- 9.1.1. Standalone
- 9.1.2. Tethered
- 9.1.3. Screenless Viewer
- 9.2. Market Analysis, Insights and Forecast - by End User
- 9.2.1. Gaming
- 9.2.2. Education
- 9.2.3. Healthcare
- 9.2.4. Retail and Marketing
- 9.2.5. Automotive
- 9.2.6. Military and Defense
- 9.2.7. Other End-user Verticals
- 9.3. Market Analysis, Insights and Forecast - by Software
- 9.3.1. Object Tracking
- 9.3.2. Image Recognition
- 9.3.3. Data Analytics
- 9.1. Market Analysis, Insights and Forecast - by Type
- 10. Rest of the World Mobile Augmented Reality Market Analysis, Insights and Forecast, 2020-2032
- 10.1. Market Analysis, Insights and Forecast - by Type
- 10.1.1. Standalone
- 10.1.2. Tethered
- 10.1.3. Screenless Viewer
- 10.2. Market Analysis, Insights and Forecast - by End User
- 10.2.1. Gaming
- 10.2.2. Education
- 10.2.3. Healthcare
- 10.2.4. Retail and Marketing
- 10.2.5. Automotive
- 10.2.6. Military and Defense
- 10.2.7. Other End-user Verticals
- 10.3. Market Analysis, Insights and Forecast - by Software
- 10.3.1. Object Tracking
- 10.3.2. Image Recognition
- 10.3.3. Data Analytics
- 10.1. Market Analysis, Insights and Forecast - by Type
- 11. Competitive Analysis
- 11.1. Company Profiles
- 11.1.1 Fujitsu Limited
- 11.1.1.1. Company Overview
- 11.1.1.2. Products
- 11.1.1.3. Company Financials
- 11.1.1.4. SWOT Analysis
- 11.1.2 Lenovo Group Limited
- 11.1.2.1. Company Overview
- 11.1.2.2. Products
- 11.1.2.3. Company Financials
- 11.1.2.4. SWOT Analysis
- 11.1.3 Vuzix Corporation
- 11.1.3.1. Company Overview
- 11.1.3.2. Products
- 11.1.3.3. Company Financials
- 11.1.3.4. SWOT Analysis
- 11.1.4 Seiko Epson Corporation
- 11.1.4.1. Company Overview
- 11.1.4.2. Products
- 11.1.4.3. Company Financials
- 11.1.4.4. SWOT Analysis
- 11.1.5 Google LLC (ALPHABET INC )
- 11.1.5.1. Company Overview
- 11.1.5.2. Products
- 11.1.5.3. Company Financials
- 11.1.5.4. SWOT Analysis
- 11.1.6 Realwear Inc
- 11.1.6.1. Company Overview
- 11.1.6.2. Products
- 11.1.6.3. Company Financials
- 11.1.6.4. SWOT Analysis
- 11.1.7 Kopin Corporation
- 11.1.7.1. Company Overview
- 11.1.7.2. Products
- 11.1.7.3. Company Financials
- 11.1.7.4. SWOT Analysis
- 11.1.8 Optinvent
- 11.1.8.1. Company Overview
- 11.1.8.2. Products
- 11.1.8.3. Company Financials
- 11.1.8.4. SWOT Analysis
- 11.1.9 Daqri
- 11.1.9.1. Company Overview
- 11.1.9.2. Products
- 11.1.9.3. Company Financials
- 11.1.9.4. SWOT Analysis
- 11.1.10 Dynabook Europe GmbH
- 11.1.10.1. Company Overview
- 11.1.10.2. Products
- 11.1.10.3. Company Financials
- 11.1.10.4. SWOT Analysis
- 11.1.1 Fujitsu Limited
- 11.2. Market Entropy
- 11.2.1 Company's Key Areas Served
- 11.2.2 Recent Developments
- 11.3. Company Market Share Analysis 2025
- 11.3.1 Top 5 Companies Market Share Analysis
- 11.3.2 Top 3 Companies Market Share Analysis
- 11.4. List of Potential Customers
- 12. Research Methodology
List of Figures
- Figure 1: Global Mobile Augmented Reality Market Revenue Breakdown (Million, %) by Region 2025 & 2033
- Figure 2: Global Mobile Augmented Reality Market Volume Breakdown (K Unit, %) by Region 2025 & 2033
- Figure 3: North America Mobile Augmented Reality Market Revenue (Million), by Type 2025 & 2033
- Figure 4: North America Mobile Augmented Reality Market Volume (K Unit), by Type 2025 & 2033
- Figure 5: North America Mobile Augmented Reality Market Revenue Share (%), by Type 2025 & 2033
- Figure 6: North America Mobile Augmented Reality Market Volume Share (%), by Type 2025 & 2033
- Figure 7: North America Mobile Augmented Reality Market Revenue (Million), by End User 2025 & 2033
- Figure 8: North America Mobile Augmented Reality Market Volume (K Unit), by End User 2025 & 2033
- Figure 9: North America Mobile Augmented Reality Market Revenue Share (%), by End User 2025 & 2033
- Figure 10: North America Mobile Augmented Reality Market Volume Share (%), by End User 2025 & 2033
- Figure 11: North America Mobile Augmented Reality Market Revenue (Million), by Software 2025 & 2033
- Figure 12: North America Mobile Augmented Reality Market Volume (K Unit), by Software 2025 & 2033
- Figure 13: North America Mobile Augmented Reality Market Revenue Share (%), by Software 2025 & 2033
- Figure 14: North America Mobile Augmented Reality Market Volume Share (%), by Software 2025 & 2033
- Figure 15: North America Mobile Augmented Reality Market Revenue (Million), by Country 2025 & 2033
- Figure 16: North America Mobile Augmented Reality Market Volume (K Unit), by Country 2025 & 2033
- Figure 17: North America Mobile Augmented Reality Market Revenue Share (%), by Country 2025 & 2033
- Figure 18: North America Mobile Augmented Reality Market Volume Share (%), by Country 2025 & 2033
- Figure 19: Europe Mobile Augmented Reality Market Revenue (Million), by Type 2025 & 2033
- Figure 20: Europe Mobile Augmented Reality Market Volume (K Unit), by Type 2025 & 2033
- Figure 21: Europe Mobile Augmented Reality Market Revenue Share (%), by Type 2025 & 2033
- Figure 22: Europe Mobile Augmented Reality Market Volume Share (%), by Type 2025 & 2033
- Figure 23: Europe Mobile Augmented Reality Market Revenue (Million), by End User 2025 & 2033
- Figure 24: Europe Mobile Augmented Reality Market Volume (K Unit), by End User 2025 & 2033
- Figure 25: Europe Mobile Augmented Reality Market Revenue Share (%), by End User 2025 & 2033
- Figure 26: Europe Mobile Augmented Reality Market Volume Share (%), by End User 2025 & 2033
- Figure 27: Europe Mobile Augmented Reality Market Revenue (Million), by Software 2025 & 2033
- Figure 28: Europe Mobile Augmented Reality Market Volume (K Unit), by Software 2025 & 2033
- Figure 29: Europe Mobile Augmented Reality Market Revenue Share (%), by Software 2025 & 2033
- Figure 30: Europe Mobile Augmented Reality Market Volume Share (%), by Software 2025 & 2033
- Figure 31: Europe Mobile Augmented Reality Market Revenue (Million), by Country 2025 & 2033
- Figure 32: Europe Mobile Augmented Reality Market Volume (K Unit), by Country 2025 & 2033
- Figure 33: Europe Mobile Augmented Reality Market Revenue Share (%), by Country 2025 & 2033
- Figure 34: Europe Mobile Augmented Reality Market Volume Share (%), by Country 2025 & 2033
- Figure 35: Asia Pacific Mobile Augmented Reality Market Revenue (Million), by Type 2025 & 2033
- Figure 36: Asia Pacific Mobile Augmented Reality Market Volume (K Unit), by Type 2025 & 2033
- Figure 37: Asia Pacific Mobile Augmented Reality Market Revenue Share (%), by Type 2025 & 2033
- Figure 38: Asia Pacific Mobile Augmented Reality Market Volume Share (%), by Type 2025 & 2033
- Figure 39: Asia Pacific Mobile Augmented Reality Market Revenue (Million), by End User 2025 & 2033
- Figure 40: Asia Pacific Mobile Augmented Reality Market Volume (K Unit), by End User 2025 & 2033
- Figure 41: Asia Pacific Mobile Augmented Reality Market Revenue Share (%), by End User 2025 & 2033
- Figure 42: Asia Pacific Mobile Augmented Reality Market Volume Share (%), by End User 2025 & 2033
- Figure 43: Asia Pacific Mobile Augmented Reality Market Revenue (Million), by Software 2025 & 2033
- Figure 44: Asia Pacific Mobile Augmented Reality Market Volume (K Unit), by Software 2025 & 2033
- Figure 45: Asia Pacific Mobile Augmented Reality Market Revenue Share (%), by Software 2025 & 2033
- Figure 46: Asia Pacific Mobile Augmented Reality Market Volume Share (%), by Software 2025 & 2033
- Figure 47: Asia Pacific Mobile Augmented Reality Market Revenue (Million), by Country 2025 & 2033
- Figure 48: Asia Pacific Mobile Augmented Reality Market Volume (K Unit), by Country 2025 & 2033
- Figure 49: Asia Pacific Mobile Augmented Reality Market Revenue Share (%), by Country 2025 & 2033
- Figure 50: Asia Pacific Mobile Augmented Reality Market Volume Share (%), by Country 2025 & 2033
- Figure 51: Rest of the World Mobile Augmented Reality Market Revenue (Million), by Type 2025 & 2033
- Figure 52: Rest of the World Mobile Augmented Reality Market Volume (K Unit), by Type 2025 & 2033
- Figure 53: Rest of the World Mobile Augmented Reality Market Revenue Share (%), by Type 2025 & 2033
- Figure 54: Rest of the World Mobile Augmented Reality Market Volume Share (%), by Type 2025 & 2033
- Figure 55: Rest of the World Mobile Augmented Reality Market Revenue (Million), by End User 2025 & 2033
- Figure 56: Rest of the World Mobile Augmented Reality Market Volume (K Unit), by End User 2025 & 2033
- Figure 57: Rest of the World Mobile Augmented Reality Market Revenue Share (%), by End User 2025 & 2033
- Figure 58: Rest of the World Mobile Augmented Reality Market Volume Share (%), by End User 2025 & 2033
- Figure 59: Rest of the World Mobile Augmented Reality Market Revenue (Million), by Software 2025 & 2033
- Figure 60: Rest of the World Mobile Augmented Reality Market Volume (K Unit), by Software 2025 & 2033
- Figure 61: Rest of the World Mobile Augmented Reality Market Revenue Share (%), by Software 2025 & 2033
- Figure 62: Rest of the World Mobile Augmented Reality Market Volume Share (%), by Software 2025 & 2033
- Figure 63: Rest of the World Mobile Augmented Reality Market Revenue (Million), by Country 2025 & 2033
- Figure 64: Rest of the World Mobile Augmented Reality Market Volume (K Unit), by Country 2025 & 2033
- Figure 65: Rest of the World Mobile Augmented Reality Market Revenue Share (%), by Country 2025 & 2033
- Figure 66: Rest of the World Mobile Augmented Reality Market Volume Share (%), by Country 2025 & 2033
List of Tables
- Table 1: Global Mobile Augmented Reality Market Revenue Million Forecast, by Type 2020 & 2033
- Table 2: Global Mobile Augmented Reality Market Volume K Unit Forecast, by Type 2020 & 2033
- Table 3: Global Mobile Augmented Reality Market Revenue Million Forecast, by End User 2020 & 2033
- Table 4: Global Mobile Augmented Reality Market Volume K Unit Forecast, by End User 2020 & 2033
- Table 5: Global Mobile Augmented Reality Market Revenue Million Forecast, by Software 2020 & 2033
- Table 6: Global Mobile Augmented Reality Market Volume K Unit Forecast, by Software 2020 & 2033
- Table 7: Global Mobile Augmented Reality Market Revenue Million Forecast, by Region 2020 & 2033
- Table 8: Global Mobile Augmented Reality Market Volume K Unit Forecast, by Region 2020 & 2033
- Table 9: Global Mobile Augmented Reality Market Revenue Million Forecast, by Type 2020 & 2033
- Table 10: Global Mobile Augmented Reality Market Volume K Unit Forecast, by Type 2020 & 2033
- Table 11: Global Mobile Augmented Reality Market Revenue Million Forecast, by End User 2020 & 2033
- Table 12: Global Mobile Augmented Reality Market Volume K Unit Forecast, by End User 2020 & 2033
- Table 13: Global Mobile Augmented Reality Market Revenue Million Forecast, by Software 2020 & 2033
- Table 14: Global Mobile Augmented Reality Market Volume K Unit Forecast, by Software 2020 & 2033
- Table 15: Global Mobile Augmented Reality Market Revenue Million Forecast, by Country 2020 & 2033
- Table 16: Global Mobile Augmented Reality Market Volume K Unit Forecast, by Country 2020 & 2033
- Table 17: US Mobile Augmented Reality Market Revenue (Million) Forecast, by Application 2020 & 2033
- Table 18: US Mobile Augmented Reality Market Volume (K Unit) Forecast, by Application 2020 & 2033
- Table 19: Canada Mobile Augmented Reality Market Revenue (Million) Forecast, by Application 2020 & 2033
- Table 20: Canada Mobile Augmented Reality Market Volume (K Unit) Forecast, by Application 2020 & 2033
- Table 21: Global Mobile Augmented Reality Market Revenue Million Forecast, by Type 2020 & 2033
- Table 22: Global Mobile Augmented Reality Market Volume K Unit Forecast, by Type 2020 & 2033
- Table 23: Global Mobile Augmented Reality Market Revenue Million Forecast, by End User 2020 & 2033
- Table 24: Global Mobile Augmented Reality Market Volume K Unit Forecast, by End User 2020 & 2033
- Table 25: Global Mobile Augmented Reality Market Revenue Million Forecast, by Software 2020 & 2033
- Table 26: Global Mobile Augmented Reality Market Volume K Unit Forecast, by Software 2020 & 2033
- Table 27: Global Mobile Augmented Reality Market Revenue Million Forecast, by Country 2020 & 2033
- Table 28: Global Mobile Augmented Reality Market Volume K Unit Forecast, by Country 2020 & 2033
- Table 29: Germany Mobile Augmented Reality Market Revenue (Million) Forecast, by Application 2020 & 2033
- Table 30: Germany Mobile Augmented Reality Market Volume (K Unit) Forecast, by Application 2020 & 2033
- Table 31: UK Mobile Augmented Reality Market Revenue (Million) Forecast, by Application 2020 & 2033
- Table 32: UK Mobile Augmented Reality Market Volume (K Unit) Forecast, by Application 2020 & 2033
- Table 33: France Mobile Augmented Reality Market Revenue (Million) Forecast, by Application 2020 & 2033
- Table 34: France Mobile Augmented Reality Market Volume (K Unit) Forecast, by Application 2020 & 2033
- Table 35: Italy Mobile Augmented Reality Market Revenue (Million) Forecast, by Application 2020 & 2033
- Table 36: Italy Mobile Augmented Reality Market Volume (K Unit) Forecast, by Application 2020 & 2033
- Table 37: Rest of Europe Mobile Augmented Reality Market Revenue (Million) Forecast, by Application 2020 & 2033
- Table 38: Rest of Europe Mobile Augmented Reality Market Volume (K Unit) Forecast, by Application 2020 & 2033
- Table 39: Global Mobile Augmented Reality Market Revenue Million Forecast, by Type 2020 & 2033
- Table 40: Global Mobile Augmented Reality Market Volume K Unit Forecast, by Type 2020 & 2033
- Table 41: Global Mobile Augmented Reality Market Revenue Million Forecast, by End User 2020 & 2033
- Table 42: Global Mobile Augmented Reality Market Volume K Unit Forecast, by End User 2020 & 2033
- Table 43: Global Mobile Augmented Reality Market Revenue Million Forecast, by Software 2020 & 2033
- Table 44: Global Mobile Augmented Reality Market Volume K Unit Forecast, by Software 2020 & 2033
- Table 45: Global Mobile Augmented Reality Market Revenue Million Forecast, by Country 2020 & 2033
- Table 46: Global Mobile Augmented Reality Market Volume K Unit Forecast, by Country 2020 & 2033
- Table 47: India Mobile Augmented Reality Market Revenue (Million) Forecast, by Application 2020 & 2033
- Table 48: India Mobile Augmented Reality Market Volume (K Unit) Forecast, by Application 2020 & 2033
- Table 49: China Mobile Augmented Reality Market Revenue (Million) Forecast, by Application 2020 & 2033
- Table 50: China Mobile Augmented Reality Market Volume (K Unit) Forecast, by Application 2020 & 2033
- Table 51: Japan Mobile Augmented Reality Market Revenue (Million) Forecast, by Application 2020 & 2033
- Table 52: Japan Mobile Augmented Reality Market Volume (K Unit) Forecast, by Application 2020 & 2033
- Table 53: Rest of Asia Pacific Mobile Augmented Reality Market Revenue (Million) Forecast, by Application 2020 & 2033
- Table 54: Rest of Asia Pacific Mobile Augmented Reality Market Volume (K Unit) Forecast, by Application 2020 & 2033
- Table 55: Global Mobile Augmented Reality Market Revenue Million Forecast, by Type 2020 & 2033
- Table 56: Global Mobile Augmented Reality Market Volume K Unit Forecast, by Type 2020 & 2033
- Table 57: Global Mobile Augmented Reality Market Revenue Million Forecast, by End User 2020 & 2033
- Table 58: Global Mobile Augmented Reality Market Volume K Unit Forecast, by End User 2020 & 2033
- Table 59: Global Mobile Augmented Reality Market Revenue Million Forecast, by Software 2020 & 2033
- Table 60: Global Mobile Augmented Reality Market Volume K Unit Forecast, by Software 2020 & 2033
- Table 61: Global Mobile Augmented Reality Market Revenue Million Forecast, by Country 2020 & 2033
- Table 62: Global Mobile Augmented Reality Market Volume K Unit Forecast, by Country 2020 & 2033
Frequently Asked Questions
1. What is the projected Compound Annual Growth Rate (CAGR) of the Mobile Augmented Reality Market?
The projected CAGR is approximately 42.36%.
2. Which companies are prominent players in the Mobile Augmented Reality Market?
Key companies in the market include Fujitsu Limited, Lenovo Group Limited, Vuzix Corporation, Seiko Epson Corporation, Google LLC (ALPHABET INC ), Realwear Inc, Kopin Corporation, Optinvent, Daqri, Dynabook Europe GmbH.
3. What are the main segments of the Mobile Augmented Reality Market?
The market segments include Type, End User, Software.
4. Can you provide details about the market size?
The market size is estimated to be USD 42.48 Million as of 2022.
5. What are some drivers contributing to market growth?
Increasing Applications of Augmented Reality; High Demand for Mobile-based Augmented Reality.
6. What are the notable trends driving market growth?
Hardware to Exhibit Higher Growth.
7. Are there any restraints impacting market growth?
Security Issues Associated with Mobile Payments.
8. Can you provide examples of recent developments in the market?
January 2022 - Qualcomm and Microsoft announced a partnership to advance and accelerate augmented reality and open up new portals to the metaverse. The businesses will work together to design unique augmented reality chips and integrate software platforms.
9. What pricing options are available for accessing the report?
Pricing options include single-user, multi-user, and enterprise licenses priced at USD 4750, USD 5250, and USD 8750 respectively.
10. Is the market size provided in terms of value or volume?
The market size is provided in terms of value, measured in Million and volume, measured in K Unit.
11. Are there any specific market keywords associated with the report?
Yes, the market keyword associated with the report is "Mobile Augmented Reality Market," which aids in identifying and referencing the specific market segment covered.
12. How do I determine which pricing option suits my needs best?
The pricing options vary based on user requirements and access needs. Individual users may opt for single-user licenses, while businesses requiring broader access may choose multi-user or enterprise licenses for cost-effective access to the report.
13. Are there any additional resources or data provided in the Mobile Augmented Reality Market report?
While the report offers comprehensive insights, it's advisable to review the specific contents or supplementary materials provided to ascertain if additional resources or data are available.
14. How can I stay updated on further developments or reports in the Mobile Augmented Reality Market?
To stay informed about further developments, trends, and reports in the Mobile Augmented Reality Market, consider subscribing to industry newsletters, following relevant companies and organizations, or regularly checking reputable industry news sources and publications.
Methodology
Step 1 - Identification of Relevant Samples Size from Population Database


Step 2 - Approaches for Defining Global Market Size (Value, Volume* & Price*)

Note*: In applicable scenarios
Step 3 - Data Sources
Primary Research
- Web Analytics
- Survey Reports
- Research Institute
- Latest Research Reports
- Opinion Leaders
Secondary Research
- Annual Reports
- White Paper
- Latest Press Release
- Industry Association
- Paid Database
- Investor Presentations

Step 4 - Data Triangulation
Involves using different sources of information in order to increase the validity of a study
These sources are likely to be stakeholders in a program - participants, other researchers, program staff, other community members, and so on.
Then we put all data in single framework & apply various statistical tools to find out the dynamic on the market.
During the analysis stage, feedback from the stakeholder groups would be compared to determine areas of agreement as well as areas of divergence