

Key Insights
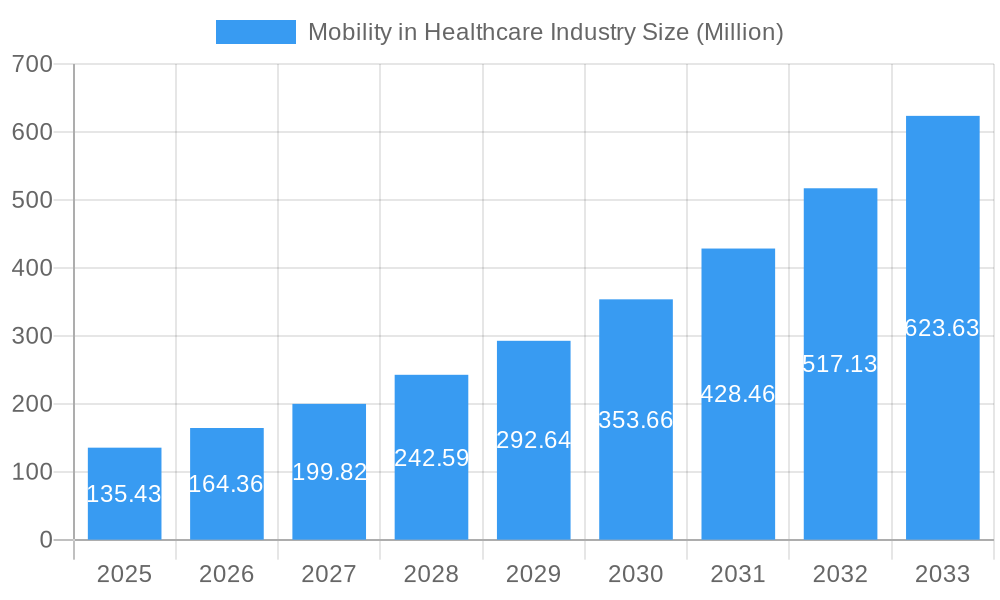
The global mobility in healthcare market, valued at $135.43 million in 2025, is projected to experience robust growth, driven by a compound annual growth rate (CAGR) of 21.32% from 2025 to 2033. This expansion is fueled by several key factors. The increasing adoption of mobile health (mHealth) applications for remote patient monitoring, telehealth consultations, and chronic disease management is significantly impacting market growth. Furthermore, the rising demand for efficient workforce management solutions, particularly in hospitals and clinics, is driving the need for enterprise mobility platforms and related services. The integration of mobile devices and applications into healthcare workflows enhances operational efficiency, improves patient care, and streamlines administrative tasks, creating a compelling value proposition for healthcare providers and payers. Significant advancements in mobile technology, including improved data security and enhanced user interfaces, are also contributing to market expansion. The market is segmented by products and services (enterprise mobility platforms, mobile applications, mobile devices), application (enterprise solutions, workforce management, mHealth applications), and end-users (payers, providers, patients), each exhibiting unique growth trajectories. Geographic regions, including North America, Europe, and Asia-Pacific, represent substantial market opportunities, with varying levels of adoption and technological advancement influencing regional growth rates.
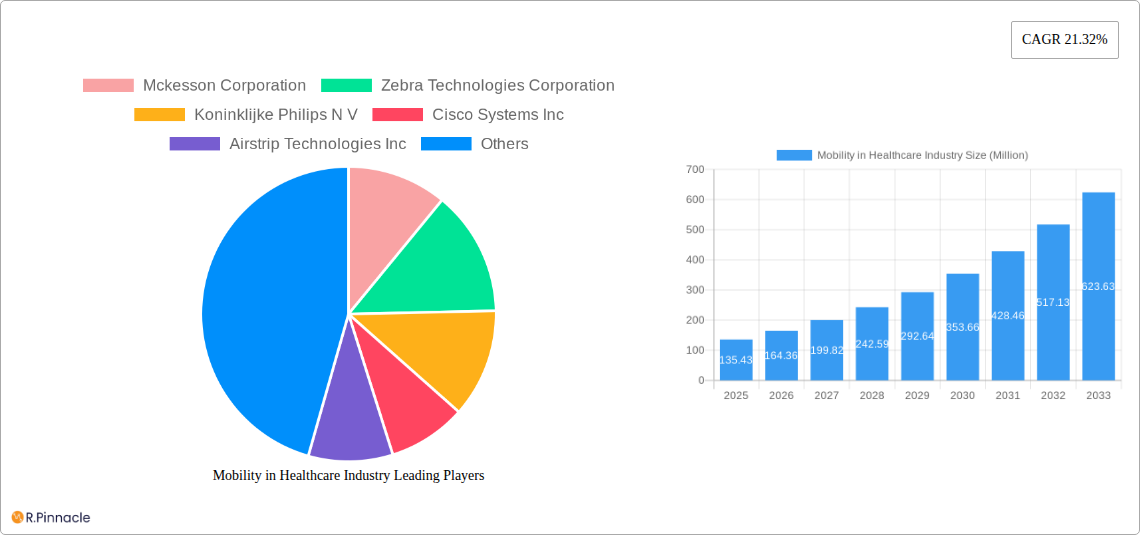
Mobility in Healthcare Industry Market Size (In Million)
The market's growth is not without its challenges. Concerns regarding data privacy and security remain a significant restraint, requiring robust security measures and regulatory compliance. The varying levels of digital literacy among healthcare professionals and patients can also impede wider adoption of mobile solutions. However, ongoing investments in digital infrastructure, coupled with increasing government initiatives promoting telehealth and remote patient monitoring, are expected to mitigate these challenges and accelerate market growth. The competitive landscape is characterized by a mix of established technology companies, healthcare providers, and specialized mHealth solution providers. Strategic partnerships and mergers and acquisitions are anticipated to reshape the market dynamics in the coming years, fostering innovation and expanding market reach. The long-term outlook for the mobility in healthcare market remains exceptionally positive, with substantial potential for growth and transformation within the healthcare industry.
Mobility in Healthcare Industry Company Market Share
Unlocking Growth in the $xx Billion Mobility in Healthcare Industry: A Comprehensive Market Report (2019-2033)
This comprehensive report provides a detailed analysis of the Mobility in Healthcare Industry, offering actionable insights for industry professionals, investors, and strategists. The study period covers 2019-2033, with a base year of 2025 and a forecast period of 2025-2033. We project a market size of $xx Billion by 2025 and significant growth through 2033. This report leverages data from the historical period (2019-2024) to predict future trends and opportunities, providing a robust foundation for informed decision-making.
Mobility in Healthcare Industry Market Structure & Innovation Trends
The Mobility in Healthcare Industry exhibits a moderately concentrated market structure, with key players like McKesson Corporation, Zebra Technologies Corporation, and Koninklijke Philips N.V. holding significant market share. The exact market share percentages are dynamic and vary across segments, but we estimate the top 5 players collectively command approximately xx% of the overall market in 2025. Innovation is driven by increasing demand for improved patient care, streamlined workflows, and reduced healthcare costs. Regulatory frameworks, such as HIPAA compliance in the US, heavily influence market development. Product substitutes are limited, primarily focusing on legacy systems, which are gradually being replaced by mobile solutions. End-user demographics are shifting towards a greater adoption of mobile technologies by all stakeholders (payers, providers, and patients). M&A activity within the industry has been robust in recent years, with deal values exceeding $xx Billion in the past five years. This activity is driven by companies aiming to expand their product portfolios and market reach.
- Key Players: McKesson Corporation, Zebra Technologies Corporation, Koninklijke Philips N.V., Cisco Systems Inc., Airstrip Technologies Inc., Omron Corporation, AT&T Inc., SAP SE, Oracle Cerner.
- Market Concentration: Moderately concentrated, with top 5 players holding approximately xx% market share in 2025.
- M&A Activity: Deal values exceeding $xx Billion in the past 5 years.
Mobility in Healthcare Industry Market Dynamics & Trends
The Mobility in Healthcare Industry is experiencing robust growth, driven primarily by the increasing adoption of mobile technologies across various healthcare settings. The market is projected to witness a Compound Annual Growth Rate (CAGR) of xx% during the forecast period (2025-2033). Technological advancements, particularly in areas such as 5G connectivity, artificial intelligence (AI), and the Internet of Medical Things (IoMT), are major disruptors shaping the market landscape. Consumer preferences are increasingly favoring user-friendly, convenient, and cost-effective mobile healthcare solutions. Competitive dynamics are intense, with established players and new entrants vying for market share through innovation, strategic partnerships, and acquisitions. Market penetration of mobile health applications is expected to reach xx% by 2033.
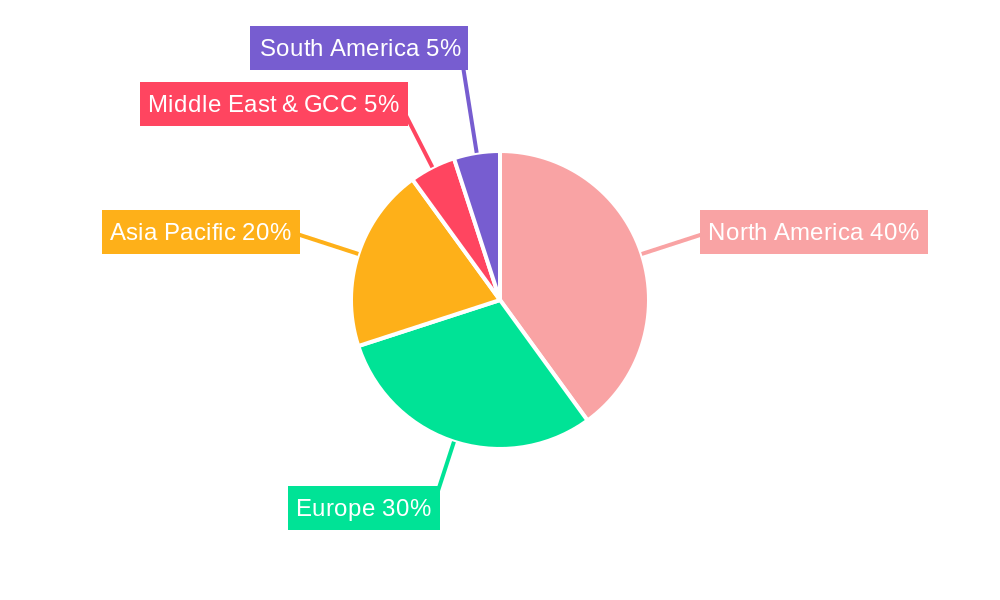
Dominant Regions & Segments in Mobility in Healthcare Industry
North America currently holds the dominant position in the global Mobility in Healthcare Industry, primarily due to advanced technological infrastructure, high adoption rates, and substantial investments in healthcare IT. Within the segments, Enterprise Mobility Platforms and mHealth applications demonstrate substantial growth potential.
- Leading Region: North America
- Key Drivers (North America):
- Advanced technological infrastructure
- High healthcare expenditure
- Favorable regulatory environment
- Strong adoption of telehealth and remote patient monitoring
- High-Growth Segments: Enterprise Mobility Platforms and mHealth Applications. Detailed dominance analysis within each segment is provided in the full report.
Mobility in Healthcare Industry Product Innovations
The industry is witnessing rapid innovation in mobile devices, applications, and platforms specifically designed for healthcare. New features like AI-powered diagnostics, integrated telehealth capabilities, and enhanced data security are prominent. This innovation directly addresses the market's need for improved patient outcomes, increased efficiency, and reduced operational costs. The convergence of mobile technology with other healthcare technologies, such as wearable sensors and remote monitoring devices, is creating new opportunities for growth.
Report Scope & Segmentation Analysis
This report comprehensively segments the Mobility in Healthcare Industry by Products and Services (Enterprise Mobility Platforms, Mobile Applications (Apps), Mobile Devices), Application (Enterprise Solutions, Workforce Management, mHealth Applications), and End User (Payers, Providers, Patients). Each segment is analyzed in detail, providing market size estimations, growth projections, and competitive landscape analysis for the forecast period (2025-2033). Growth is expected to be robust across all segments, but particular emphasis is placed on the growth drivers and dynamics within each segment.
Key Drivers of Mobility in Healthcare Industry Growth
Several factors contribute to the growth of the Mobility in Healthcare Industry. The increasing prevalence of chronic diseases, coupled with the rising demand for remote patient monitoring and telehealth services, is a primary driver. Government initiatives promoting digital health technologies and favorable regulatory frameworks further accelerate market expansion. Technological advancements such as AI and 5G are revolutionizing healthcare delivery, fostering innovation and improved patient outcomes. Economic factors, including increasing healthcare expenditure and the pursuit of cost-effective solutions, also drive market growth.
Challenges in the Mobility in Healthcare Industry Sector
The Mobility in Healthcare Industry faces significant challenges, including stringent regulatory compliance requirements (such as HIPAA), concerns regarding data security and privacy, and the integration of mobile solutions with existing legacy systems. Supply chain disruptions and the high cost of implementation are additional factors impacting market growth. The report quantifies these impacts and offers potential mitigation strategies.
Emerging Opportunities in Mobility in Healthcare Industry
Emerging opportunities include the expanding adoption of AI-powered diagnostics and predictive analytics, the growth of wearable healthcare technology, and the increasing demand for personalized medicine solutions. Furthermore, the penetration of mobile healthcare solutions in emerging markets presents substantial untapped potential. These opportunities are detailed in the full report, offering strategic insights for market participants.
Leading Players in the Mobility in Healthcare Industry Market
Key Developments in Mobility in Healthcare Industry Industry
- August 2022: Indonesia's Health Ministry launched the Indonesia Health Services platform, signifying a major step in the country's digital health transformation. This initiative is expected to significantly boost the adoption of mobile health solutions in Indonesia.
- June 2022: athenahealth, Inc. launched its athenaOne Voice Assistant, a voice-driven digital companion that enhances clinical workflow efficiency for providers using athenahealth's EHR solution. This launch highlights the growing importance of AI and voice technology in mobile healthcare.
Future Outlook for Mobility in Healthcare Industry Market
The future outlook for the Mobility in Healthcare Industry is exceptionally promising. Continued technological advancements, coupled with increasing demand for efficient and cost-effective healthcare solutions, will drive substantial market growth. The expansion of telehealth services, the growing adoption of mobile health applications, and the integration of AI and IoT in healthcare will create significant opportunities for market players. Strategic partnerships, mergers, and acquisitions are anticipated to shape the industry landscape further.
Mobility in Healthcare Industry Segmentation
-
1. Products and Services
- 1.1. Enterprise Mobility Platforms
- 1.2. Mobile Applications (Apps)
- 1.3. Mobile Devices
-
2. Application
-
2.1. Enterprise Solutions
- 2.1.1. Operation Management
- 2.1.2. Patient Care Management
- 2.1.3. Work Force Management
- 2.2. mHealth Applications
-
2.1. Enterprise Solutions
-
3. End User
- 3.1. Payers
- 3.2. Providers
- 3.3. Patients
Mobility in Healthcare Industry Segmentation By Geography
-
1. North America
- 1.1. United States
- 1.2. Canada
- 1.3. Mexico
-
2. Europe
- 2.1. Germany
- 2.2. United Kingdom
- 2.3. France
- 2.4. Italy
- 2.5. Spain
- 2.6. Rest of Europe
-
3. Asia Pacific
- 3.1. China
- 3.2. Japan
- 3.3. India
- 3.4. Australia
- 3.5. South Korea
- 3.6. Rest of Asia Pacific
- 4. Middle East
-
5. GCC
- 5.1. South Africa
- 5.2. Rest of Middle East
-
6. South America
- 6.1. Brazil
- 6.2. Argentina
- 6.3. Rest of South America
Mobility in Healthcare Industry Regional Market Share
Geographic Coverage of Mobility in Healthcare Industry
Mobility in Healthcare Industry REPORT HIGHLIGHTS
| Aspects | Details |
|---|---|
| Study Period | 2020-2034 |
| Base Year | 2025 |
| Estimated Year | 2026 |
| Forecast Period | 2026-2034 |
| Historical Period | 2020-2025 |
| Growth Rate | CAGR of 21.32% from 2020-2034 |
| Segmentation |
|
Table of Contents
- 1. Introduction
- 1.1. Research Scope
- 1.2. Market Segmentation
- 1.3. Research Objective
- 1.4. Definitions and Assumptions
- 2. Executive Summary
- 2.1. Market Snapshot
- 3. Market Dynamics
- 3.1. Market Drivers
- 3.2. Market Restrains
- 3.3. Market Trends
- 3.4. Market Opportunities
- 4. Market Factor Analysis
- 4.1. Porters Five Forces
- 4.1.1. Bargaining Power of Suppliers
- 4.1.2. Bargaining Power of Buyers
- 4.1.3. Threat of New Entrants
- 4.1.4. Threat of Substitutes
- 4.1.5. Competitive Rivalry
- 4.2. PESTEL analysis
- 4.3. BCG Analysis
- 4.3.1. Stars (High Growth, High Market Share)
- 4.3.2. Cash Cows (Low Growth, High Market Share)
- 4.3.3. Question Mark (High Growth, Low Market Share)
- 4.3.4. Dogs (Low Growth, Low Market Share)
- 4.4. Ansoff Matrix Analysis
- 4.5. Supply Chain Analysis
- 4.6. Regulatory Landscape
- 4.7. Current Market Potential and Opportunity Assessment (TAM–SAM–SOM Framework)
- 4.8. PRI Analyst Note
- 4.1. Porters Five Forces
- 5. Market Analysis, Insights and Forecast 2021-2033
- 5.1. Market Analysis, Insights and Forecast - by Products and Services
- 5.1.1. Enterprise Mobility Platforms
- 5.1.2. Mobile Applications (Apps)
- 5.1.3. Mobile Devices
- 5.2. Market Analysis, Insights and Forecast - by Application
- 5.2.1. Enterprise Solutions
- 5.2.1.1. Operation Management
- 5.2.1.2. Patient Care Management
- 5.2.1.3. Work Force Management
- 5.2.2. mHealth Applications
- 5.2.1. Enterprise Solutions
- 5.3. Market Analysis, Insights and Forecast - by End User
- 5.3.1. Payers
- 5.3.2. Providers
- 5.3.3. Patients
- 5.4. Market Analysis, Insights and Forecast - by Region
- 5.4.1. North America
- 5.4.2. Europe
- 5.4.3. Asia Pacific
- 5.4.4. Middle East
- 5.4.5. GCC
- 5.4.6. South America
- 5.1. Market Analysis, Insights and Forecast - by Products and Services
- 6. Global Mobility in Healthcare Industry Analysis, Insights and Forecast, 2021-2033
- 6.1. Market Analysis, Insights and Forecast - by Products and Services
- 6.1.1. Enterprise Mobility Platforms
- 6.1.2. Mobile Applications (Apps)
- 6.1.3. Mobile Devices
- 6.2. Market Analysis, Insights and Forecast - by Application
- 6.2.1. Enterprise Solutions
- 6.2.1.1. Operation Management
- 6.2.1.2. Patient Care Management
- 6.2.1.3. Work Force Management
- 6.2.2. mHealth Applications
- 6.2.1. Enterprise Solutions
- 6.3. Market Analysis, Insights and Forecast - by End User
- 6.3.1. Payers
- 6.3.2. Providers
- 6.3.3. Patients
- 6.1. Market Analysis, Insights and Forecast - by Products and Services
- 7. North America Mobility in Healthcare Industry Analysis, Insights and Forecast, 2020-2032
- 7.1. Market Analysis, Insights and Forecast - by Products and Services
- 7.1.1. Enterprise Mobility Platforms
- 7.1.2. Mobile Applications (Apps)
- 7.1.3. Mobile Devices
- 7.2. Market Analysis, Insights and Forecast - by Application
- 7.2.1. Enterprise Solutions
- 7.2.1.1. Operation Management
- 7.2.1.2. Patient Care Management
- 7.2.1.3. Work Force Management
- 7.2.2. mHealth Applications
- 7.2.1. Enterprise Solutions
- 7.3. Market Analysis, Insights and Forecast - by End User
- 7.3.1. Payers
- 7.3.2. Providers
- 7.3.3. Patients
- 7.1. Market Analysis, Insights and Forecast - by Products and Services
- 8. Europe Mobility in Healthcare Industry Analysis, Insights and Forecast, 2020-2032
- 8.1. Market Analysis, Insights and Forecast - by Products and Services
- 8.1.1. Enterprise Mobility Platforms
- 8.1.2. Mobile Applications (Apps)
- 8.1.3. Mobile Devices
- 8.2. Market Analysis, Insights and Forecast - by Application
- 8.2.1. Enterprise Solutions
- 8.2.1.1. Operation Management
- 8.2.1.2. Patient Care Management
- 8.2.1.3. Work Force Management
- 8.2.2. mHealth Applications
- 8.2.1. Enterprise Solutions
- 8.3. Market Analysis, Insights and Forecast - by End User
- 8.3.1. Payers
- 8.3.2. Providers
- 8.3.3. Patients
- 8.1. Market Analysis, Insights and Forecast - by Products and Services
- 9. Asia Pacific Mobility in Healthcare Industry Analysis, Insights and Forecast, 2020-2032
- 9.1. Market Analysis, Insights and Forecast - by Products and Services
- 9.1.1. Enterprise Mobility Platforms
- 9.1.2. Mobile Applications (Apps)
- 9.1.3. Mobile Devices
- 9.2. Market Analysis, Insights and Forecast - by Application
- 9.2.1. Enterprise Solutions
- 9.2.1.1. Operation Management
- 9.2.1.2. Patient Care Management
- 9.2.1.3. Work Force Management
- 9.2.2. mHealth Applications
- 9.2.1. Enterprise Solutions
- 9.3. Market Analysis, Insights and Forecast - by End User
- 9.3.1. Payers
- 9.3.2. Providers
- 9.3.3. Patients
- 9.1. Market Analysis, Insights and Forecast - by Products and Services
- 10. Middle East Mobility in Healthcare Industry Analysis, Insights and Forecast, 2020-2032
- 10.1. Market Analysis, Insights and Forecast - by Products and Services
- 10.1.1. Enterprise Mobility Platforms
- 10.1.2. Mobile Applications (Apps)
- 10.1.3. Mobile Devices
- 10.2. Market Analysis, Insights and Forecast - by Application
- 10.2.1. Enterprise Solutions
- 10.2.1.1. Operation Management
- 10.2.1.2. Patient Care Management
- 10.2.1.3. Work Force Management
- 10.2.2. mHealth Applications
- 10.2.1. Enterprise Solutions
- 10.3. Market Analysis, Insights and Forecast - by End User
- 10.3.1. Payers
- 10.3.2. Providers
- 10.3.3. Patients
- 10.1. Market Analysis, Insights and Forecast - by Products and Services
- 11. GCC Mobility in Healthcare Industry Analysis, Insights and Forecast, 2020-2032
- 11.1. Market Analysis, Insights and Forecast - by Products and Services
- 11.1.1. Enterprise Mobility Platforms
- 11.1.2. Mobile Applications (Apps)
- 11.1.3. Mobile Devices
- 11.2. Market Analysis, Insights and Forecast - by Application
- 11.2.1. Enterprise Solutions
- 11.2.1.1. Operation Management
- 11.2.1.2. Patient Care Management
- 11.2.1.3. Work Force Management
- 11.2.2. mHealth Applications
- 11.2.1. Enterprise Solutions
- 11.3. Market Analysis, Insights and Forecast - by End User
- 11.3.1. Payers
- 11.3.2. Providers
- 11.3.3. Patients
- 11.1. Market Analysis, Insights and Forecast - by Products and Services
- 12. South America Mobility in Healthcare Industry Analysis, Insights and Forecast, 2020-2032
- 12.1. Market Analysis, Insights and Forecast - by Products and Services
- 12.1.1. Enterprise Mobility Platforms
- 12.1.2. Mobile Applications (Apps)
- 12.1.3. Mobile Devices
- 12.2. Market Analysis, Insights and Forecast - by Application
- 12.2.1. Enterprise Solutions
- 12.2.1.1. Operation Management
- 12.2.1.2. Patient Care Management
- 12.2.1.3. Work Force Management
- 12.2.2. mHealth Applications
- 12.2.1. Enterprise Solutions
- 12.3. Market Analysis, Insights and Forecast - by End User
- 12.3.1. Payers
- 12.3.2. Providers
- 12.3.3. Patients
- 12.1. Market Analysis, Insights and Forecast - by Products and Services
- 13. Competitive Analysis
- 13.1. Company Profiles
- 13.1.1 Mckesson Corporation
- 13.1.1.1. Company Overview
- 13.1.1.2. Products
- 13.1.1.3. Company Financials
- 13.1.1.4. SWOT Analysis
- 13.1.2 Zebra Technologies Corporation
- 13.1.2.1. Company Overview
- 13.1.2.2. Products
- 13.1.2.3. Company Financials
- 13.1.2.4. SWOT Analysis
- 13.1.3 Koninklijke Philips N V
- 13.1.3.1. Company Overview
- 13.1.3.2. Products
- 13.1.3.3. Company Financials
- 13.1.3.4. SWOT Analysis
- 13.1.4 Cisco Systems Inc
- 13.1.4.1. Company Overview
- 13.1.4.2. Products
- 13.1.4.3. Company Financials
- 13.1.4.4. SWOT Analysis
- 13.1.5 Airstrip Technologies Inc
- 13.1.5.1. Company Overview
- 13.1.5.2. Products
- 13.1.5.3. Company Financials
- 13.1.5.4. SWOT Analysis
- 13.1.6 Omron Corporation
- 13.1.6.1. Company Overview
- 13.1.6.2. Products
- 13.1.6.3. Company Financials
- 13.1.6.4. SWOT Analysis
- 13.1.7 At&T Inc
- 13.1.7.1. Company Overview
- 13.1.7.2. Products
- 13.1.7.3. Company Financials
- 13.1.7.4. SWOT Analysis
- 13.1.8 SAP SE
- 13.1.8.1. Company Overview
- 13.1.8.2. Products
- 13.1.8.3. Company Financials
- 13.1.8.4. SWOT Analysis
- 13.1.9 Oracle Cerner
- 13.1.9.1. Company Overview
- 13.1.9.2. Products
- 13.1.9.3. Company Financials
- 13.1.9.4. SWOT Analysis
- 13.1.1 Mckesson Corporation
- 13.2. Market Entropy
- 13.2.1 Company's Key Areas Served
- 13.2.2 Recent Developments
- 13.3. Company Market Share Analysis 2025
- 13.3.1 Top 5 Companies Market Share Analysis
- 13.3.2 Top 3 Companies Market Share Analysis
- 13.4. List of Potential Customers
- 14. Research Methodology
List of Figures
- Figure 1: Global Mobility in Healthcare Industry Revenue Breakdown (Million, %) by Region 2025 & 2033
- Figure 2: Global Mobility in Healthcare Industry Volume Breakdown (K Unit, %) by Region 2025 & 2033
- Figure 3: North America Mobility in Healthcare Industry Revenue (Million), by Products and Services 2025 & 2033
- Figure 4: North America Mobility in Healthcare Industry Volume (K Unit), by Products and Services 2025 & 2033
- Figure 5: North America Mobility in Healthcare Industry Revenue Share (%), by Products and Services 2025 & 2033
- Figure 6: North America Mobility in Healthcare Industry Volume Share (%), by Products and Services 2025 & 2033
- Figure 7: North America Mobility in Healthcare Industry Revenue (Million), by Application 2025 & 2033
- Figure 8: North America Mobility in Healthcare Industry Volume (K Unit), by Application 2025 & 2033
- Figure 9: North America Mobility in Healthcare Industry Revenue Share (%), by Application 2025 & 2033
- Figure 10: North America Mobility in Healthcare Industry Volume Share (%), by Application 2025 & 2033
- Figure 11: North America Mobility in Healthcare Industry Revenue (Million), by End User 2025 & 2033
- Figure 12: North America Mobility in Healthcare Industry Volume (K Unit), by End User 2025 & 2033
- Figure 13: North America Mobility in Healthcare Industry Revenue Share (%), by End User 2025 & 2033
- Figure 14: North America Mobility in Healthcare Industry Volume Share (%), by End User 2025 & 2033
- Figure 15: North America Mobility in Healthcare Industry Revenue (Million), by Country 2025 & 2033
- Figure 16: North America Mobility in Healthcare Industry Volume (K Unit), by Country 2025 & 2033
- Figure 17: North America Mobility in Healthcare Industry Revenue Share (%), by Country 2025 & 2033
- Figure 18: North America Mobility in Healthcare Industry Volume Share (%), by Country 2025 & 2033
- Figure 19: Europe Mobility in Healthcare Industry Revenue (Million), by Products and Services 2025 & 2033
- Figure 20: Europe Mobility in Healthcare Industry Volume (K Unit), by Products and Services 2025 & 2033
- Figure 21: Europe Mobility in Healthcare Industry Revenue Share (%), by Products and Services 2025 & 2033
- Figure 22: Europe Mobility in Healthcare Industry Volume Share (%), by Products and Services 2025 & 2033
- Figure 23: Europe Mobility in Healthcare Industry Revenue (Million), by Application 2025 & 2033
- Figure 24: Europe Mobility in Healthcare Industry Volume (K Unit), by Application 2025 & 2033
- Figure 25: Europe Mobility in Healthcare Industry Revenue Share (%), by Application 2025 & 2033
- Figure 26: Europe Mobility in Healthcare Industry Volume Share (%), by Application 2025 & 2033
- Figure 27: Europe Mobility in Healthcare Industry Revenue (Million), by End User 2025 & 2033
- Figure 28: Europe Mobility in Healthcare Industry Volume (K Unit), by End User 2025 & 2033
- Figure 29: Europe Mobility in Healthcare Industry Revenue Share (%), by End User 2025 & 2033
- Figure 30: Europe Mobility in Healthcare Industry Volume Share (%), by End User 2025 & 2033
- Figure 31: Europe Mobility in Healthcare Industry Revenue (Million), by Country 2025 & 2033
- Figure 32: Europe Mobility in Healthcare Industry Volume (K Unit), by Country 2025 & 2033
- Figure 33: Europe Mobility in Healthcare Industry Revenue Share (%), by Country 2025 & 2033
- Figure 34: Europe Mobility in Healthcare Industry Volume Share (%), by Country 2025 & 2033
- Figure 35: Asia Pacific Mobility in Healthcare Industry Revenue (Million), by Products and Services 2025 & 2033
- Figure 36: Asia Pacific Mobility in Healthcare Industry Volume (K Unit), by Products and Services 2025 & 2033
- Figure 37: Asia Pacific Mobility in Healthcare Industry Revenue Share (%), by Products and Services 2025 & 2033
- Figure 38: Asia Pacific Mobility in Healthcare Industry Volume Share (%), by Products and Services 2025 & 2033
- Figure 39: Asia Pacific Mobility in Healthcare Industry Revenue (Million), by Application 2025 & 2033
- Figure 40: Asia Pacific Mobility in Healthcare Industry Volume (K Unit), by Application 2025 & 2033
- Figure 41: Asia Pacific Mobility in Healthcare Industry Revenue Share (%), by Application 2025 & 2033
- Figure 42: Asia Pacific Mobility in Healthcare Industry Volume Share (%), by Application 2025 & 2033
- Figure 43: Asia Pacific Mobility in Healthcare Industry Revenue (Million), by End User 2025 & 2033
- Figure 44: Asia Pacific Mobility in Healthcare Industry Volume (K Unit), by End User 2025 & 2033
- Figure 45: Asia Pacific Mobility in Healthcare Industry Revenue Share (%), by End User 2025 & 2033
- Figure 46: Asia Pacific Mobility in Healthcare Industry Volume Share (%), by End User 2025 & 2033
- Figure 47: Asia Pacific Mobility in Healthcare Industry Revenue (Million), by Country 2025 & 2033
- Figure 48: Asia Pacific Mobility in Healthcare Industry Volume (K Unit), by Country 2025 & 2033
- Figure 49: Asia Pacific Mobility in Healthcare Industry Revenue Share (%), by Country 2025 & 2033
- Figure 50: Asia Pacific Mobility in Healthcare Industry Volume Share (%), by Country 2025 & 2033
- Figure 51: Middle East Mobility in Healthcare Industry Revenue (Million), by Products and Services 2025 & 2033
- Figure 52: Middle East Mobility in Healthcare Industry Volume (K Unit), by Products and Services 2025 & 2033
- Figure 53: Middle East Mobility in Healthcare Industry Revenue Share (%), by Products and Services 2025 & 2033
- Figure 54: Middle East Mobility in Healthcare Industry Volume Share (%), by Products and Services 2025 & 2033
- Figure 55: Middle East Mobility in Healthcare Industry Revenue (Million), by Application 2025 & 2033
- Figure 56: Middle East Mobility in Healthcare Industry Volume (K Unit), by Application 2025 & 2033
- Figure 57: Middle East Mobility in Healthcare Industry Revenue Share (%), by Application 2025 & 2033
- Figure 58: Middle East Mobility in Healthcare Industry Volume Share (%), by Application 2025 & 2033
- Figure 59: Middle East Mobility in Healthcare Industry Revenue (Million), by End User 2025 & 2033
- Figure 60: Middle East Mobility in Healthcare Industry Volume (K Unit), by End User 2025 & 2033
- Figure 61: Middle East Mobility in Healthcare Industry Revenue Share (%), by End User 2025 & 2033
- Figure 62: Middle East Mobility in Healthcare Industry Volume Share (%), by End User 2025 & 2033
- Figure 63: Middle East Mobility in Healthcare Industry Revenue (Million), by Country 2025 & 2033
- Figure 64: Middle East Mobility in Healthcare Industry Volume (K Unit), by Country 2025 & 2033
- Figure 65: Middle East Mobility in Healthcare Industry Revenue Share (%), by Country 2025 & 2033
- Figure 66: Middle East Mobility in Healthcare Industry Volume Share (%), by Country 2025 & 2033
- Figure 67: GCC Mobility in Healthcare Industry Revenue (Million), by Products and Services 2025 & 2033
- Figure 68: GCC Mobility in Healthcare Industry Volume (K Unit), by Products and Services 2025 & 2033
- Figure 69: GCC Mobility in Healthcare Industry Revenue Share (%), by Products and Services 2025 & 2033
- Figure 70: GCC Mobility in Healthcare Industry Volume Share (%), by Products and Services 2025 & 2033
- Figure 71: GCC Mobility in Healthcare Industry Revenue (Million), by Application 2025 & 2033
- Figure 72: GCC Mobility in Healthcare Industry Volume (K Unit), by Application 2025 & 2033
- Figure 73: GCC Mobility in Healthcare Industry Revenue Share (%), by Application 2025 & 2033
- Figure 74: GCC Mobility in Healthcare Industry Volume Share (%), by Application 2025 & 2033
- Figure 75: GCC Mobility in Healthcare Industry Revenue (Million), by End User 2025 & 2033
- Figure 76: GCC Mobility in Healthcare Industry Volume (K Unit), by End User 2025 & 2033
- Figure 77: GCC Mobility in Healthcare Industry Revenue Share (%), by End User 2025 & 2033
- Figure 78: GCC Mobility in Healthcare Industry Volume Share (%), by End User 2025 & 2033
- Figure 79: GCC Mobility in Healthcare Industry Revenue (Million), by Country 2025 & 2033
- Figure 80: GCC Mobility in Healthcare Industry Volume (K Unit), by Country 2025 & 2033
- Figure 81: GCC Mobility in Healthcare Industry Revenue Share (%), by Country 2025 & 2033
- Figure 82: GCC Mobility in Healthcare Industry Volume Share (%), by Country 2025 & 2033
- Figure 83: South America Mobility in Healthcare Industry Revenue (Million), by Products and Services 2025 & 2033
- Figure 84: South America Mobility in Healthcare Industry Volume (K Unit), by Products and Services 2025 & 2033
- Figure 85: South America Mobility in Healthcare Industry Revenue Share (%), by Products and Services 2025 & 2033
- Figure 86: South America Mobility in Healthcare Industry Volume Share (%), by Products and Services 2025 & 2033
- Figure 87: South America Mobility in Healthcare Industry Revenue (Million), by Application 2025 & 2033
- Figure 88: South America Mobility in Healthcare Industry Volume (K Unit), by Application 2025 & 2033
- Figure 89: South America Mobility in Healthcare Industry Revenue Share (%), by Application 2025 & 2033
- Figure 90: South America Mobility in Healthcare Industry Volume Share (%), by Application 2025 & 2033
- Figure 91: South America Mobility in Healthcare Industry Revenue (Million), by End User 2025 & 2033
- Figure 92: South America Mobility in Healthcare Industry Volume (K Unit), by End User 2025 & 2033
- Figure 93: South America Mobility in Healthcare Industry Revenue Share (%), by End User 2025 & 2033
- Figure 94: South America Mobility in Healthcare Industry Volume Share (%), by End User 2025 & 2033
- Figure 95: South America Mobility in Healthcare Industry Revenue (Million), by Country 2025 & 2033
- Figure 96: South America Mobility in Healthcare Industry Volume (K Unit), by Country 2025 & 2033
- Figure 97: South America Mobility in Healthcare Industry Revenue Share (%), by Country 2025 & 2033
- Figure 98: South America Mobility in Healthcare Industry Volume Share (%), by Country 2025 & 2033
List of Tables
- Table 1: Global Mobility in Healthcare Industry Revenue Million Forecast, by Products and Services 2020 & 2033
- Table 2: Global Mobility in Healthcare Industry Volume K Unit Forecast, by Products and Services 2020 & 2033
- Table 3: Global Mobility in Healthcare Industry Revenue Million Forecast, by Application 2020 & 2033
- Table 4: Global Mobility in Healthcare Industry Volume K Unit Forecast, by Application 2020 & 2033
- Table 5: Global Mobility in Healthcare Industry Revenue Million Forecast, by End User 2020 & 2033
- Table 6: Global Mobility in Healthcare Industry Volume K Unit Forecast, by End User 2020 & 2033
- Table 7: Global Mobility in Healthcare Industry Revenue Million Forecast, by Region 2020 & 2033
- Table 8: Global Mobility in Healthcare Industry Volume K Unit Forecast, by Region 2020 & 2033
- Table 9: Global Mobility in Healthcare Industry Revenue Million Forecast, by Products and Services 2020 & 2033
- Table 10: Global Mobility in Healthcare Industry Volume K Unit Forecast, by Products and Services 2020 & 2033
- Table 11: Global Mobility in Healthcare Industry Revenue Million Forecast, by Application 2020 & 2033
- Table 12: Global Mobility in Healthcare Industry Volume K Unit Forecast, by Application 2020 & 2033
- Table 13: Global Mobility in Healthcare Industry Revenue Million Forecast, by End User 2020 & 2033
- Table 14: Global Mobility in Healthcare Industry Volume K Unit Forecast, by End User 2020 & 2033
- Table 15: Global Mobility in Healthcare Industry Revenue Million Forecast, by Country 2020 & 2033
- Table 16: Global Mobility in Healthcare Industry Volume K Unit Forecast, by Country 2020 & 2033
- Table 17: United States Mobility in Healthcare Industry Revenue (Million) Forecast, by Application 2020 & 2033
- Table 18: United States Mobility in Healthcare Industry Volume (K Unit) Forecast, by Application 2020 & 2033
- Table 19: Canada Mobility in Healthcare Industry Revenue (Million) Forecast, by Application 2020 & 2033
- Table 20: Canada Mobility in Healthcare Industry Volume (K Unit) Forecast, by Application 2020 & 2033
- Table 21: Mexico Mobility in Healthcare Industry Revenue (Million) Forecast, by Application 2020 & 2033
- Table 22: Mexico Mobility in Healthcare Industry Volume (K Unit) Forecast, by Application 2020 & 2033
- Table 23: Global Mobility in Healthcare Industry Revenue Million Forecast, by Products and Services 2020 & 2033
- Table 24: Global Mobility in Healthcare Industry Volume K Unit Forecast, by Products and Services 2020 & 2033
- Table 25: Global Mobility in Healthcare Industry Revenue Million Forecast, by Application 2020 & 2033
- Table 26: Global Mobility in Healthcare Industry Volume K Unit Forecast, by Application 2020 & 2033
- Table 27: Global Mobility in Healthcare Industry Revenue Million Forecast, by End User 2020 & 2033
- Table 28: Global Mobility in Healthcare Industry Volume K Unit Forecast, by End User 2020 & 2033
- Table 29: Global Mobility in Healthcare Industry Revenue Million Forecast, by Country 2020 & 2033
- Table 30: Global Mobility in Healthcare Industry Volume K Unit Forecast, by Country 2020 & 2033
- Table 31: Germany Mobility in Healthcare Industry Revenue (Million) Forecast, by Application 2020 & 2033
- Table 32: Germany Mobility in Healthcare Industry Volume (K Unit) Forecast, by Application 2020 & 2033
- Table 33: United Kingdom Mobility in Healthcare Industry Revenue (Million) Forecast, by Application 2020 & 2033
- Table 34: United Kingdom Mobility in Healthcare Industry Volume (K Unit) Forecast, by Application 2020 & 2033
- Table 35: France Mobility in Healthcare Industry Revenue (Million) Forecast, by Application 2020 & 2033
- Table 36: France Mobility in Healthcare Industry Volume (K Unit) Forecast, by Application 2020 & 2033
- Table 37: Italy Mobility in Healthcare Industry Revenue (Million) Forecast, by Application 2020 & 2033
- Table 38: Italy Mobility in Healthcare Industry Volume (K Unit) Forecast, by Application 2020 & 2033
- Table 39: Spain Mobility in Healthcare Industry Revenue (Million) Forecast, by Application 2020 & 2033
- Table 40: Spain Mobility in Healthcare Industry Volume (K Unit) Forecast, by Application 2020 & 2033
- Table 41: Rest of Europe Mobility in Healthcare Industry Revenue (Million) Forecast, by Application 2020 & 2033
- Table 42: Rest of Europe Mobility in Healthcare Industry Volume (K Unit) Forecast, by Application 2020 & 2033
- Table 43: Global Mobility in Healthcare Industry Revenue Million Forecast, by Products and Services 2020 & 2033
- Table 44: Global Mobility in Healthcare Industry Volume K Unit Forecast, by Products and Services 2020 & 2033
- Table 45: Global Mobility in Healthcare Industry Revenue Million Forecast, by Application 2020 & 2033
- Table 46: Global Mobility in Healthcare Industry Volume K Unit Forecast, by Application 2020 & 2033
- Table 47: Global Mobility in Healthcare Industry Revenue Million Forecast, by End User 2020 & 2033
- Table 48: Global Mobility in Healthcare Industry Volume K Unit Forecast, by End User 2020 & 2033
- Table 49: Global Mobility in Healthcare Industry Revenue Million Forecast, by Country 2020 & 2033
- Table 50: Global Mobility in Healthcare Industry Volume K Unit Forecast, by Country 2020 & 2033
- Table 51: China Mobility in Healthcare Industry Revenue (Million) Forecast, by Application 2020 & 2033
- Table 52: China Mobility in Healthcare Industry Volume (K Unit) Forecast, by Application 2020 & 2033
- Table 53: Japan Mobility in Healthcare Industry Revenue (Million) Forecast, by Application 2020 & 2033
- Table 54: Japan Mobility in Healthcare Industry Volume (K Unit) Forecast, by Application 2020 & 2033
- Table 55: India Mobility in Healthcare Industry Revenue (Million) Forecast, by Application 2020 & 2033
- Table 56: India Mobility in Healthcare Industry Volume (K Unit) Forecast, by Application 2020 & 2033
- Table 57: Australia Mobility in Healthcare Industry Revenue (Million) Forecast, by Application 2020 & 2033
- Table 58: Australia Mobility in Healthcare Industry Volume (K Unit) Forecast, by Application 2020 & 2033
- Table 59: South Korea Mobility in Healthcare Industry Revenue (Million) Forecast, by Application 2020 & 2033
- Table 60: South Korea Mobility in Healthcare Industry Volume (K Unit) Forecast, by Application 2020 & 2033
- Table 61: Rest of Asia Pacific Mobility in Healthcare Industry Revenue (Million) Forecast, by Application 2020 & 2033
- Table 62: Rest of Asia Pacific Mobility in Healthcare Industry Volume (K Unit) Forecast, by Application 2020 & 2033
- Table 63: Global Mobility in Healthcare Industry Revenue Million Forecast, by Products and Services 2020 & 2033
- Table 64: Global Mobility in Healthcare Industry Volume K Unit Forecast, by Products and Services 2020 & 2033
- Table 65: Global Mobility in Healthcare Industry Revenue Million Forecast, by Application 2020 & 2033
- Table 66: Global Mobility in Healthcare Industry Volume K Unit Forecast, by Application 2020 & 2033
- Table 67: Global Mobility in Healthcare Industry Revenue Million Forecast, by End User 2020 & 2033
- Table 68: Global Mobility in Healthcare Industry Volume K Unit Forecast, by End User 2020 & 2033
- Table 69: Global Mobility in Healthcare Industry Revenue Million Forecast, by Country 2020 & 2033
- Table 70: Global Mobility in Healthcare Industry Volume K Unit Forecast, by Country 2020 & 2033
- Table 71: Global Mobility in Healthcare Industry Revenue Million Forecast, by Products and Services 2020 & 2033
- Table 72: Global Mobility in Healthcare Industry Volume K Unit Forecast, by Products and Services 2020 & 2033
- Table 73: Global Mobility in Healthcare Industry Revenue Million Forecast, by Application 2020 & 2033
- Table 74: Global Mobility in Healthcare Industry Volume K Unit Forecast, by Application 2020 & 2033
- Table 75: Global Mobility in Healthcare Industry Revenue Million Forecast, by End User 2020 & 2033
- Table 76: Global Mobility in Healthcare Industry Volume K Unit Forecast, by End User 2020 & 2033
- Table 77: Global Mobility in Healthcare Industry Revenue Million Forecast, by Country 2020 & 2033
- Table 78: Global Mobility in Healthcare Industry Volume K Unit Forecast, by Country 2020 & 2033
- Table 79: South Africa Mobility in Healthcare Industry Revenue (Million) Forecast, by Application 2020 & 2033
- Table 80: South Africa Mobility in Healthcare Industry Volume (K Unit) Forecast, by Application 2020 & 2033
- Table 81: Rest of Middle East Mobility in Healthcare Industry Revenue (Million) Forecast, by Application 2020 & 2033
- Table 82: Rest of Middle East Mobility in Healthcare Industry Volume (K Unit) Forecast, by Application 2020 & 2033
- Table 83: Global Mobility in Healthcare Industry Revenue Million Forecast, by Products and Services 2020 & 2033
- Table 84: Global Mobility in Healthcare Industry Volume K Unit Forecast, by Products and Services 2020 & 2033
- Table 85: Global Mobility in Healthcare Industry Revenue Million Forecast, by Application 2020 & 2033
- Table 86: Global Mobility in Healthcare Industry Volume K Unit Forecast, by Application 2020 & 2033
- Table 87: Global Mobility in Healthcare Industry Revenue Million Forecast, by End User 2020 & 2033
- Table 88: Global Mobility in Healthcare Industry Volume K Unit Forecast, by End User 2020 & 2033
- Table 89: Global Mobility in Healthcare Industry Revenue Million Forecast, by Country 2020 & 2033
- Table 90: Global Mobility in Healthcare Industry Volume K Unit Forecast, by Country 2020 & 2033
- Table 91: Brazil Mobility in Healthcare Industry Revenue (Million) Forecast, by Application 2020 & 2033
- Table 92: Brazil Mobility in Healthcare Industry Volume (K Unit) Forecast, by Application 2020 & 2033
- Table 93: Argentina Mobility in Healthcare Industry Revenue (Million) Forecast, by Application 2020 & 2033
- Table 94: Argentina Mobility in Healthcare Industry Volume (K Unit) Forecast, by Application 2020 & 2033
- Table 95: Rest of South America Mobility in Healthcare Industry Revenue (Million) Forecast, by Application 2020 & 2033
- Table 96: Rest of South America Mobility in Healthcare Industry Volume (K Unit) Forecast, by Application 2020 & 2033
Frequently Asked Questions
1. What is the projected Compound Annual Growth Rate (CAGR) of the Mobility in Healthcare Industry?
The projected CAGR is approximately 21.32%.
2. Which companies are prominent players in the Mobility in Healthcare Industry?
Key companies in the market include Mckesson Corporation, Zebra Technologies Corporation, Koninklijke Philips N V, Cisco Systems Inc, Airstrip Technologies Inc, Omron Corporation, At&T Inc, SAP SE, Oracle Cerner.
3. What are the main segments of the Mobility in Healthcare Industry?
The market segments include Products and Services, Application, End User.
4. Can you provide details about the market size?
The market size is estimated to be USD 135.43 Million as of 2022.
5. What are some drivers contributing to market growth?
Increasing Utilization of the Smart Devices (Smartphones. Smart watches. etc.); Increased Influence of the Social Media on Healthcare; Rise in the Demand of Personalized Medicines.
6. What are the notable trends driving market growth?
Patient Care Management Segment is Expected to Witness a Healthy Growth Over the Forecast Period.
7. Are there any restraints impacting market growth?
Safety and Security Issues Associated with Patient Health Information; Lack of Skilled Professionals.
8. Can you provide examples of recent developments in the market?
In August 2022, Indonesia's Health Ministry launched the Indonesia Health Services platform in Jakarta as a part of the country's health technology transformation.
9. What pricing options are available for accessing the report?
Pricing options include single-user, multi-user, and enterprise licenses priced at USD 4750, USD 5250, and USD 8750 respectively.
10. Is the market size provided in terms of value or volume?
The market size is provided in terms of value, measured in Million and volume, measured in K Unit.
11. Are there any specific market keywords associated with the report?
Yes, the market keyword associated with the report is "Mobility in Healthcare Industry," which aids in identifying and referencing the specific market segment covered.
12. How do I determine which pricing option suits my needs best?
The pricing options vary based on user requirements and access needs. Individual users may opt for single-user licenses, while businesses requiring broader access may choose multi-user or enterprise licenses for cost-effective access to the report.
13. Are there any additional resources or data provided in the Mobility in Healthcare Industry report?
While the report offers comprehensive insights, it's advisable to review the specific contents or supplementary materials provided to ascertain if additional resources or data are available.
14. How can I stay updated on further developments or reports in the Mobility in Healthcare Industry?
To stay informed about further developments, trends, and reports in the Mobility in Healthcare Industry, consider subscribing to industry newsletters, following relevant companies and organizations, or regularly checking reputable industry news sources and publications.
Methodology
Step 1 - Identification of Relevant Samples Size from Population Database


Step 2 - Approaches for Defining Global Market Size (Value, Volume* & Price*)

Note*: In applicable scenarios
Step 3 - Data Sources
Primary Research
- Web Analytics
- Survey Reports
- Research Institute
- Latest Research Reports
- Opinion Leaders
Secondary Research
- Annual Reports
- White Paper
- Latest Press Release
- Industry Association
- Paid Database
- Investor Presentations

Step 4 - Data Triangulation
Involves using different sources of information in order to increase the validity of a study
These sources are likely to be stakeholders in a program - participants, other researchers, program staff, other community members, and so on.
Then we put all data in single framework & apply various statistical tools to find out the dynamic on the market.
During the analysis stage, feedback from the stakeholder groups would be compared to determine areas of agreement as well as areas of divergence