

Key Insights
The Molecular Breast Imaging (MBI) market is poised for significant expansion, projected to reach an estimated USD 5.88 billion by 2025, exhibiting a robust Compound Annual Growth Rate (CAGR) of 9.7% during the forecast period of 2025-2033. This upward trajectory is propelled by several key drivers. A primary catalyst is the increasing global incidence of breast cancer, necessitating advanced diagnostic tools for earlier and more accurate detection. Furthermore, the growing adoption of MBI in diagnostic centers and hospitals, driven by its superior sensitivity and specificity compared to mammography in certain patient populations, is a substantial growth factor. Technological advancements in MBI equipment, leading to improved image quality, reduced scan times, and enhanced patient comfort, are also contributing to market penetration. The rising awareness among women regarding breast health and the benefits of early detection further fuels demand. Moreover, favorable reimbursement policies and increasing investments in healthcare infrastructure, particularly in emerging economies, are expected to create a conducive environment for market growth.
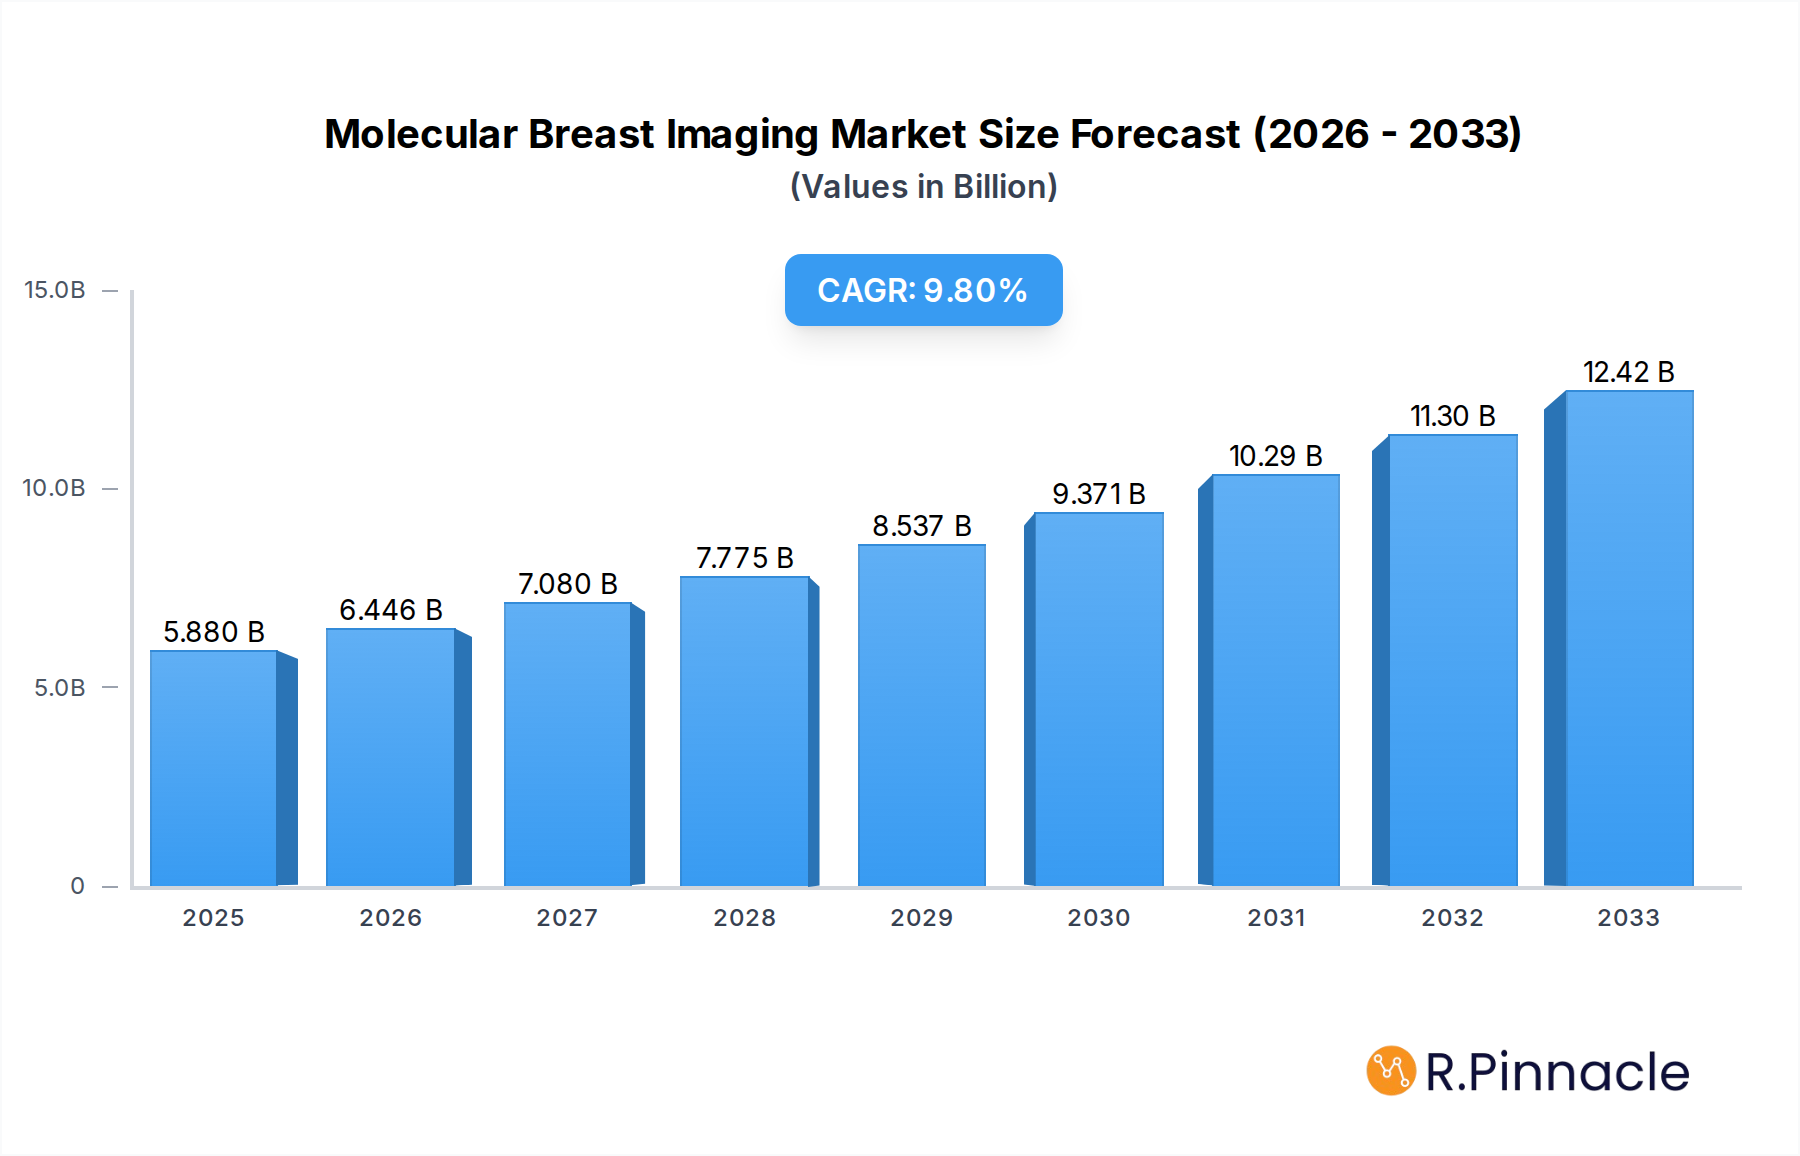
Molecular Breast Imaging Market Size (In Billion)
The market is segmented by type and application. The Dual Head Molecular Breast Imaging segment is anticipated to lead the market, owing to its enhanced imaging capabilities and efficiency. Application-wise, hospitals represent the largest segment due to higher patient volumes and the availability of advanced healthcare facilities. While the market presents strong growth opportunities, certain restraints need to be considered. High initial investment costs for MBI equipment and the need for specialized trained personnel can pose challenges to widespread adoption, particularly in resource-limited settings. However, the growing emphasis on preventative healthcare and the continuous innovation in MBI technology are expected to overcome these limitations. Key players such as GE, Dilon Technologies, and CMR Naviscan are actively engaged in research and development, further stimulating innovation and market expansion, with significant contributions also expected from entities like Mayo Clinic.

Molecular Breast Imaging Company Market Share
Molecular Breast Imaging Market: Comprehensive Industry Analysis and Future Projections (2019-2033)
This in-depth report provides a granular analysis of the global Molecular Breast Imaging (MIB) market, offering strategic insights for stakeholders, healthcare providers, and investors. Spanning a study period from 2019 to 2033, with a base year of 2025, this comprehensive report forecasts market trajectory and identifies key growth accelerators. With an estimated market value of $2.2 billion in 2025 and projected to reach $4.5 billion by 2033, this report delves into the intricate dynamics shaping the MIB landscape.
Molecular Breast Imaging Market Structure & Innovation Trends
The Molecular Breast Imaging market exhibits a moderate concentration, with key players vying for market share through continuous innovation and strategic partnerships. The innovation landscape is driven by advancements in detector technology, image processing algorithms, and the development of novel radiopharmaceuticals, all aimed at improving diagnostic accuracy and patient comfort. Regulatory frameworks, while crucial for ensuring patient safety and device efficacy, also present a dynamic element influencing market entry and product development. Potential product substitutes, such as advanced mammography and ultrasound, necessitate a constant focus on MIB's unique value proposition – its superior sensitivity in detecting small or multifocal cancers. End-user demographics are increasingly characterized by an aging population and a growing awareness of breast cancer risks, driving demand for sophisticated diagnostic tools. Mergers and acquisitions (M&A) activity within the sector, valued at approximately $800 million in the historical period, signals consolidation and strategic expansion efforts by leading companies. The market share of key players is continuously evolving, with dominant entities holding an estimated combined share of 65% in 2025.
Molecular Breast Imaging Market Dynamics & Trends
The Molecular Breast Imaging market is poised for significant expansion, driven by a confluence of factors including increasing breast cancer incidence, a growing demand for early and accurate detection methods, and substantial technological advancements. The global Compound Annual Growth Rate (CAGR) for MIB is estimated at 8.5% during the forecast period (2025-2033). Technological disruptions, such as the development of more compact and portable MIB systems and enhanced image resolution capabilities, are revolutionizing diagnostic workflows. Consumer preferences are shifting towards less invasive and more precise diagnostic procedures, with MIB offering a distinct advantage in visualizing metabolically active lesions often missed by conventional imaging. Competitive dynamics are intensifying, characterized by strategic collaborations between technology providers and healthcare institutions, as well as a focus on developing cost-effective MIB solutions to improve market penetration, which is projected to rise from 15% in 2025 to 30% by 2033 in developed markets. The increasing adoption of MIB in diverse clinical settings, including high-risk screening programs and for dense breast tissue, further fuels market growth. The rising global healthcare expenditure and government initiatives aimed at early cancer detection are also pivotal in shaping the market's trajectory.
Dominant Regions & Segments in Molecular Breast Imaging
North America currently dominates the Molecular Breast Imaging market, driven by advanced healthcare infrastructure, high adoption rates of cutting-edge medical technologies, and robust funding for cancer research and diagnostics. Within North America, the United States stands out as the leading country, owing to its well-established reimbursement policies for advanced imaging techniques and a significant presence of major healthcare providers.
Dominant Application Segment: Hospital Hospitals are the primary consumers of MIB technology. This dominance is attributed to several key drivers:
- Comprehensive Cancer Care Facilities: Hospitals typically house specialized oncology departments equipped to handle complex diagnostic and treatment pathways, making MIB a natural fit for their armamentarium.
- Patient Volume and Referral Networks: A higher volume of patients, coupled with established referral networks from primary care physicians and other specialists, ensures consistent utilization of MIB services.
- Technological Integration: Hospitals possess the necessary infrastructure and technical expertise to integrate MIB systems into existing PACS (Picture Archiving and Communication Systems) and EMR (Electronic Medical Records) systems.
- Research and Development Hubs: Many hospitals are active in clinical research, leading to early adoption and evaluation of new MIB technologies.
Dominant Type Segment: Dual Head Molecular Breast Imaging Dual Head Molecular Breast Imaging systems are experiencing higher adoption due to their enhanced imaging capabilities:
- Improved Sensitivity and Specificity: The dual-head design allows for simultaneous data acquisition from multiple angles, significantly improving the sensitivity and specificity in detecting subtle lesions. This is particularly crucial for identifying early-stage cancers.
- Reduced Scan Times: By acquiring data more efficiently, dual-head systems can offer shorter scan durations, improving patient comfort and throughput.
- Advanced Imaging Features: These systems often incorporate advanced collimator designs and detector technologies that further refine image quality and diagnostic confidence.
- Clinical Preference: In clinical practice, the superior diagnostic performance offered by dual-head systems often makes them the preferred choice for complex cases and high-risk screening.
The robust demand from hospitals and the preference for dual-head MIB systems are expected to continue to shape the market's regional and segment dominance in the coming years.
Molecular Breast Imaging Product Innovations
Molecular Breast Imaging product innovations are focused on enhancing diagnostic accuracy and workflow efficiency. Recent developments include the introduction of higher sensitivity detectors, advanced AI-powered image analysis software, and more compact, patient-friendly imaging systems. These innovations aim to improve the detection of small, metabolically active lesions and reduce false positives, providing a competitive advantage by offering superior diagnostic certainty and a more comfortable patient experience.
Report Scope & Segmentation Analysis
This report comprehensively segments the Molecular Breast Imaging market by Application and Type.
Application Segments: The market is analyzed across Hospital, Diagnostic Center, and Others. Hospitals are expected to maintain the largest market share due to their extensive diagnostic capabilities and patient throughput. Diagnostic centers are projected to show significant growth as specialized imaging facilities expand.
Type Segments: The analysis includes Single Head Molecular Breast Imaging and Dual Head Molecular Breast Imaging. Dual head systems are anticipated to lead the market, driven by their superior performance and growing clinical acceptance, while single head systems will cater to specific niche applications and budget-conscious markets.
Key Drivers of Molecular Breast Imaging Growth
The Molecular Breast Imaging market's growth is propelled by several key factors. Technologically, advancements in detector sensitivity, resolution, and the integration of artificial intelligence for image analysis are enhancing diagnostic accuracy. Economically, increasing healthcare expenditure globally and the growing burden of breast cancer incidence necessitate more effective screening and diagnostic tools. Regulatory support for early cancer detection initiatives further bolsters adoption. The rising demand for personalized medicine and risk-stratified screening programs also favors MIB's unique capabilities in identifying metabolically active lesions.
Challenges in the Molecular Breast Imaging Sector
Despite its growth potential, the Molecular Breast Imaging sector faces several challenges. Regulatory hurdles, including stringent approval processes for new radiopharmaceuticals and devices, can slow down market entry. Supply chain complexities for radiotracers, often requiring specialized handling and short shelf lives, can impact accessibility and cost. Competitive pressures from established imaging modalities and the high initial investment cost for advanced MIB systems can also restrain widespread adoption, particularly in resource-limited settings.
Emerging Opportunities in Molecular Breast Imaging
Emerging opportunities in the Molecular Breast Imaging sector lie in the expansion into new geographic markets, particularly in emerging economies where awareness of breast cancer and demand for advanced diagnostics are increasing. Technological advancements, such as the development of novel targeted radiotracers for specific molecular pathways, present a significant opportunity to improve lesion characterization. Furthermore, the increasing application of MIB in high-risk patient populations and for evaluating treatment response offers avenues for market penetration and revenue growth.
Leading Players in the Molecular Breast Imaging Market
- Dilon Technologies
- CMR Naviscan
- Digirad
- GE
- Mayo Clinic
Key Developments in Molecular Breast Imaging Industry
- 2023: Launch of next-generation MIB detectors with enhanced resolution by Dilon Technologies.
- 2023: CMR Naviscan receives expanded FDA clearance for its MIB system for high-risk screening.
- 2022: Digirad partners with a major healthcare network to deploy MIB technology across multiple facilities.
- 2022: GE Healthcare announces advancements in AI-driven image analysis for MIB, improving diagnostic efficiency.
- 2021: Mayo Clinic publishes research highlighting the superior efficacy of MIB in dense breast tissue compared to mammography.
Future Outlook for Molecular Breast Imaging Market
The future outlook for the Molecular Breast Imaging market is exceptionally promising, driven by ongoing technological innovation and a growing global emphasis on early and precise cancer detection. The market is expected to witness sustained growth, fueled by the increasing prevalence of breast cancer and the continuous need for diagnostic tools that offer superior sensitivity and specificity, especially in challenging cases like dense breast tissue. Strategic investments in research and development by leading players, coupled with expanding access to these advanced technologies in underserved regions, will further accelerate market penetration and adoption. The integration of artificial intelligence and novel radiopharmaceuticals will continue to refine diagnostic capabilities, solidifying MIB's position as a critical component of comprehensive breast health management.
Molecular Breast Imaging Segmentation
-
1. Application
- 1.1. Hospital
- 1.2. Diagnostic Center
- 1.3. Others
-
2. Types
- 2.1. Single Head Molecular Breast Imaging
- 2.2. Dual Head Molecular Breast Imaging
Molecular Breast Imaging Segmentation By Geography
-
1. North America
- 1.1. United States
- 1.2. Canada
- 1.3. Mexico
-
2. South America
- 2.1. Brazil
- 2.2. Argentina
- 2.3. Rest of South America
-
3. Europe
- 3.1. United Kingdom
- 3.2. Germany
- 3.3. France
- 3.4. Italy
- 3.5. Spain
- 3.6. Russia
- 3.7. Benelux
- 3.8. Nordics
- 3.9. Rest of Europe
-
4. Middle East & Africa
- 4.1. Turkey
- 4.2. Israel
- 4.3. GCC
- 4.4. North Africa
- 4.5. South Africa
- 4.6. Rest of Middle East & Africa
-
5. Asia Pacific
- 5.1. China
- 5.2. India
- 5.3. Japan
- 5.4. South Korea
- 5.5. ASEAN
- 5.6. Oceania
- 5.7. Rest of Asia Pacific

Molecular Breast Imaging Regional Market Share
Geographic Coverage of Molecular Breast Imaging
Molecular Breast Imaging REPORT HIGHLIGHTS
| Aspects | Details |
|---|---|
| Study Period | 2020-2034 |
| Base Year | 2025 |
| Estimated Year | 2026 |
| Forecast Period | 2026-2034 |
| Historical Period | 2020-2025 |
| Growth Rate | CAGR of 9.7% from 2020-2034 |
| Segmentation |
|
Table of Contents
- 1. Introduction
- 1.1. Research Scope
- 1.2. Market Segmentation
- 1.3. Research Methodology
- 1.4. Definitions and Assumptions
- 2. Executive Summary
- 2.1. Introduction
- 3. Market Dynamics
- 3.1. Introduction
- 3.2. Market Drivers
- 3.3. Market Restrains
- 3.4. Market Trends
- 4. Market Factor Analysis
- 4.1. Porters Five Forces
- 4.2. Supply/Value Chain
- 4.3. PESTEL analysis
- 4.4. Market Entropy
- 4.5. Patent/Trademark Analysis
- 5. Global Molecular Breast Imaging Analysis, Insights and Forecast, 2020-2032
- 5.1. Market Analysis, Insights and Forecast - by Application
- 5.1.1. Hospital
- 5.1.2. Diagnostic Center
- 5.1.3. Others
- 5.2. Market Analysis, Insights and Forecast - by Types
- 5.2.1. Single Head Molecular Breast Imaging
- 5.2.2. Dual Head Molecular Breast Imaging
- 5.3. Market Analysis, Insights and Forecast - by Region
- 5.3.1. North America
- 5.3.2. South America
- 5.3.3. Europe
- 5.3.4. Middle East & Africa
- 5.3.5. Asia Pacific
- 5.1. Market Analysis, Insights and Forecast - by Application
- 6. North America Molecular Breast Imaging Analysis, Insights and Forecast, 2020-2032
- 6.1. Market Analysis, Insights and Forecast - by Application
- 6.1.1. Hospital
- 6.1.2. Diagnostic Center
- 6.1.3. Others
- 6.2. Market Analysis, Insights and Forecast - by Types
- 6.2.1. Single Head Molecular Breast Imaging
- 6.2.2. Dual Head Molecular Breast Imaging
- 6.1. Market Analysis, Insights and Forecast - by Application
- 7. South America Molecular Breast Imaging Analysis, Insights and Forecast, 2020-2032
- 7.1. Market Analysis, Insights and Forecast - by Application
- 7.1.1. Hospital
- 7.1.2. Diagnostic Center
- 7.1.3. Others
- 7.2. Market Analysis, Insights and Forecast - by Types
- 7.2.1. Single Head Molecular Breast Imaging
- 7.2.2. Dual Head Molecular Breast Imaging
- 7.1. Market Analysis, Insights and Forecast - by Application
- 8. Europe Molecular Breast Imaging Analysis, Insights and Forecast, 2020-2032
- 8.1. Market Analysis, Insights and Forecast - by Application
- 8.1.1. Hospital
- 8.1.2. Diagnostic Center
- 8.1.3. Others
- 8.2. Market Analysis, Insights and Forecast - by Types
- 8.2.1. Single Head Molecular Breast Imaging
- 8.2.2. Dual Head Molecular Breast Imaging
- 8.1. Market Analysis, Insights and Forecast - by Application
- 9. Middle East & Africa Molecular Breast Imaging Analysis, Insights and Forecast, 2020-2032
- 9.1. Market Analysis, Insights and Forecast - by Application
- 9.1.1. Hospital
- 9.1.2. Diagnostic Center
- 9.1.3. Others
- 9.2. Market Analysis, Insights and Forecast - by Types
- 9.2.1. Single Head Molecular Breast Imaging
- 9.2.2. Dual Head Molecular Breast Imaging
- 9.1. Market Analysis, Insights and Forecast - by Application
- 10. Asia Pacific Molecular Breast Imaging Analysis, Insights and Forecast, 2020-2032
- 10.1. Market Analysis, Insights and Forecast - by Application
- 10.1.1. Hospital
- 10.1.2. Diagnostic Center
- 10.1.3. Others
- 10.2. Market Analysis, Insights and Forecast - by Types
- 10.2.1. Single Head Molecular Breast Imaging
- 10.2.2. Dual Head Molecular Breast Imaging
- 10.1. Market Analysis, Insights and Forecast - by Application
- 11. Competitive Analysis
- 11.1. Global Market Share Analysis 2025
- 11.2. Company Profiles
- 11.2.1 Dilon Technologies
- 11.2.1.1. Overview
- 11.2.1.2. Products
- 11.2.1.3. SWOT Analysis
- 11.2.1.4. Recent Developments
- 11.2.1.5. Financials (Based on Availability)
- 11.2.2 CMR Naviscan
- 11.2.2.1. Overview
- 11.2.2.2. Products
- 11.2.2.3. SWOT Analysis
- 11.2.2.4. Recent Developments
- 11.2.2.5. Financials (Based on Availability)
- 11.2.3 Digirad
- 11.2.3.1. Overview
- 11.2.3.2. Products
- 11.2.3.3. SWOT Analysis
- 11.2.3.4. Recent Developments
- 11.2.3.5. Financials (Based on Availability)
- 11.2.4 GE
- 11.2.4.1. Overview
- 11.2.4.2. Products
- 11.2.4.3. SWOT Analysis
- 11.2.4.4. Recent Developments
- 11.2.4.5. Financials (Based on Availability)
- 11.2.5 Mayo Clinic
- 11.2.5.1. Overview
- 11.2.5.2. Products
- 11.2.5.3. SWOT Analysis
- 11.2.5.4. Recent Developments
- 11.2.5.5. Financials (Based on Availability)
- 11.2.1 Dilon Technologies
List of Figures
- Figure 1: Global Molecular Breast Imaging Revenue Breakdown (undefined, %) by Region 2025 & 2033
- Figure 2: North America Molecular Breast Imaging Revenue (undefined), by Application 2025 & 2033
- Figure 3: North America Molecular Breast Imaging Revenue Share (%), by Application 2025 & 2033
- Figure 4: North America Molecular Breast Imaging Revenue (undefined), by Types 2025 & 2033
- Figure 5: North America Molecular Breast Imaging Revenue Share (%), by Types 2025 & 2033
- Figure 6: North America Molecular Breast Imaging Revenue (undefined), by Country 2025 & 2033
- Figure 7: North America Molecular Breast Imaging Revenue Share (%), by Country 2025 & 2033
- Figure 8: South America Molecular Breast Imaging Revenue (undefined), by Application 2025 & 2033
- Figure 9: South America Molecular Breast Imaging Revenue Share (%), by Application 2025 & 2033
- Figure 10: South America Molecular Breast Imaging Revenue (undefined), by Types 2025 & 2033
- Figure 11: South America Molecular Breast Imaging Revenue Share (%), by Types 2025 & 2033
- Figure 12: South America Molecular Breast Imaging Revenue (undefined), by Country 2025 & 2033
- Figure 13: South America Molecular Breast Imaging Revenue Share (%), by Country 2025 & 2033
- Figure 14: Europe Molecular Breast Imaging Revenue (undefined), by Application 2025 & 2033
- Figure 15: Europe Molecular Breast Imaging Revenue Share (%), by Application 2025 & 2033
- Figure 16: Europe Molecular Breast Imaging Revenue (undefined), by Types 2025 & 2033
- Figure 17: Europe Molecular Breast Imaging Revenue Share (%), by Types 2025 & 2033
- Figure 18: Europe Molecular Breast Imaging Revenue (undefined), by Country 2025 & 2033
- Figure 19: Europe Molecular Breast Imaging Revenue Share (%), by Country 2025 & 2033
- Figure 20: Middle East & Africa Molecular Breast Imaging Revenue (undefined), by Application 2025 & 2033
- Figure 21: Middle East & Africa Molecular Breast Imaging Revenue Share (%), by Application 2025 & 2033
- Figure 22: Middle East & Africa Molecular Breast Imaging Revenue (undefined), by Types 2025 & 2033
- Figure 23: Middle East & Africa Molecular Breast Imaging Revenue Share (%), by Types 2025 & 2033
- Figure 24: Middle East & Africa Molecular Breast Imaging Revenue (undefined), by Country 2025 & 2033
- Figure 25: Middle East & Africa Molecular Breast Imaging Revenue Share (%), by Country 2025 & 2033
- Figure 26: Asia Pacific Molecular Breast Imaging Revenue (undefined), by Application 2025 & 2033
- Figure 27: Asia Pacific Molecular Breast Imaging Revenue Share (%), by Application 2025 & 2033
- Figure 28: Asia Pacific Molecular Breast Imaging Revenue (undefined), by Types 2025 & 2033
- Figure 29: Asia Pacific Molecular Breast Imaging Revenue Share (%), by Types 2025 & 2033
- Figure 30: Asia Pacific Molecular Breast Imaging Revenue (undefined), by Country 2025 & 2033
- Figure 31: Asia Pacific Molecular Breast Imaging Revenue Share (%), by Country 2025 & 2033
List of Tables
- Table 1: Global Molecular Breast Imaging Revenue undefined Forecast, by Application 2020 & 2033
- Table 2: Global Molecular Breast Imaging Revenue undefined Forecast, by Types 2020 & 2033
- Table 3: Global Molecular Breast Imaging Revenue undefined Forecast, by Region 2020 & 2033
- Table 4: Global Molecular Breast Imaging Revenue undefined Forecast, by Application 2020 & 2033
- Table 5: Global Molecular Breast Imaging Revenue undefined Forecast, by Types 2020 & 2033
- Table 6: Global Molecular Breast Imaging Revenue undefined Forecast, by Country 2020 & 2033
- Table 7: United States Molecular Breast Imaging Revenue (undefined) Forecast, by Application 2020 & 2033
- Table 8: Canada Molecular Breast Imaging Revenue (undefined) Forecast, by Application 2020 & 2033
- Table 9: Mexico Molecular Breast Imaging Revenue (undefined) Forecast, by Application 2020 & 2033
- Table 10: Global Molecular Breast Imaging Revenue undefined Forecast, by Application 2020 & 2033
- Table 11: Global Molecular Breast Imaging Revenue undefined Forecast, by Types 2020 & 2033
- Table 12: Global Molecular Breast Imaging Revenue undefined Forecast, by Country 2020 & 2033
- Table 13: Brazil Molecular Breast Imaging Revenue (undefined) Forecast, by Application 2020 & 2033
- Table 14: Argentina Molecular Breast Imaging Revenue (undefined) Forecast, by Application 2020 & 2033
- Table 15: Rest of South America Molecular Breast Imaging Revenue (undefined) Forecast, by Application 2020 & 2033
- Table 16: Global Molecular Breast Imaging Revenue undefined Forecast, by Application 2020 & 2033
- Table 17: Global Molecular Breast Imaging Revenue undefined Forecast, by Types 2020 & 2033
- Table 18: Global Molecular Breast Imaging Revenue undefined Forecast, by Country 2020 & 2033
- Table 19: United Kingdom Molecular Breast Imaging Revenue (undefined) Forecast, by Application 2020 & 2033
- Table 20: Germany Molecular Breast Imaging Revenue (undefined) Forecast, by Application 2020 & 2033
- Table 21: France Molecular Breast Imaging Revenue (undefined) Forecast, by Application 2020 & 2033
- Table 22: Italy Molecular Breast Imaging Revenue (undefined) Forecast, by Application 2020 & 2033
- Table 23: Spain Molecular Breast Imaging Revenue (undefined) Forecast, by Application 2020 & 2033
- Table 24: Russia Molecular Breast Imaging Revenue (undefined) Forecast, by Application 2020 & 2033
- Table 25: Benelux Molecular Breast Imaging Revenue (undefined) Forecast, by Application 2020 & 2033
- Table 26: Nordics Molecular Breast Imaging Revenue (undefined) Forecast, by Application 2020 & 2033
- Table 27: Rest of Europe Molecular Breast Imaging Revenue (undefined) Forecast, by Application 2020 & 2033
- Table 28: Global Molecular Breast Imaging Revenue undefined Forecast, by Application 2020 & 2033
- Table 29: Global Molecular Breast Imaging Revenue undefined Forecast, by Types 2020 & 2033
- Table 30: Global Molecular Breast Imaging Revenue undefined Forecast, by Country 2020 & 2033
- Table 31: Turkey Molecular Breast Imaging Revenue (undefined) Forecast, by Application 2020 & 2033
- Table 32: Israel Molecular Breast Imaging Revenue (undefined) Forecast, by Application 2020 & 2033
- Table 33: GCC Molecular Breast Imaging Revenue (undefined) Forecast, by Application 2020 & 2033
- Table 34: North Africa Molecular Breast Imaging Revenue (undefined) Forecast, by Application 2020 & 2033
- Table 35: South Africa Molecular Breast Imaging Revenue (undefined) Forecast, by Application 2020 & 2033
- Table 36: Rest of Middle East & Africa Molecular Breast Imaging Revenue (undefined) Forecast, by Application 2020 & 2033
- Table 37: Global Molecular Breast Imaging Revenue undefined Forecast, by Application 2020 & 2033
- Table 38: Global Molecular Breast Imaging Revenue undefined Forecast, by Types 2020 & 2033
- Table 39: Global Molecular Breast Imaging Revenue undefined Forecast, by Country 2020 & 2033
- Table 40: China Molecular Breast Imaging Revenue (undefined) Forecast, by Application 2020 & 2033
- Table 41: India Molecular Breast Imaging Revenue (undefined) Forecast, by Application 2020 & 2033
- Table 42: Japan Molecular Breast Imaging Revenue (undefined) Forecast, by Application 2020 & 2033
- Table 43: South Korea Molecular Breast Imaging Revenue (undefined) Forecast, by Application 2020 & 2033
- Table 44: ASEAN Molecular Breast Imaging Revenue (undefined) Forecast, by Application 2020 & 2033
- Table 45: Oceania Molecular Breast Imaging Revenue (undefined) Forecast, by Application 2020 & 2033
- Table 46: Rest of Asia Pacific Molecular Breast Imaging Revenue (undefined) Forecast, by Application 2020 & 2033
Frequently Asked Questions
1. What is the projected Compound Annual Growth Rate (CAGR) of the Molecular Breast Imaging?
The projected CAGR is approximately 9.7%.
2. Which companies are prominent players in the Molecular Breast Imaging?
Key companies in the market include Dilon Technologies, CMR Naviscan, Digirad, GE, Mayo Clinic.
3. What are the main segments of the Molecular Breast Imaging?
The market segments include Application, Types.
4. Can you provide details about the market size?
The market size is estimated to be USD XXX N/A as of 2022.
5. What are some drivers contributing to market growth?
N/A
6. What are the notable trends driving market growth?
N/A
7. Are there any restraints impacting market growth?
N/A
8. Can you provide examples of recent developments in the market?
N/A
9. What pricing options are available for accessing the report?
Pricing options include single-user, multi-user, and enterprise licenses priced at USD 4900.00, USD 7350.00, and USD 9800.00 respectively.
10. Is the market size provided in terms of value or volume?
The market size is provided in terms of value, measured in N/A.
11. Are there any specific market keywords associated with the report?
Yes, the market keyword associated with the report is "Molecular Breast Imaging," which aids in identifying and referencing the specific market segment covered.
12. How do I determine which pricing option suits my needs best?
The pricing options vary based on user requirements and access needs. Individual users may opt for single-user licenses, while businesses requiring broader access may choose multi-user or enterprise licenses for cost-effective access to the report.
13. Are there any additional resources or data provided in the Molecular Breast Imaging report?
While the report offers comprehensive insights, it's advisable to review the specific contents or supplementary materials provided to ascertain if additional resources or data are available.
14. How can I stay updated on further developments or reports in the Molecular Breast Imaging?
To stay informed about further developments, trends, and reports in the Molecular Breast Imaging, consider subscribing to industry newsletters, following relevant companies and organizations, or regularly checking reputable industry news sources and publications.
Methodology
Step 1 - Identification of Relevant Samples Size from Population Database


Step 2 - Approaches for Defining Global Market Size (Value, Volume* & Price*)

Note*: In applicable scenarios
Step 3 - Data Sources
Primary Research
- Web Analytics
- Survey Reports
- Research Institute
- Latest Research Reports
- Opinion Leaders
Secondary Research
- Annual Reports
- White Paper
- Latest Press Release
- Industry Association
- Paid Database
- Investor Presentations

Step 4 - Data Triangulation
Involves using different sources of information in order to increase the validity of a study
These sources are likely to be stakeholders in a program - participants, other researchers, program staff, other community members, and so on.
Then we put all data in single framework & apply various statistical tools to find out the dynamic on the market.
During the analysis stage, feedback from the stakeholder groups would be compared to determine areas of agreement as well as areas of divergence