

Key Insights
The Molten Salt Thermal Energy Storage (MSTES) market is poised for substantial expansion, driven by escalating demand for renewable energy integration and efficient energy storage solutions. The market is projected to grow at a Compound Annual Growth Rate (CAGR) of 9.8%, reaching a market size of 2.22 billion by the end of the forecast period. Key growth enablers include the inherent intermittency of solar and wind power, which necessitates reliable energy storage for grid stability and uninterrupted power supply. Advancements in technologies such as parabolic troughs, Fresnel reflectors, and power tower systems are optimizing efficiency and reducing deployment costs, further stimulating market penetration. Supportive government incentives and policies promoting renewable energy adoption also significantly contribute to this upward trend. While challenges like substantial initial investment and the requirement for advanced materials persist, ongoing research and development are actively mitigating these limitations. Geographic expansion is a notable trend, with North America, Europe, and Asia-Pacific leading market adoption. Significant growth potential also exists in emerging markets like the Middle East and Africa, fueled by large-scale renewable energy projects. Market segmentation by technology highlights diverse MSTES implementation strategies, each offering unique advantages and applications. Leading industry players, including SCHOTT AG, SolarReserve LLC, and Acciona S.A., are actively shaping the market landscape through strategic innovations and collaborations.
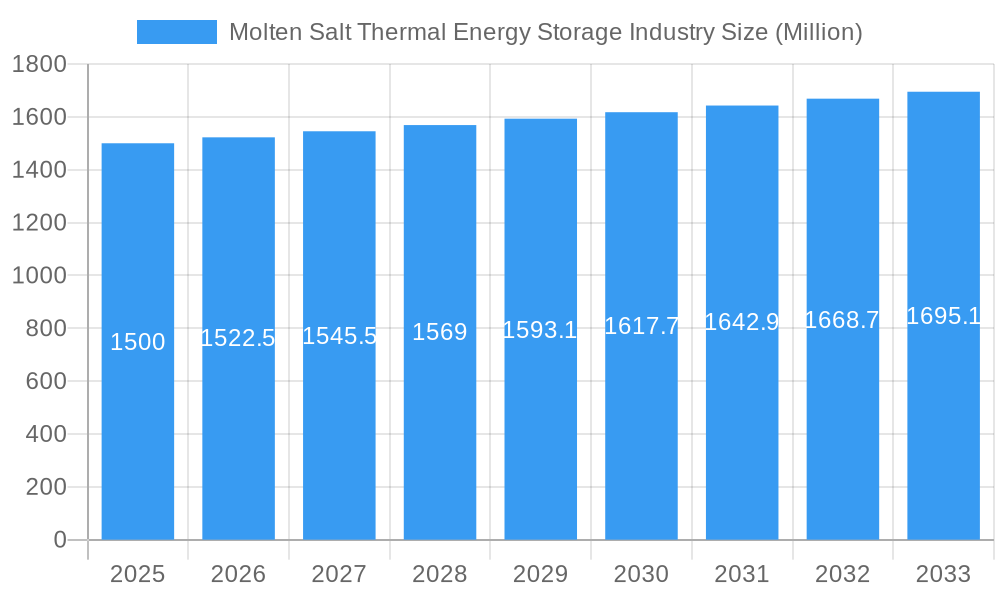
Molten Salt Thermal Energy Storage Industry Market Size (In Billion)
The forecast period (2025-2033) anticipates sustained market growth, with the market size expected to increase significantly from its 2025 base value. This expansion will be propelled by the increasing deployment of renewable energy capacity, favorable government regulations, and technological innovations that enhance cost-effectiveness and performance. Regional growth rates will be influenced by the pace of renewable energy adoption, regulatory frameworks, and the availability of suitable locations for MSTES infrastructure. Continuous development and refinement of MSTES technology will enhance its economic viability and efficiency, thereby increasing its appeal and accelerating adoption across diverse sectors. The synergistic impact of technological progress, supportive regulatory environments, and expanding renewable energy deployment will ensure the MSTES market's sustained growth and significant expansion in the coming years.
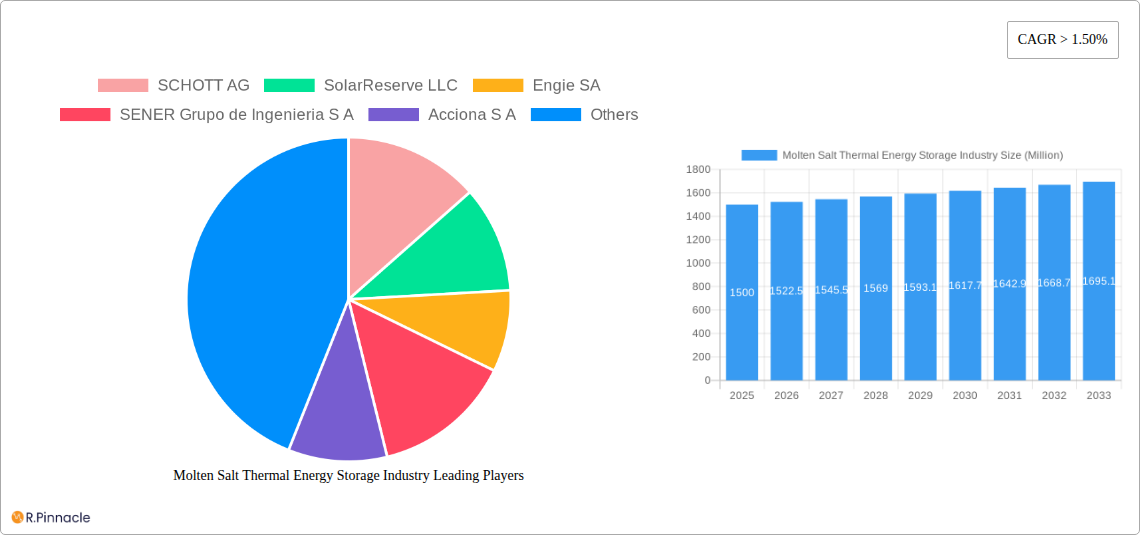
Molten Salt Thermal Energy Storage Industry Company Market Share
Molten Salt Thermal Energy Storage Industry Report: 2019-2033
This comprehensive report provides an in-depth analysis of the Molten Salt Thermal Energy Storage (MSTES) industry, offering actionable insights for industry professionals, investors, and strategists. Covering the period 2019-2033, with a base year of 2025 and a forecast period of 2025-2033, this report unveils market dynamics, technological advancements, and key players shaping the future of MSTES. The market is projected to reach xx Million by 2033, exhibiting a CAGR of xx% during the forecast period.
Molten Salt Thermal Energy Storage Industry Market Structure & Innovation Trends
This section analyzes the competitive landscape of the MSTES market, encompassing market concentration, innovation drivers, regulatory frameworks, and M&A activities. The market is moderately consolidated, with key players like SCHOTT AG, SolarReserve LLC, Engie SA, SENER Grupo de Ingenieria S.A, Acciona S.A, Abengoa SA, Yara International ASA, and BrightSource Energy Inc. holding significant market share. However, the entry of smaller innovative companies is increasing competition.
- Market Concentration: The top 5 players hold an estimated xx% market share in 2025, indicating a moderately consolidated market.
- Innovation Drivers: Government incentives for renewable energy integration, advancements in materials science, and the need for reliable energy storage solutions are key drivers.
- Regulatory Frameworks: Varying government policies across regions influence market growth and investment decisions. Incentives and regulations surrounding renewable energy integration play a significant role.
- Product Substitutes: Other thermal energy storage technologies, such as compressed air energy storage, pose a competitive threat, although MSTES possesses advantages in terms of higher energy density and efficiency.
- M&A Activities: Over the historical period (2019-2024), the MSTES industry witnessed xx Million in M&A deal value, predominantly focused on consolidating technologies and expanding market reach. The projected value for the forecast period (2025-2033) is xx Million.
- End-user Demographics: The primary end-users are utilities, independent power producers, and industrial facilities seeking reliable and efficient energy storage solutions for renewable energy integration.
Molten Salt Thermal Energy Storage Industry Market Dynamics & Trends
The MSTES market is experiencing robust growth driven by several factors. The increasing adoption of renewable energy sources like solar and wind power necessitates efficient and reliable energy storage solutions. Technological advancements in materials and system design are improving efficiency and reducing costs. Consumer preference for sustainable energy solutions is fueling demand. However, competitive dynamics, including technological disruptions from alternative storage technologies and fluctuating raw material prices, present challenges. The market is witnessing a shift toward larger-scale deployments, driven by the increasing demand for grid-scale energy storage. Furthermore, the integration of MSTES with other energy technologies, such as combined cycle power plants, is creating new opportunities.
Dominant Regions & Segments in Molten Salt Thermal Energy Storage Industry
The North American market currently holds the leading position in the MSTES industry due to supportive government policies and a strong focus on renewable energy integration. However, other regions, such as Europe and Asia-Pacific, are exhibiting significant growth potential due to increasing investments in renewable energy infrastructure.
Technology Segment Dominance:
- Parabolic Troughs: This technology currently holds the largest market share due to its maturity and cost-effectiveness. Key growth drivers include economies of scale, established supply chains, and successful large-scale deployments.
- Fresnel Reflector: This segment is experiencing moderate growth, driven by advancements in reflector design and cost reduction initiatives.
- Power Tower: The Power Tower technology holds a smaller market share currently, due to higher upfront capital costs. However, advancements in receiver technology and energy storage capacity are driving growth.
Regional Dominance Drivers:
- North America: Strong government support for renewable energy, robust grid infrastructure, and a large market for solar thermal power plants are key drivers.
- Europe: Stringent emission reduction targets and increasing investments in renewable energy infrastructure are fostering growth.
- Asia-Pacific: Rapid economic growth, rising energy demand, and government initiatives to promote renewable energy are driving the MSTES market expansion.
Molten Salt Thermal Energy Storage Industry Product Innovations
Recent product innovations focus on enhancing the efficiency and reducing the cost of molten salt thermal energy storage systems. Developments include advanced materials with improved thermal properties, optimized system designs for reduced heat loss, and integrated control systems for enhanced performance. These innovations are expanding the applicability of MSTES to various sectors beyond renewable energy, including industrial process heat applications. The improved scalability and modularity of new system designs are further enhancing their market fit.
Report Scope & Segmentation Analysis
This report comprehensively segments the MSTES market by technology (Parabolic Troughs, Fresnel Reflector, Power Tower), capacity (MWh), application (utility-scale, industrial, commercial), and region (North America, Europe, Asia-Pacific, etc.). Each segment is analyzed in detail, providing insights into its growth projections, market size, and competitive dynamics. For example, the Parabolic Trough segment is expected to maintain its dominance due to its established technology and cost-effectiveness, while the Power Tower segment is anticipated to show the highest growth rate due to its potential for high energy density.
Key Drivers of Molten Salt Thermal Energy Storage Industry Growth
The growth of the MSTES market is primarily driven by the increasing demand for renewable energy integration, stringent environmental regulations aimed at reducing carbon emissions, and government incentives promoting renewable energy adoption. The decreasing cost of MSTES technology and improvements in storage capacity and efficiency are further boosting market growth.
Challenges in the Molten Salt Thermal Energy Storage Industry Sector
The MSTES industry faces challenges including high initial capital costs, potential material degradation over time, and the need for skilled labor for installation and maintenance. Furthermore, variations in material prices and supply chain disruptions can impact project costs and timelines. Regulatory uncertainty in some regions also poses a risk to investment and deployment. These factors collectively impact the rate of market penetration.
Emerging Opportunities in Molten Salt Thermal Energy Storage Industry
Emerging opportunities lie in the integration of MSTES with other renewable energy technologies, such as solar photovoltaic and wind power, to create hybrid energy systems. The development of advanced materials with improved thermal properties and the exploration of new applications in industrial process heat are further creating growth opportunities. The expanding demand for grid-scale energy storage, driven by increasing renewable energy penetration, presents a significant market expansion opportunity.
Leading Players in the Molten Salt Thermal Energy Storage Industry Market
- SCHOTT AG
- SolarReserve LLC
- Engie SA
- SENER Grupo de Ingenieria S.A
- Acciona S.A
- Abengoa SA
- Yara International ASA
- BrightSource Energy Inc
Key Developments in Molten Salt Thermal Energy Storage Industry Industry
- November 2022: Hyme Energy ApS partnered with Bornholms Energi & Forsyning (BEOF) to build a 1 MW/20 MWh molten salt thermal energy storage demonstrator on Bornholm, Denmark, scheduled for completion in 2024. This project demonstrates the growing interest in smaller-scale MSTES deployments for localized energy solutions.
Future Outlook for Molten Salt Thermal Energy Storage Industry Market
The MSTES market is poised for significant growth in the coming years, driven by increasing demand for renewable energy integration, technological advancements, and supportive government policies. Strategic opportunities lie in developing innovative system designs, improving material efficiency, and expanding applications into new markets. The focus on reducing costs and enhancing scalability will be crucial for accelerating market penetration and achieving widespread adoption.
Molten Salt Thermal Energy Storage Industry Segmentation
-
1. Technology
- 1.1. Parabolic Troughs
- 1.2. Fresnel Reflector
- 1.3. Power Tower
Molten Salt Thermal Energy Storage Industry Segmentation By Geography
- 1. North America
- 2. Asia Pacific
- 3. Europe
- 4. South America
- 5. Middle East and Africa
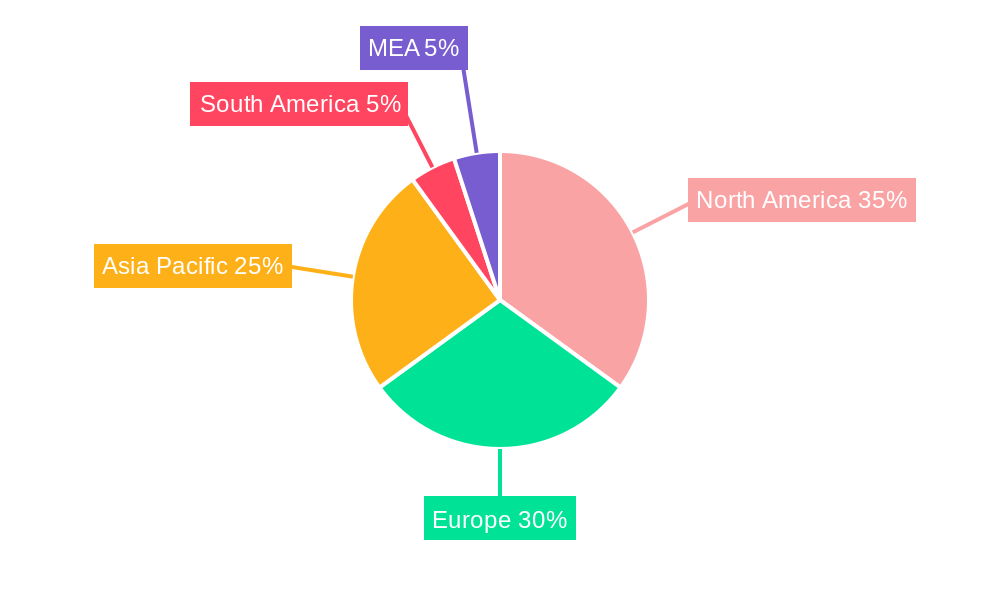
Molten Salt Thermal Energy Storage Industry Regional Market Share
Geographic Coverage of Molten Salt Thermal Energy Storage Industry
Molten Salt Thermal Energy Storage Industry REPORT HIGHLIGHTS
| Aspects | Details |
|---|---|
| Study Period | 2020-2034 |
| Base Year | 2025 |
| Estimated Year | 2026 |
| Forecast Period | 2026-2034 |
| Historical Period | 2020-2025 |
| Growth Rate | CAGR of 9.8% from 2020-2034 |
| Segmentation |
|
Table of Contents
- 1. Introduction
- 1.1. Research Scope
- 1.2. Market Segmentation
- 1.3. Research Objective
- 1.4. Definitions and Assumptions
- 2. Executive Summary
- 2.1. Market Snapshot
- 3. Market Dynamics
- 3.1. Market Drivers
- 3.2. Market Restrains
- 3.3. Market Trends
- 3.4. Market Opportunities
- 4. Market Factor Analysis
- 4.1. Porters Five Forces
- 4.1.1. Bargaining Power of Suppliers
- 4.1.2. Bargaining Power of Buyers
- 4.1.3. Threat of New Entrants
- 4.1.4. Threat of Substitutes
- 4.1.5. Competitive Rivalry
- 4.2. PESTEL analysis
- 4.3. BCG Analysis
- 4.3.1. Stars (High Growth, High Market Share)
- 4.3.2. Cash Cows (Low Growth, High Market Share)
- 4.3.3. Question Mark (High Growth, Low Market Share)
- 4.3.4. Dogs (Low Growth, Low Market Share)
- 4.4. Ansoff Matrix Analysis
- 4.5. Supply Chain Analysis
- 4.6. Regulatory Landscape
- 4.7. Current Market Potential and Opportunity Assessment (TAM–SAM–SOM Framework)
- 4.8. PRI Analyst Note
- 4.1. Porters Five Forces
- 5. Market Analysis, Insights and Forecast 2021-2033
- 5.1. Market Analysis, Insights and Forecast - by Technology
- 5.1.1. Parabolic Troughs
- 5.1.2. Fresnel Reflector
- 5.1.3. Power Tower
- 5.2. Market Analysis, Insights and Forecast - by Region
- 5.2.1. North America
- 5.2.2. Asia Pacific
- 5.2.3. Europe
- 5.2.4. South America
- 5.2.5. Middle East and Africa
- 5.1. Market Analysis, Insights and Forecast - by Technology
- 6. Global Molten Salt Thermal Energy Storage Industry Analysis, Insights and Forecast, 2021-2033
- 6.1. Market Analysis, Insights and Forecast - by Technology
- 6.1.1. Parabolic Troughs
- 6.1.2. Fresnel Reflector
- 6.1.3. Power Tower
- 6.1. Market Analysis, Insights and Forecast - by Technology
- 7. North America Molten Salt Thermal Energy Storage Industry Analysis, Insights and Forecast, 2020-2032
- 7.1. Market Analysis, Insights and Forecast - by Technology
- 7.1.1. Parabolic Troughs
- 7.1.2. Fresnel Reflector
- 7.1.3. Power Tower
- 7.1. Market Analysis, Insights and Forecast - by Technology
- 8. Asia Pacific Molten Salt Thermal Energy Storage Industry Analysis, Insights and Forecast, 2020-2032
- 8.1. Market Analysis, Insights and Forecast - by Technology
- 8.1.1. Parabolic Troughs
- 8.1.2. Fresnel Reflector
- 8.1.3. Power Tower
- 8.1. Market Analysis, Insights and Forecast - by Technology
- 9. Europe Molten Salt Thermal Energy Storage Industry Analysis, Insights and Forecast, 2020-2032
- 9.1. Market Analysis, Insights and Forecast - by Technology
- 9.1.1. Parabolic Troughs
- 9.1.2. Fresnel Reflector
- 9.1.3. Power Tower
- 9.1. Market Analysis, Insights and Forecast - by Technology
- 10. South America Molten Salt Thermal Energy Storage Industry Analysis, Insights and Forecast, 2020-2032
- 10.1. Market Analysis, Insights and Forecast - by Technology
- 10.1.1. Parabolic Troughs
- 10.1.2. Fresnel Reflector
- 10.1.3. Power Tower
- 10.1. Market Analysis, Insights and Forecast - by Technology
- 11. Middle East and Africa Molten Salt Thermal Energy Storage Industry Analysis, Insights and Forecast, 2020-2032
- 11.1. Market Analysis, Insights and Forecast - by Technology
- 11.1.1. Parabolic Troughs
- 11.1.2. Fresnel Reflector
- 11.1.3. Power Tower
- 11.1. Market Analysis, Insights and Forecast - by Technology
- 12. Competitive Analysis
- 12.1. Company Profiles
- 12.1.1 SCHOTT AG
- 12.1.1.1. Company Overview
- 12.1.1.2. Products
- 12.1.1.3. Company Financials
- 12.1.1.4. SWOT Analysis
- 12.1.2 SolarReserve LLC
- 12.1.2.1. Company Overview
- 12.1.2.2. Products
- 12.1.2.3. Company Financials
- 12.1.2.4. SWOT Analysis
- 12.1.3 Engie SA
- 12.1.3.1. Company Overview
- 12.1.3.2. Products
- 12.1.3.3. Company Financials
- 12.1.3.4. SWOT Analysis
- 12.1.4 SENER Grupo de Ingenieria S A
- 12.1.4.1. Company Overview
- 12.1.4.2. Products
- 12.1.4.3. Company Financials
- 12.1.4.4. SWOT Analysis
- 12.1.5 Acciona S A
- 12.1.5.1. Company Overview
- 12.1.5.2. Products
- 12.1.5.3. Company Financials
- 12.1.5.4. SWOT Analysis
- 12.1.6 Abengoa SA
- 12.1.6.1. Company Overview
- 12.1.6.2. Products
- 12.1.6.3. Company Financials
- 12.1.6.4. SWOT Analysis
- 12.1.7 Yara International ASA
- 12.1.7.1. Company Overview
- 12.1.7.2. Products
- 12.1.7.3. Company Financials
- 12.1.7.4. SWOT Analysis
- 12.1.8 BrightSource Energy Inc
- 12.1.8.1. Company Overview
- 12.1.8.2. Products
- 12.1.8.3. Company Financials
- 12.1.8.4. SWOT Analysis
- 12.1.1 SCHOTT AG
- 12.2. Market Entropy
- 12.2.1 Company's Key Areas Served
- 12.2.2 Recent Developments
- 12.3. Company Market Share Analysis 2025
- 12.3.1 Top 5 Companies Market Share Analysis
- 12.3.2 Top 3 Companies Market Share Analysis
- 12.4. List of Potential Customers
- 13. Research Methodology
List of Figures
- Figure 1: Global Molten Salt Thermal Energy Storage Industry Revenue Breakdown (billion, %) by Region 2025 & 2033
- Figure 2: North America Molten Salt Thermal Energy Storage Industry Revenue (billion), by Technology 2025 & 2033
- Figure 3: North America Molten Salt Thermal Energy Storage Industry Revenue Share (%), by Technology 2025 & 2033
- Figure 4: North America Molten Salt Thermal Energy Storage Industry Revenue (billion), by Country 2025 & 2033
- Figure 5: North America Molten Salt Thermal Energy Storage Industry Revenue Share (%), by Country 2025 & 2033
- Figure 6: Asia Pacific Molten Salt Thermal Energy Storage Industry Revenue (billion), by Technology 2025 & 2033
- Figure 7: Asia Pacific Molten Salt Thermal Energy Storage Industry Revenue Share (%), by Technology 2025 & 2033
- Figure 8: Asia Pacific Molten Salt Thermal Energy Storage Industry Revenue (billion), by Country 2025 & 2033
- Figure 9: Asia Pacific Molten Salt Thermal Energy Storage Industry Revenue Share (%), by Country 2025 & 2033
- Figure 10: Europe Molten Salt Thermal Energy Storage Industry Revenue (billion), by Technology 2025 & 2033
- Figure 11: Europe Molten Salt Thermal Energy Storage Industry Revenue Share (%), by Technology 2025 & 2033
- Figure 12: Europe Molten Salt Thermal Energy Storage Industry Revenue (billion), by Country 2025 & 2033
- Figure 13: Europe Molten Salt Thermal Energy Storage Industry Revenue Share (%), by Country 2025 & 2033
- Figure 14: South America Molten Salt Thermal Energy Storage Industry Revenue (billion), by Technology 2025 & 2033
- Figure 15: South America Molten Salt Thermal Energy Storage Industry Revenue Share (%), by Technology 2025 & 2033
- Figure 16: South America Molten Salt Thermal Energy Storage Industry Revenue (billion), by Country 2025 & 2033
- Figure 17: South America Molten Salt Thermal Energy Storage Industry Revenue Share (%), by Country 2025 & 2033
- Figure 18: Middle East and Africa Molten Salt Thermal Energy Storage Industry Revenue (billion), by Technology 2025 & 2033
- Figure 19: Middle East and Africa Molten Salt Thermal Energy Storage Industry Revenue Share (%), by Technology 2025 & 2033
- Figure 20: Middle East and Africa Molten Salt Thermal Energy Storage Industry Revenue (billion), by Country 2025 & 2033
- Figure 21: Middle East and Africa Molten Salt Thermal Energy Storage Industry Revenue Share (%), by Country 2025 & 2033
List of Tables
- Table 1: Global Molten Salt Thermal Energy Storage Industry Revenue billion Forecast, by Technology 2020 & 2033
- Table 2: Global Molten Salt Thermal Energy Storage Industry Revenue billion Forecast, by Region 2020 & 2033
- Table 3: Global Molten Salt Thermal Energy Storage Industry Revenue billion Forecast, by Technology 2020 & 2033
- Table 4: Global Molten Salt Thermal Energy Storage Industry Revenue billion Forecast, by Country 2020 & 2033
- Table 5: Global Molten Salt Thermal Energy Storage Industry Revenue billion Forecast, by Technology 2020 & 2033
- Table 6: Global Molten Salt Thermal Energy Storage Industry Revenue billion Forecast, by Country 2020 & 2033
- Table 7: Global Molten Salt Thermal Energy Storage Industry Revenue billion Forecast, by Technology 2020 & 2033
- Table 8: Global Molten Salt Thermal Energy Storage Industry Revenue billion Forecast, by Country 2020 & 2033
- Table 9: Global Molten Salt Thermal Energy Storage Industry Revenue billion Forecast, by Technology 2020 & 2033
- Table 10: Global Molten Salt Thermal Energy Storage Industry Revenue billion Forecast, by Country 2020 & 2033
- Table 11: Global Molten Salt Thermal Energy Storage Industry Revenue billion Forecast, by Technology 2020 & 2033
- Table 12: Global Molten Salt Thermal Energy Storage Industry Revenue billion Forecast, by Country 2020 & 2033
Frequently Asked Questions
1. What is the projected Compound Annual Growth Rate (CAGR) of the Molten Salt Thermal Energy Storage Industry?
The projected CAGR is approximately 9.8%.
2. Which companies are prominent players in the Molten Salt Thermal Energy Storage Industry?
Key companies in the market include SCHOTT AG, SolarReserve LLC, Engie SA, SENER Grupo de Ingenieria S A, Acciona S A, Abengoa SA, Yara International ASA, BrightSource Energy Inc.
3. What are the main segments of the Molten Salt Thermal Energy Storage Industry?
The market segments include Technology.
4. Can you provide details about the market size?
The market size is estimated to be USD 2.22 billion as of 2022.
5. What are some drivers contributing to market growth?
4.; Increasing Investments in Offshore Wind Power Projects4.; Supportive Government Policies.
6. What are the notable trends driving market growth?
Parabolic Trough Segment to Dominate the Market.
7. Are there any restraints impacting market growth?
4.; Increasing Adopting of Alternative Clean Energy Sources (Ex: Solar. Hydro).
8. Can you provide examples of recent developments in the market?
November 2022: Hyme Energy ApS announced that the company is partnering with Bornholms Energi & Forsyning (BEOF) to build its first molten salt thermal energy storage demonstrator on the Danish island of Bornholm. The storage facility is scheduled for completion in 2024 and will have a capacity of 1 MW/20 MWh. It will provide heat, power, and ancillary services to the local network.
9. What pricing options are available for accessing the report?
Pricing options include single-user, multi-user, and enterprise licenses priced at USD 4750, USD 5250, and USD 8750 respectively.
10. Is the market size provided in terms of value or volume?
The market size is provided in terms of value, measured in billion.
11. Are there any specific market keywords associated with the report?
Yes, the market keyword associated with the report is "Molten Salt Thermal Energy Storage Industry," which aids in identifying and referencing the specific market segment covered.
12. How do I determine which pricing option suits my needs best?
The pricing options vary based on user requirements and access needs. Individual users may opt for single-user licenses, while businesses requiring broader access may choose multi-user or enterprise licenses for cost-effective access to the report.
13. Are there any additional resources or data provided in the Molten Salt Thermal Energy Storage Industry report?
While the report offers comprehensive insights, it's advisable to review the specific contents or supplementary materials provided to ascertain if additional resources or data are available.
14. How can I stay updated on further developments or reports in the Molten Salt Thermal Energy Storage Industry?
To stay informed about further developments, trends, and reports in the Molten Salt Thermal Energy Storage Industry, consider subscribing to industry newsletters, following relevant companies and organizations, or regularly checking reputable industry news sources and publications.
Methodology
Step 1 - Identification of Relevant Samples Size from Population Database


Step 2 - Approaches for Defining Global Market Size (Value, Volume* & Price*)

Note*: In applicable scenarios
Step 3 - Data Sources
Primary Research
- Web Analytics
- Survey Reports
- Research Institute
- Latest Research Reports
- Opinion Leaders
Secondary Research
- Annual Reports
- White Paper
- Latest Press Release
- Industry Association
- Paid Database
- Investor Presentations

Step 4 - Data Triangulation
Involves using different sources of information in order to increase the validity of a study
These sources are likely to be stakeholders in a program - participants, other researchers, program staff, other community members, and so on.
Then we put all data in single framework & apply various statistical tools to find out the dynamic on the market.
During the analysis stage, feedback from the stakeholder groups would be compared to determine areas of agreement as well as areas of divergence