

Key Insights
The global molybdenum disulfide (MoS2) market is projected to reach $0.9 billion by 2025, with an anticipated compound annual growth rate (CAGR) of 4.7% from 2025 to 2033. This steady expansion is propelled by increasing demand across key sectors, including automotive, aerospace, and electronics. The adoption of MoS2 in advanced lubricants and coatings, leveraging its superior lubricating properties and thermal stability, is a primary growth catalyst. Furthermore, the burgeoning semiconductor industry's need for high-purity MoS2 crystals for cutting-edge electronic components significantly contributes to market growth. The construction and chemical industries' utilization of MoS2 for its catalytic capabilities and in specialized materials also supports overall market expansion. Key restraints include molybdenum price volatility, the availability of substitute materials, and potential supply chain vulnerabilities. Market segmentation highlights a strong preference for MoS2 powder, followed by MoS2 crystals, aligning with diverse application needs. Geographically, the Asia-Pacific region, particularly China and India, leads the market due to rapid industrialization and manufacturing prowess. North America and Europe also command significant market share, driven by technological innovation and established industrial infrastructure.
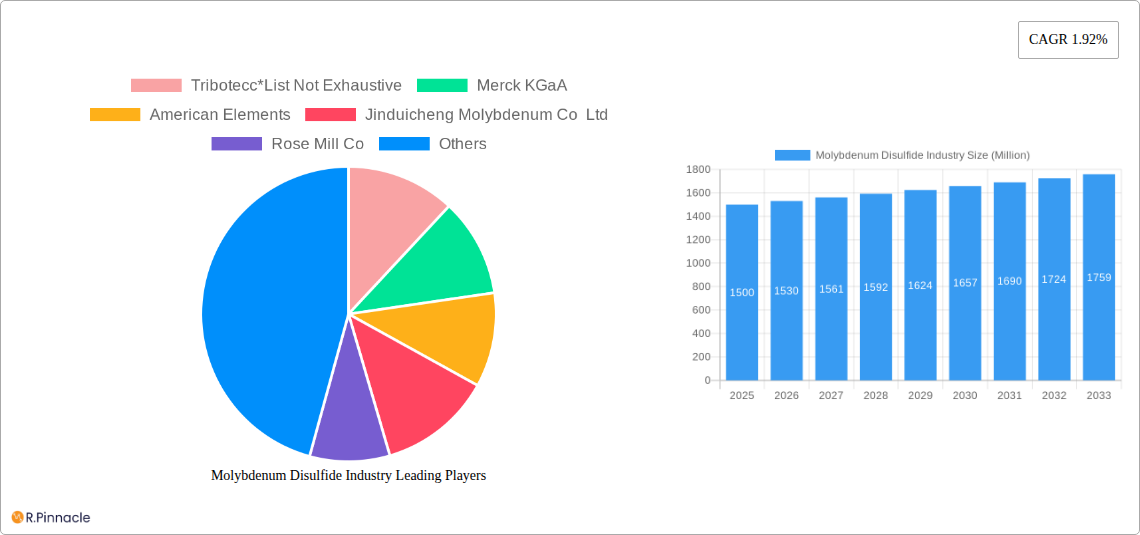
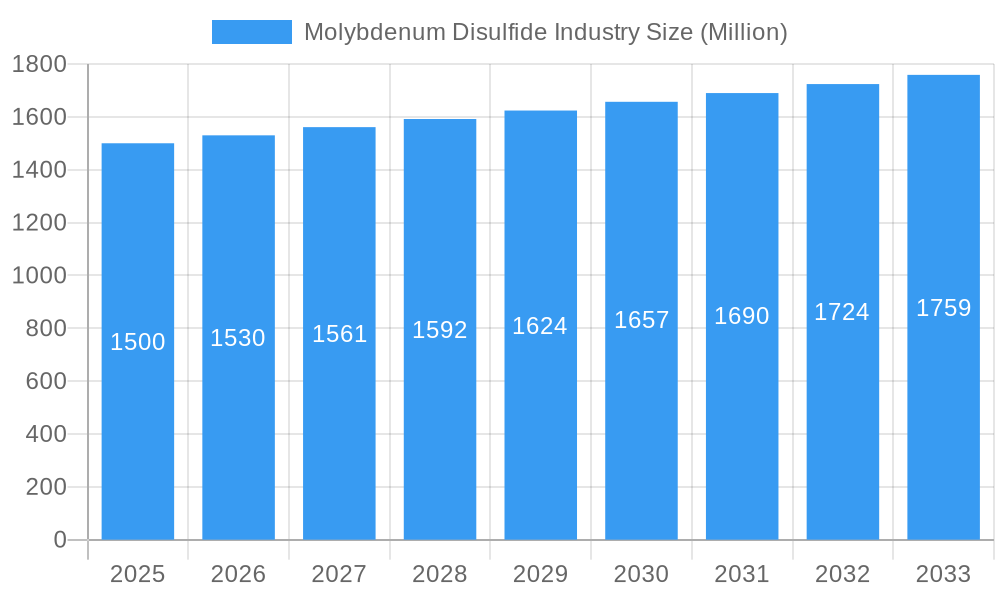
Molybdenum Disulfide Industry Market Size (In Million)
The forecast period (2025-2033) indicates sustained demand growth across various industries, suggesting a market characterized by consistent, rather than disruptive, expansion. A granular understanding can be further refined through specific regional and application market size analyses. The competitive landscape comprises established chemical manufacturers and specialized materials providers. Continued innovation in advanced MoS2 applications within high-technology sectors is anticipated to be pivotal for future market growth.
Molybdenum Disulfide Industry Company Market Share
Molybdenum Disulfide Market Analysis: 2019 - 2033
This report offers a comprehensive analysis of the global molybdenum disulfide (MoS2) market, detailing market size, segmentation, growth drivers, challenges, and key industry players. Utilizing data from the historical period (2019-2024), base year (2025), and forecast period through 2033, this report provides essential insights for industry professionals, investors, and researchers.
Molybdenum Disulfide Industry Market Structure & Innovation Trends
The global molybdenum disulfide market is moderately fragmented, with several key players vying for market share. While precise market share figures for individual companies are proprietary, key players such as Merck KGaA, American Elements, Jinduicheng Molybdenum Co Ltd, and others, account for a significant portion of the overall market. The industry witnesses frequent mergers and acquisitions (M&A) activities, with deal values varying significantly depending on the size and strategic importance of the target company. For example, in 2024, there were xx M&A deals totaling approximately $xx Million. Innovation is driven by the need for enhanced performance characteristics in applications like lubricants and semiconductors. Strict regulatory frameworks concerning environmental impact and material safety influence production and application methods. Graphene and other 2D materials represent potential substitutes, although MoS2 retains advantages in certain applications due to its cost-effectiveness and established manufacturing processes. The end-user demographics are diverse, encompassing automotive, electronics, and chemical industries, driving demand across various MoS2 types.
Molybdenum Disulfide Industry Market Dynamics & Trends
The molybdenum disulfide market is projected to experience robust growth, with a Compound Annual Growth Rate (CAGR) of xx% during the forecast period (2025-2033). This growth is fueled by increasing demand from the automotive and electronics sectors, driven by the adoption of electric vehicles and advanced electronics. Technological advancements in the synthesis and functionalization of MoS2 are paving the way for novel applications in energy storage and catalysis. Consumer preference for environmentally friendly and high-performance materials is further driving market growth. Intense competition among existing players is stimulating innovation and price optimization, creating a dynamic market landscape. Market penetration is highest in the lubricants and coatings segment, while the semiconductor segment is expected to witness the fastest growth due to the increasing demand for high-performance electronics.
Dominant Regions & Segments in Molybdenum Disulfide Industry
Leading Region: Asia-Pacific, particularly China, currently holds the dominant position in the global molybdenum disulfide market. This is driven by substantial production capacity, a robust downstream manufacturing base, and substantial growth in various end-user industries.
Leading Application Segment: Lubricants and coatings account for the largest share of the molybdenum disulfide market, driven by its superior lubricating properties and resistance to wear and tear.
Leading End-user Industry: The automotive industry is the largest consumer of molybdenum disulfide, primarily in lubricants and anti-wear coatings.
Leading Type: Molybdenum Disulfide (MoS2) Powder dominates the market due to its ease of processing and wide range of applications.
Key Drivers in Dominant Regions:
- China: Government support for advanced materials research, a large domestic market, and a strong manufacturing base are driving growth.
- North America: Innovation in semiconductor applications and focus on advanced materials for aerospace and defense industries are key drivers.
- Europe: Stringent environmental regulations and a focus on sustainable technologies are shaping the market dynamics.
Detailed analysis indicates that Asia-Pacific's dominance is primarily due to lower production costs and large-scale manufacturing capabilities. North America and Europe show steady growth driven by technological innovation and the demand for high-quality MoS2 products.
Molybdenum Disulfide Industry Product Innovations
Recent advancements focus on the development of novel MoS2 structures and modifications to enhance its properties for specific applications. For example, the creation of 3D MoS2 foams for electrochemical applications significantly improves performance. Companies are exploring methods to enhance the dispersibility of MoS2 powders and the synthesis of high-purity MoS2 crystals to meet the stringent requirements of the semiconductor industry. These innovations are improving the market fit of MoS2 by enhancing its versatility and efficiency across various applications.
Report Scope & Segmentation Analysis
This report segments the molybdenum disulfide market by application (lubricants and coatings, semiconductors, catalysts, other applications), end-user industry (automotive, aerospace and defense, electrical and electronics, construction, chemical and petrochemical, other end-user industries), and type (Molybdenum Disulfide (MoS2) Powder, Molybdenum Disulfide (MoS2) Crystals). Each segment's market size, growth projections, and competitive landscape are analyzed to provide a holistic view of the market. Growth projections for each segment vary significantly, with the semiconductor segment expected to experience the highest growth rate.
Key Drivers of Molybdenum Disulfide Industry Growth
The growth of the molybdenum disulfide industry is propelled by several factors. The increasing demand for high-performance lubricants in the automotive and manufacturing sectors is a significant driver. Furthermore, the growing use of MoS2 in electronics, particularly in semiconductors, fuels market expansion. Government initiatives promoting the adoption of sustainable materials and stringent environmental regulations further contribute to the industry's growth. Finally, technological advancements leading to the creation of novel MoS2-based materials are broadening its application possibilities.
Challenges in the Molybdenum Disulfide Industry Sector
The molybdenum disulfide industry faces challenges including price volatility of raw materials, stringent environmental regulations impacting production costs, and intense competition among existing players. Supply chain disruptions can also lead to production delays and increased costs. Furthermore, the emergence of substitute materials poses a threat to MoS2's market share, requiring continuous innovation and improvement of product properties. The industry is also affected by the fluctuating demand of end-user sectors like automotive depending on economic conditions.
Emerging Opportunities in Molybdenum Disulfide Industry
Emerging opportunities for MoS2 are vast. The growing demand for energy storage solutions opens doors for MoS2-based battery materials. Advances in nanotechnology are enabling the creation of novel MoS2-based composites with enhanced properties for various applications. Exploration of MoS2 in new fields like biomedical applications presents a promising avenue for expansion. Lastly, the increasing focus on sustainability is driving demand for environmentally friendly lubricants and coatings made from MoS2.
Leading Players in the Molybdenum Disulfide Industry Market
- Tribotecc
- Merck KGaA
- American Elements
- Jinduicheng Molybdenum Co Ltd
- Rose Mill Co
- Advanced Engineering Materials Limited
- Songxian Exploiter Molybdenum Co
- Freeport-McMoRan
- Moly metal LLP
- Luoyang Shenyu Molybdenum Co Ltd
- Grupo Mexico
Key Developments in Molybdenum Disulfide Industry Industry
- December 2022: Researchers at KAUST and Aramco announced the development of a three-dimensional molybdenum disulfide foam with a structural hierarchy spanning seven orders of magnitude. This innovation offers significant advancements in electrochemical applications due to its enhanced charge transfer and ion diffusion capabilities, along with its mechanical and chemical robustness. This breakthrough has the potential to significantly impact energy storage and related technologies.
Future Outlook for Molybdenum Disulfide Industry Market
The molybdenum disulfide market is poised for continued growth, driven by ongoing technological advancements and expanding applications across diverse sectors. The development of novel MoS2-based materials and the increasing demand for sustainable solutions will create significant opportunities for market expansion. Strategic partnerships and collaborations among industry players will further accelerate growth and innovation. The market’s future hinges on effectively addressing the challenges related to supply chain stability and competitive pressures.
Molybdenum Disulfide Industry Segmentation
-
1. Type
- 1.1. Molybdenum Disulfide (MoS2) Powder
- 1.2. Molybdenum Disulfide (MoS2) Crystals
-
2. Application
- 2.1. Lubricants and Coatings
- 2.2. Semiconductor
- 2.3. Catalysts
- 2.4. Other Applications
-
3. End-user Industry
- 3.1. Automotive
- 3.2. Aerospace and Defense
- 3.3. Electrical and Electronics
- 3.4. Construction
- 3.5. Chemical and Petrochemical
- 3.6. Other En
Molybdenum Disulfide Industry Segmentation By Geography
-
1. Asia Pacific
- 1.1. China
- 1.2. India
- 1.3. Japan
- 1.4. South Korea
- 1.5. Rest of Asia Pacific
-
2. North America
- 2.1. United States
- 2.2. Canada
- 2.3. Mexico
-
3. Europe
- 3.1. Germany
- 3.2. United Kingdom
- 3.3. Italy
- 3.4. France
- 3.5. Rest of Europe
-
4. South America
- 4.1. Brazil
- 4.2. Argentina
- 4.3. Rest of South America
-
5. Middle East and Africa
- 5.1. Saudi Arabia
- 5.2. South Africa
- 5.3. Rest of Middle East and Africa
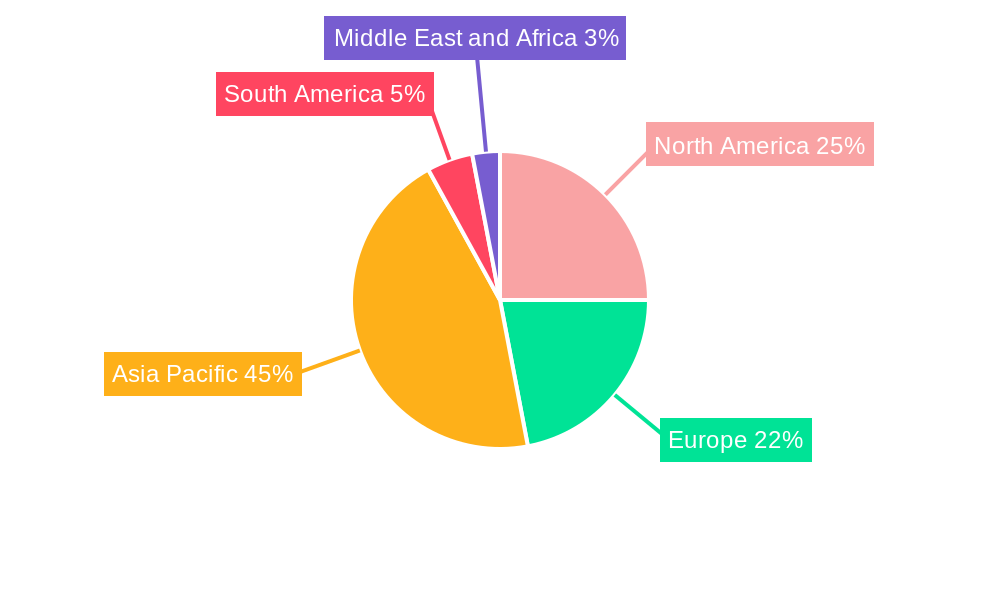
Molybdenum Disulfide Industry Regional Market Share
Geographic Coverage of Molybdenum Disulfide Industry
Molybdenum Disulfide Industry REPORT HIGHLIGHTS
| Aspects | Details |
|---|---|
| Study Period | 2020-2034 |
| Base Year | 2025 |
| Estimated Year | 2026 |
| Forecast Period | 2026-2034 |
| Historical Period | 2020-2025 |
| Growth Rate | CAGR of 4.7% from 2020-2034 |
| Segmentation |
|
Table of Contents
- 1. Introduction
- 1.1. Research Scope
- 1.2. Market Segmentation
- 1.3. Research Objective
- 1.4. Definitions and Assumptions
- 2. Executive Summary
- 2.1. Market Snapshot
- 3. Market Dynamics
- 3.1. Market Drivers
- 3.2. Market Restrains
- 3.3. Market Trends
- 3.4. Market Opportunities
- 4. Market Factor Analysis
- 4.1. Porters Five Forces
- 4.1.1. Bargaining Power of Suppliers
- 4.1.2. Bargaining Power of Buyers
- 4.1.3. Threat of New Entrants
- 4.1.4. Threat of Substitutes
- 4.1.5. Competitive Rivalry
- 4.2. PESTEL analysis
- 4.3. BCG Analysis
- 4.3.1. Stars (High Growth, High Market Share)
- 4.3.2. Cash Cows (Low Growth, High Market Share)
- 4.3.3. Question Mark (High Growth, Low Market Share)
- 4.3.4. Dogs (Low Growth, Low Market Share)
- 4.4. Ansoff Matrix Analysis
- 4.5. Supply Chain Analysis
- 4.6. Regulatory Landscape
- 4.7. Current Market Potential and Opportunity Assessment (TAM–SAM–SOM Framework)
- 4.8. PRI Analyst Note
- 4.1. Porters Five Forces
- 5. Market Analysis, Insights and Forecast 2021-2033
- 5.1. Market Analysis, Insights and Forecast - by Type
- 5.1.1. Molybdenum Disulfide (MoS2) Powder
- 5.1.2. Molybdenum Disulfide (MoS2) Crystals
- 5.2. Market Analysis, Insights and Forecast - by Application
- 5.2.1. Lubricants and Coatings
- 5.2.2. Semiconductor
- 5.2.3. Catalysts
- 5.2.4. Other Applications
- 5.3. Market Analysis, Insights and Forecast - by End-user Industry
- 5.3.1. Automotive
- 5.3.2. Aerospace and Defense
- 5.3.3. Electrical and Electronics
- 5.3.4. Construction
- 5.3.5. Chemical and Petrochemical
- 5.3.6. Other En
- 5.4. Market Analysis, Insights and Forecast - by Region
- 5.4.1. Asia Pacific
- 5.4.2. North America
- 5.4.3. Europe
- 5.4.4. South America
- 5.4.5. Middle East and Africa
- 5.1. Market Analysis, Insights and Forecast - by Type
- 6. Global Molybdenum Disulfide Industry Analysis, Insights and Forecast, 2021-2033
- 6.1. Market Analysis, Insights and Forecast - by Type
- 6.1.1. Molybdenum Disulfide (MoS2) Powder
- 6.1.2. Molybdenum Disulfide (MoS2) Crystals
- 6.2. Market Analysis, Insights and Forecast - by Application
- 6.2.1. Lubricants and Coatings
- 6.2.2. Semiconductor
- 6.2.3. Catalysts
- 6.2.4. Other Applications
- 6.3. Market Analysis, Insights and Forecast - by End-user Industry
- 6.3.1. Automotive
- 6.3.2. Aerospace and Defense
- 6.3.3. Electrical and Electronics
- 6.3.4. Construction
- 6.3.5. Chemical and Petrochemical
- 6.3.6. Other En
- 6.1. Market Analysis, Insights and Forecast - by Type
- 7. Asia Pacific Molybdenum Disulfide Industry Analysis, Insights and Forecast, 2020-2032
- 7.1. Market Analysis, Insights and Forecast - by Type
- 7.1.1. Molybdenum Disulfide (MoS2) Powder
- 7.1.2. Molybdenum Disulfide (MoS2) Crystals
- 7.2. Market Analysis, Insights and Forecast - by Application
- 7.2.1. Lubricants and Coatings
- 7.2.2. Semiconductor
- 7.2.3. Catalysts
- 7.2.4. Other Applications
- 7.3. Market Analysis, Insights and Forecast - by End-user Industry
- 7.3.1. Automotive
- 7.3.2. Aerospace and Defense
- 7.3.3. Electrical and Electronics
- 7.3.4. Construction
- 7.3.5. Chemical and Petrochemical
- 7.3.6. Other En
- 7.1. Market Analysis, Insights and Forecast - by Type
- 8. North America Molybdenum Disulfide Industry Analysis, Insights and Forecast, 2020-2032
- 8.1. Market Analysis, Insights and Forecast - by Type
- 8.1.1. Molybdenum Disulfide (MoS2) Powder
- 8.1.2. Molybdenum Disulfide (MoS2) Crystals
- 8.2. Market Analysis, Insights and Forecast - by Application
- 8.2.1. Lubricants and Coatings
- 8.2.2. Semiconductor
- 8.2.3. Catalysts
- 8.2.4. Other Applications
- 8.3. Market Analysis, Insights and Forecast - by End-user Industry
- 8.3.1. Automotive
- 8.3.2. Aerospace and Defense
- 8.3.3. Electrical and Electronics
- 8.3.4. Construction
- 8.3.5. Chemical and Petrochemical
- 8.3.6. Other En
- 8.1. Market Analysis, Insights and Forecast - by Type
- 9. Europe Molybdenum Disulfide Industry Analysis, Insights and Forecast, 2020-2032
- 9.1. Market Analysis, Insights and Forecast - by Type
- 9.1.1. Molybdenum Disulfide (MoS2) Powder
- 9.1.2. Molybdenum Disulfide (MoS2) Crystals
- 9.2. Market Analysis, Insights and Forecast - by Application
- 9.2.1. Lubricants and Coatings
- 9.2.2. Semiconductor
- 9.2.3. Catalysts
- 9.2.4. Other Applications
- 9.3. Market Analysis, Insights and Forecast - by End-user Industry
- 9.3.1. Automotive
- 9.3.2. Aerospace and Defense
- 9.3.3. Electrical and Electronics
- 9.3.4. Construction
- 9.3.5. Chemical and Petrochemical
- 9.3.6. Other En
- 9.1. Market Analysis, Insights and Forecast - by Type
- 10. South America Molybdenum Disulfide Industry Analysis, Insights and Forecast, 2020-2032
- 10.1. Market Analysis, Insights and Forecast - by Type
- 10.1.1. Molybdenum Disulfide (MoS2) Powder
- 10.1.2. Molybdenum Disulfide (MoS2) Crystals
- 10.2. Market Analysis, Insights and Forecast - by Application
- 10.2.1. Lubricants and Coatings
- 10.2.2. Semiconductor
- 10.2.3. Catalysts
- 10.2.4. Other Applications
- 10.3. Market Analysis, Insights and Forecast - by End-user Industry
- 10.3.1. Automotive
- 10.3.2. Aerospace and Defense
- 10.3.3. Electrical and Electronics
- 10.3.4. Construction
- 10.3.5. Chemical and Petrochemical
- 10.3.6. Other En
- 10.1. Market Analysis, Insights and Forecast - by Type
- 11. Middle East and Africa Molybdenum Disulfide Industry Analysis, Insights and Forecast, 2020-2032
- 11.1. Market Analysis, Insights and Forecast - by Type
- 11.1.1. Molybdenum Disulfide (MoS2) Powder
- 11.1.2. Molybdenum Disulfide (MoS2) Crystals
- 11.2. Market Analysis, Insights and Forecast - by Application
- 11.2.1. Lubricants and Coatings
- 11.2.2. Semiconductor
- 11.2.3. Catalysts
- 11.2.4. Other Applications
- 11.3. Market Analysis, Insights and Forecast - by End-user Industry
- 11.3.1. Automotive
- 11.3.2. Aerospace and Defense
- 11.3.3. Electrical and Electronics
- 11.3.4. Construction
- 11.3.5. Chemical and Petrochemical
- 11.3.6. Other En
- 11.1. Market Analysis, Insights and Forecast - by Type
- 12. Competitive Analysis
- 12.1. Company Profiles
- 12.1.1 Tribotecc*List Not Exhaustive
- 12.1.1.1. Company Overview
- 12.1.1.2. Products
- 12.1.1.3. Company Financials
- 12.1.1.4. SWOT Analysis
- 12.1.2 Merck KGaA
- 12.1.2.1. Company Overview
- 12.1.2.2. Products
- 12.1.2.3. Company Financials
- 12.1.2.4. SWOT Analysis
- 12.1.3 American Elements
- 12.1.3.1. Company Overview
- 12.1.3.2. Products
- 12.1.3.3. Company Financials
- 12.1.3.4. SWOT Analysis
- 12.1.4 Jinduicheng Molybdenum Co Ltd
- 12.1.4.1. Company Overview
- 12.1.4.2. Products
- 12.1.4.3. Company Financials
- 12.1.4.4. SWOT Analysis
- 12.1.5 Rose Mill Co
- 12.1.5.1. Company Overview
- 12.1.5.2. Products
- 12.1.5.3. Company Financials
- 12.1.5.4. SWOT Analysis
- 12.1.6 Advanced Engineering Materials Limited
- 12.1.6.1. Company Overview
- 12.1.6.2. Products
- 12.1.6.3. Company Financials
- 12.1.6.4. SWOT Analysis
- 12.1.7 Songxian Exploiter Molybdenum Co
- 12.1.7.1. Company Overview
- 12.1.7.2. Products
- 12.1.7.3. Company Financials
- 12.1.7.4. SWOT Analysis
- 12.1.8 Freeport-McMoRan
- 12.1.8.1. Company Overview
- 12.1.8.2. Products
- 12.1.8.3. Company Financials
- 12.1.8.4. SWOT Analysis
- 12.1.9 Moly metal LLP
- 12.1.9.1. Company Overview
- 12.1.9.2. Products
- 12.1.9.3. Company Financials
- 12.1.9.4. SWOT Analysis
- 12.1.10 Luoyang Shenyu Molybdenum Co Ltd
- 12.1.10.1. Company Overview
- 12.1.10.2. Products
- 12.1.10.3. Company Financials
- 12.1.10.4. SWOT Analysis
- 12.1.11 Grupo Mexico
- 12.1.11.1. Company Overview
- 12.1.11.2. Products
- 12.1.11.3. Company Financials
- 12.1.11.4. SWOT Analysis
- 12.1.1 Tribotecc*List Not Exhaustive
- 12.2. Market Entropy
- 12.2.1 Company's Key Areas Served
- 12.2.2 Recent Developments
- 12.3. Company Market Share Analysis 2025
- 12.3.1 Top 5 Companies Market Share Analysis
- 12.3.2 Top 3 Companies Market Share Analysis
- 12.4. List of Potential Customers
- 13. Research Methodology
List of Figures
- Figure 1: Global Molybdenum Disulfide Industry Revenue Breakdown (billion, %) by Region 2025 & 2033
- Figure 2: Global Molybdenum Disulfide Industry Volume Breakdown (kilotons, %) by Region 2025 & 2033
- Figure 3: Asia Pacific Molybdenum Disulfide Industry Revenue (billion), by Type 2025 & 2033
- Figure 4: Asia Pacific Molybdenum Disulfide Industry Volume (kilotons), by Type 2025 & 2033
- Figure 5: Asia Pacific Molybdenum Disulfide Industry Revenue Share (%), by Type 2025 & 2033
- Figure 6: Asia Pacific Molybdenum Disulfide Industry Volume Share (%), by Type 2025 & 2033
- Figure 7: Asia Pacific Molybdenum Disulfide Industry Revenue (billion), by Application 2025 & 2033
- Figure 8: Asia Pacific Molybdenum Disulfide Industry Volume (kilotons), by Application 2025 & 2033
- Figure 9: Asia Pacific Molybdenum Disulfide Industry Revenue Share (%), by Application 2025 & 2033
- Figure 10: Asia Pacific Molybdenum Disulfide Industry Volume Share (%), by Application 2025 & 2033
- Figure 11: Asia Pacific Molybdenum Disulfide Industry Revenue (billion), by End-user Industry 2025 & 2033
- Figure 12: Asia Pacific Molybdenum Disulfide Industry Volume (kilotons), by End-user Industry 2025 & 2033
- Figure 13: Asia Pacific Molybdenum Disulfide Industry Revenue Share (%), by End-user Industry 2025 & 2033
- Figure 14: Asia Pacific Molybdenum Disulfide Industry Volume Share (%), by End-user Industry 2025 & 2033
- Figure 15: Asia Pacific Molybdenum Disulfide Industry Revenue (billion), by Country 2025 & 2033
- Figure 16: Asia Pacific Molybdenum Disulfide Industry Volume (kilotons), by Country 2025 & 2033
- Figure 17: Asia Pacific Molybdenum Disulfide Industry Revenue Share (%), by Country 2025 & 2033
- Figure 18: Asia Pacific Molybdenum Disulfide Industry Volume Share (%), by Country 2025 & 2033
- Figure 19: North America Molybdenum Disulfide Industry Revenue (billion), by Type 2025 & 2033
- Figure 20: North America Molybdenum Disulfide Industry Volume (kilotons), by Type 2025 & 2033
- Figure 21: North America Molybdenum Disulfide Industry Revenue Share (%), by Type 2025 & 2033
- Figure 22: North America Molybdenum Disulfide Industry Volume Share (%), by Type 2025 & 2033
- Figure 23: North America Molybdenum Disulfide Industry Revenue (billion), by Application 2025 & 2033
- Figure 24: North America Molybdenum Disulfide Industry Volume (kilotons), by Application 2025 & 2033
- Figure 25: North America Molybdenum Disulfide Industry Revenue Share (%), by Application 2025 & 2033
- Figure 26: North America Molybdenum Disulfide Industry Volume Share (%), by Application 2025 & 2033
- Figure 27: North America Molybdenum Disulfide Industry Revenue (billion), by End-user Industry 2025 & 2033
- Figure 28: North America Molybdenum Disulfide Industry Volume (kilotons), by End-user Industry 2025 & 2033
- Figure 29: North America Molybdenum Disulfide Industry Revenue Share (%), by End-user Industry 2025 & 2033
- Figure 30: North America Molybdenum Disulfide Industry Volume Share (%), by End-user Industry 2025 & 2033
- Figure 31: North America Molybdenum Disulfide Industry Revenue (billion), by Country 2025 & 2033
- Figure 32: North America Molybdenum Disulfide Industry Volume (kilotons), by Country 2025 & 2033
- Figure 33: North America Molybdenum Disulfide Industry Revenue Share (%), by Country 2025 & 2033
- Figure 34: North America Molybdenum Disulfide Industry Volume Share (%), by Country 2025 & 2033
- Figure 35: Europe Molybdenum Disulfide Industry Revenue (billion), by Type 2025 & 2033
- Figure 36: Europe Molybdenum Disulfide Industry Volume (kilotons), by Type 2025 & 2033
- Figure 37: Europe Molybdenum Disulfide Industry Revenue Share (%), by Type 2025 & 2033
- Figure 38: Europe Molybdenum Disulfide Industry Volume Share (%), by Type 2025 & 2033
- Figure 39: Europe Molybdenum Disulfide Industry Revenue (billion), by Application 2025 & 2033
- Figure 40: Europe Molybdenum Disulfide Industry Volume (kilotons), by Application 2025 & 2033
- Figure 41: Europe Molybdenum Disulfide Industry Revenue Share (%), by Application 2025 & 2033
- Figure 42: Europe Molybdenum Disulfide Industry Volume Share (%), by Application 2025 & 2033
- Figure 43: Europe Molybdenum Disulfide Industry Revenue (billion), by End-user Industry 2025 & 2033
- Figure 44: Europe Molybdenum Disulfide Industry Volume (kilotons), by End-user Industry 2025 & 2033
- Figure 45: Europe Molybdenum Disulfide Industry Revenue Share (%), by End-user Industry 2025 & 2033
- Figure 46: Europe Molybdenum Disulfide Industry Volume Share (%), by End-user Industry 2025 & 2033
- Figure 47: Europe Molybdenum Disulfide Industry Revenue (billion), by Country 2025 & 2033
- Figure 48: Europe Molybdenum Disulfide Industry Volume (kilotons), by Country 2025 & 2033
- Figure 49: Europe Molybdenum Disulfide Industry Revenue Share (%), by Country 2025 & 2033
- Figure 50: Europe Molybdenum Disulfide Industry Volume Share (%), by Country 2025 & 2033
- Figure 51: South America Molybdenum Disulfide Industry Revenue (billion), by Type 2025 & 2033
- Figure 52: South America Molybdenum Disulfide Industry Volume (kilotons), by Type 2025 & 2033
- Figure 53: South America Molybdenum Disulfide Industry Revenue Share (%), by Type 2025 & 2033
- Figure 54: South America Molybdenum Disulfide Industry Volume Share (%), by Type 2025 & 2033
- Figure 55: South America Molybdenum Disulfide Industry Revenue (billion), by Application 2025 & 2033
- Figure 56: South America Molybdenum Disulfide Industry Volume (kilotons), by Application 2025 & 2033
- Figure 57: South America Molybdenum Disulfide Industry Revenue Share (%), by Application 2025 & 2033
- Figure 58: South America Molybdenum Disulfide Industry Volume Share (%), by Application 2025 & 2033
- Figure 59: South America Molybdenum Disulfide Industry Revenue (billion), by End-user Industry 2025 & 2033
- Figure 60: South America Molybdenum Disulfide Industry Volume (kilotons), by End-user Industry 2025 & 2033
- Figure 61: South America Molybdenum Disulfide Industry Revenue Share (%), by End-user Industry 2025 & 2033
- Figure 62: South America Molybdenum Disulfide Industry Volume Share (%), by End-user Industry 2025 & 2033
- Figure 63: South America Molybdenum Disulfide Industry Revenue (billion), by Country 2025 & 2033
- Figure 64: South America Molybdenum Disulfide Industry Volume (kilotons), by Country 2025 & 2033
- Figure 65: South America Molybdenum Disulfide Industry Revenue Share (%), by Country 2025 & 2033
- Figure 66: South America Molybdenum Disulfide Industry Volume Share (%), by Country 2025 & 2033
- Figure 67: Middle East and Africa Molybdenum Disulfide Industry Revenue (billion), by Type 2025 & 2033
- Figure 68: Middle East and Africa Molybdenum Disulfide Industry Volume (kilotons), by Type 2025 & 2033
- Figure 69: Middle East and Africa Molybdenum Disulfide Industry Revenue Share (%), by Type 2025 & 2033
- Figure 70: Middle East and Africa Molybdenum Disulfide Industry Volume Share (%), by Type 2025 & 2033
- Figure 71: Middle East and Africa Molybdenum Disulfide Industry Revenue (billion), by Application 2025 & 2033
- Figure 72: Middle East and Africa Molybdenum Disulfide Industry Volume (kilotons), by Application 2025 & 2033
- Figure 73: Middle East and Africa Molybdenum Disulfide Industry Revenue Share (%), by Application 2025 & 2033
- Figure 74: Middle East and Africa Molybdenum Disulfide Industry Volume Share (%), by Application 2025 & 2033
- Figure 75: Middle East and Africa Molybdenum Disulfide Industry Revenue (billion), by End-user Industry 2025 & 2033
- Figure 76: Middle East and Africa Molybdenum Disulfide Industry Volume (kilotons), by End-user Industry 2025 & 2033
- Figure 77: Middle East and Africa Molybdenum Disulfide Industry Revenue Share (%), by End-user Industry 2025 & 2033
- Figure 78: Middle East and Africa Molybdenum Disulfide Industry Volume Share (%), by End-user Industry 2025 & 2033
- Figure 79: Middle East and Africa Molybdenum Disulfide Industry Revenue (billion), by Country 2025 & 2033
- Figure 80: Middle East and Africa Molybdenum Disulfide Industry Volume (kilotons), by Country 2025 & 2033
- Figure 81: Middle East and Africa Molybdenum Disulfide Industry Revenue Share (%), by Country 2025 & 2033
- Figure 82: Middle East and Africa Molybdenum Disulfide Industry Volume Share (%), by Country 2025 & 2033
List of Tables
- Table 1: Global Molybdenum Disulfide Industry Revenue billion Forecast, by Type 2020 & 2033
- Table 2: Global Molybdenum Disulfide Industry Volume kilotons Forecast, by Type 2020 & 2033
- Table 3: Global Molybdenum Disulfide Industry Revenue billion Forecast, by Application 2020 & 2033
- Table 4: Global Molybdenum Disulfide Industry Volume kilotons Forecast, by Application 2020 & 2033
- Table 5: Global Molybdenum Disulfide Industry Revenue billion Forecast, by End-user Industry 2020 & 2033
- Table 6: Global Molybdenum Disulfide Industry Volume kilotons Forecast, by End-user Industry 2020 & 2033
- Table 7: Global Molybdenum Disulfide Industry Revenue billion Forecast, by Region 2020 & 2033
- Table 8: Global Molybdenum Disulfide Industry Volume kilotons Forecast, by Region 2020 & 2033
- Table 9: Global Molybdenum Disulfide Industry Revenue billion Forecast, by Type 2020 & 2033
- Table 10: Global Molybdenum Disulfide Industry Volume kilotons Forecast, by Type 2020 & 2033
- Table 11: Global Molybdenum Disulfide Industry Revenue billion Forecast, by Application 2020 & 2033
- Table 12: Global Molybdenum Disulfide Industry Volume kilotons Forecast, by Application 2020 & 2033
- Table 13: Global Molybdenum Disulfide Industry Revenue billion Forecast, by End-user Industry 2020 & 2033
- Table 14: Global Molybdenum Disulfide Industry Volume kilotons Forecast, by End-user Industry 2020 & 2033
- Table 15: Global Molybdenum Disulfide Industry Revenue billion Forecast, by Country 2020 & 2033
- Table 16: Global Molybdenum Disulfide Industry Volume kilotons Forecast, by Country 2020 & 2033
- Table 17: China Molybdenum Disulfide Industry Revenue (billion) Forecast, by Application 2020 & 2033
- Table 18: China Molybdenum Disulfide Industry Volume (kilotons) Forecast, by Application 2020 & 2033
- Table 19: India Molybdenum Disulfide Industry Revenue (billion) Forecast, by Application 2020 & 2033
- Table 20: India Molybdenum Disulfide Industry Volume (kilotons) Forecast, by Application 2020 & 2033
- Table 21: Japan Molybdenum Disulfide Industry Revenue (billion) Forecast, by Application 2020 & 2033
- Table 22: Japan Molybdenum Disulfide Industry Volume (kilotons) Forecast, by Application 2020 & 2033
- Table 23: South Korea Molybdenum Disulfide Industry Revenue (billion) Forecast, by Application 2020 & 2033
- Table 24: South Korea Molybdenum Disulfide Industry Volume (kilotons) Forecast, by Application 2020 & 2033
- Table 25: Rest of Asia Pacific Molybdenum Disulfide Industry Revenue (billion) Forecast, by Application 2020 & 2033
- Table 26: Rest of Asia Pacific Molybdenum Disulfide Industry Volume (kilotons) Forecast, by Application 2020 & 2033
- Table 27: Global Molybdenum Disulfide Industry Revenue billion Forecast, by Type 2020 & 2033
- Table 28: Global Molybdenum Disulfide Industry Volume kilotons Forecast, by Type 2020 & 2033
- Table 29: Global Molybdenum Disulfide Industry Revenue billion Forecast, by Application 2020 & 2033
- Table 30: Global Molybdenum Disulfide Industry Volume kilotons Forecast, by Application 2020 & 2033
- Table 31: Global Molybdenum Disulfide Industry Revenue billion Forecast, by End-user Industry 2020 & 2033
- Table 32: Global Molybdenum Disulfide Industry Volume kilotons Forecast, by End-user Industry 2020 & 2033
- Table 33: Global Molybdenum Disulfide Industry Revenue billion Forecast, by Country 2020 & 2033
- Table 34: Global Molybdenum Disulfide Industry Volume kilotons Forecast, by Country 2020 & 2033
- Table 35: United States Molybdenum Disulfide Industry Revenue (billion) Forecast, by Application 2020 & 2033
- Table 36: United States Molybdenum Disulfide Industry Volume (kilotons) Forecast, by Application 2020 & 2033
- Table 37: Canada Molybdenum Disulfide Industry Revenue (billion) Forecast, by Application 2020 & 2033
- Table 38: Canada Molybdenum Disulfide Industry Volume (kilotons) Forecast, by Application 2020 & 2033
- Table 39: Mexico Molybdenum Disulfide Industry Revenue (billion) Forecast, by Application 2020 & 2033
- Table 40: Mexico Molybdenum Disulfide Industry Volume (kilotons) Forecast, by Application 2020 & 2033
- Table 41: Global Molybdenum Disulfide Industry Revenue billion Forecast, by Type 2020 & 2033
- Table 42: Global Molybdenum Disulfide Industry Volume kilotons Forecast, by Type 2020 & 2033
- Table 43: Global Molybdenum Disulfide Industry Revenue billion Forecast, by Application 2020 & 2033
- Table 44: Global Molybdenum Disulfide Industry Volume kilotons Forecast, by Application 2020 & 2033
- Table 45: Global Molybdenum Disulfide Industry Revenue billion Forecast, by End-user Industry 2020 & 2033
- Table 46: Global Molybdenum Disulfide Industry Volume kilotons Forecast, by End-user Industry 2020 & 2033
- Table 47: Global Molybdenum Disulfide Industry Revenue billion Forecast, by Country 2020 & 2033
- Table 48: Global Molybdenum Disulfide Industry Volume kilotons Forecast, by Country 2020 & 2033
- Table 49: Germany Molybdenum Disulfide Industry Revenue (billion) Forecast, by Application 2020 & 2033
- Table 50: Germany Molybdenum Disulfide Industry Volume (kilotons) Forecast, by Application 2020 & 2033
- Table 51: United Kingdom Molybdenum Disulfide Industry Revenue (billion) Forecast, by Application 2020 & 2033
- Table 52: United Kingdom Molybdenum Disulfide Industry Volume (kilotons) Forecast, by Application 2020 & 2033
- Table 53: Italy Molybdenum Disulfide Industry Revenue (billion) Forecast, by Application 2020 & 2033
- Table 54: Italy Molybdenum Disulfide Industry Volume (kilotons) Forecast, by Application 2020 & 2033
- Table 55: France Molybdenum Disulfide Industry Revenue (billion) Forecast, by Application 2020 & 2033
- Table 56: France Molybdenum Disulfide Industry Volume (kilotons) Forecast, by Application 2020 & 2033
- Table 57: Rest of Europe Molybdenum Disulfide Industry Revenue (billion) Forecast, by Application 2020 & 2033
- Table 58: Rest of Europe Molybdenum Disulfide Industry Volume (kilotons) Forecast, by Application 2020 & 2033
- Table 59: Global Molybdenum Disulfide Industry Revenue billion Forecast, by Type 2020 & 2033
- Table 60: Global Molybdenum Disulfide Industry Volume kilotons Forecast, by Type 2020 & 2033
- Table 61: Global Molybdenum Disulfide Industry Revenue billion Forecast, by Application 2020 & 2033
- Table 62: Global Molybdenum Disulfide Industry Volume kilotons Forecast, by Application 2020 & 2033
- Table 63: Global Molybdenum Disulfide Industry Revenue billion Forecast, by End-user Industry 2020 & 2033
- Table 64: Global Molybdenum Disulfide Industry Volume kilotons Forecast, by End-user Industry 2020 & 2033
- Table 65: Global Molybdenum Disulfide Industry Revenue billion Forecast, by Country 2020 & 2033
- Table 66: Global Molybdenum Disulfide Industry Volume kilotons Forecast, by Country 2020 & 2033
- Table 67: Brazil Molybdenum Disulfide Industry Revenue (billion) Forecast, by Application 2020 & 2033
- Table 68: Brazil Molybdenum Disulfide Industry Volume (kilotons) Forecast, by Application 2020 & 2033
- Table 69: Argentina Molybdenum Disulfide Industry Revenue (billion) Forecast, by Application 2020 & 2033
- Table 70: Argentina Molybdenum Disulfide Industry Volume (kilotons) Forecast, by Application 2020 & 2033
- Table 71: Rest of South America Molybdenum Disulfide Industry Revenue (billion) Forecast, by Application 2020 & 2033
- Table 72: Rest of South America Molybdenum Disulfide Industry Volume (kilotons) Forecast, by Application 2020 & 2033
- Table 73: Global Molybdenum Disulfide Industry Revenue billion Forecast, by Type 2020 & 2033
- Table 74: Global Molybdenum Disulfide Industry Volume kilotons Forecast, by Type 2020 & 2033
- Table 75: Global Molybdenum Disulfide Industry Revenue billion Forecast, by Application 2020 & 2033
- Table 76: Global Molybdenum Disulfide Industry Volume kilotons Forecast, by Application 2020 & 2033
- Table 77: Global Molybdenum Disulfide Industry Revenue billion Forecast, by End-user Industry 2020 & 2033
- Table 78: Global Molybdenum Disulfide Industry Volume kilotons Forecast, by End-user Industry 2020 & 2033
- Table 79: Global Molybdenum Disulfide Industry Revenue billion Forecast, by Country 2020 & 2033
- Table 80: Global Molybdenum Disulfide Industry Volume kilotons Forecast, by Country 2020 & 2033
- Table 81: Saudi Arabia Molybdenum Disulfide Industry Revenue (billion) Forecast, by Application 2020 & 2033
- Table 82: Saudi Arabia Molybdenum Disulfide Industry Volume (kilotons) Forecast, by Application 2020 & 2033
- Table 83: South Africa Molybdenum Disulfide Industry Revenue (billion) Forecast, by Application 2020 & 2033
- Table 84: South Africa Molybdenum Disulfide Industry Volume (kilotons) Forecast, by Application 2020 & 2033
- Table 85: Rest of Middle East and Africa Molybdenum Disulfide Industry Revenue (billion) Forecast, by Application 2020 & 2033
- Table 86: Rest of Middle East and Africa Molybdenum Disulfide Industry Volume (kilotons) Forecast, by Application 2020 & 2033
Frequently Asked Questions
1. What is the projected Compound Annual Growth Rate (CAGR) of the Molybdenum Disulfide Industry?
The projected CAGR is approximately 4.7%.
2. Which companies are prominent players in the Molybdenum Disulfide Industry?
Key companies in the market include Tribotecc*List Not Exhaustive, Merck KGaA, American Elements, Jinduicheng Molybdenum Co Ltd, Rose Mill Co, Advanced Engineering Materials Limited, Songxian Exploiter Molybdenum Co, Freeport-McMoRan, Moly metal LLP, Luoyang Shenyu Molybdenum Co Ltd, Grupo Mexico.
3. What are the main segments of the Molybdenum Disulfide Industry?
The market segments include Type, Application, End-user Industry.
4. Can you provide details about the market size?
The market size is estimated to be USD 0.9 billion as of 2022.
5. What are some drivers contributing to market growth?
Growing Application of Lubricants in Various End-use Industries; Increasing Demand from Automotive Industries; Growing Utilization in LEDs. Lasers and other Electronic Industry Applications.
6. What are the notable trends driving market growth?
Automotive Segment to Dominate the Market.
7. Are there any restraints impacting market growth?
Availability of Better Alternatives; Other Restraints.
8. Can you provide examples of recent developments in the market?
December 2022: Researchers at KAUST and Aramco made an announcement regarding the development of a three-dimensional molybdenum disulfide foam with a structural hierarchy spanning seven orders of magnitude. This foam forms an interpenetrating network that facilitates efficient charge transfer, and fast ion diffusion and provides mechanically and chemically robust support for electrochemical processes.
9. What pricing options are available for accessing the report?
Pricing options include single-user, multi-user, and enterprise licenses priced at USD 4750, USD 5250, and USD 8750 respectively.
10. Is the market size provided in terms of value or volume?
The market size is provided in terms of value, measured in billion and volume, measured in kilotons.
11. Are there any specific market keywords associated with the report?
Yes, the market keyword associated with the report is "Molybdenum Disulfide Industry," which aids in identifying and referencing the specific market segment covered.
12. How do I determine which pricing option suits my needs best?
The pricing options vary based on user requirements and access needs. Individual users may opt for single-user licenses, while businesses requiring broader access may choose multi-user or enterprise licenses for cost-effective access to the report.
13. Are there any additional resources or data provided in the Molybdenum Disulfide Industry report?
While the report offers comprehensive insights, it's advisable to review the specific contents or supplementary materials provided to ascertain if additional resources or data are available.
14. How can I stay updated on further developments or reports in the Molybdenum Disulfide Industry?
To stay informed about further developments, trends, and reports in the Molybdenum Disulfide Industry, consider subscribing to industry newsletters, following relevant companies and organizations, or regularly checking reputable industry news sources and publications.
Methodology
Step 1 - Identification of Relevant Samples Size from Population Database


Step 2 - Approaches for Defining Global Market Size (Value, Volume* & Price*)

Note*: In applicable scenarios
Step 3 - Data Sources
Primary Research
- Web Analytics
- Survey Reports
- Research Institute
- Latest Research Reports
- Opinion Leaders
Secondary Research
- Annual Reports
- White Paper
- Latest Press Release
- Industry Association
- Paid Database
- Investor Presentations

Step 4 - Data Triangulation
Involves using different sources of information in order to increase the validity of a study
These sources are likely to be stakeholders in a program - participants, other researchers, program staff, other community members, and so on.
Then we put all data in single framework & apply various statistical tools to find out the dynamic on the market.
During the analysis stage, feedback from the stakeholder groups would be compared to determine areas of agreement as well as areas of divergence