

Key Insights
The monoclonal antibody therapy market is experiencing substantial expansion, driven by the increasing global incidence of chronic conditions including cancer, autoimmune disorders, and hematological malignancies. This dynamic sector is projected for significant growth, with a projected Compound Annual Growth Rate (CAGR) of 16.24% through 2033. Key growth drivers include the continuous development of novel, targeted therapies, increased investment in research and development by leading pharmaceutical firms, and rising awareness of treatment efficacy and safety among healthcare professionals and patients. The market is segmented by application (hematological diseases, autoimmune diseases, cancer), source (human, humanized, chimeric), and end-user (hospitals, clinics). Humanized monoclonal antibodies are anticipated to maintain a dominant market share owing to their superior efficacy and reduced immunogenicity. North America currently leads the market due to high healthcare expenditure and advanced infrastructure, while the Asia-Pacific region shows strong potential for growth driven by increasing healthcare investment and disease prevalence. Key industry players include Daiichi Sankyo, Boehringer Ingelheim, Merck KGaA, Novartis, Amgen, Roche, UCB, AbbVie, Johnson & Johnson, and Pfizer. Challenges encompass high treatment costs, potential side effects, and the necessity for ongoing research to enhance treatment outcomes and global accessibility.
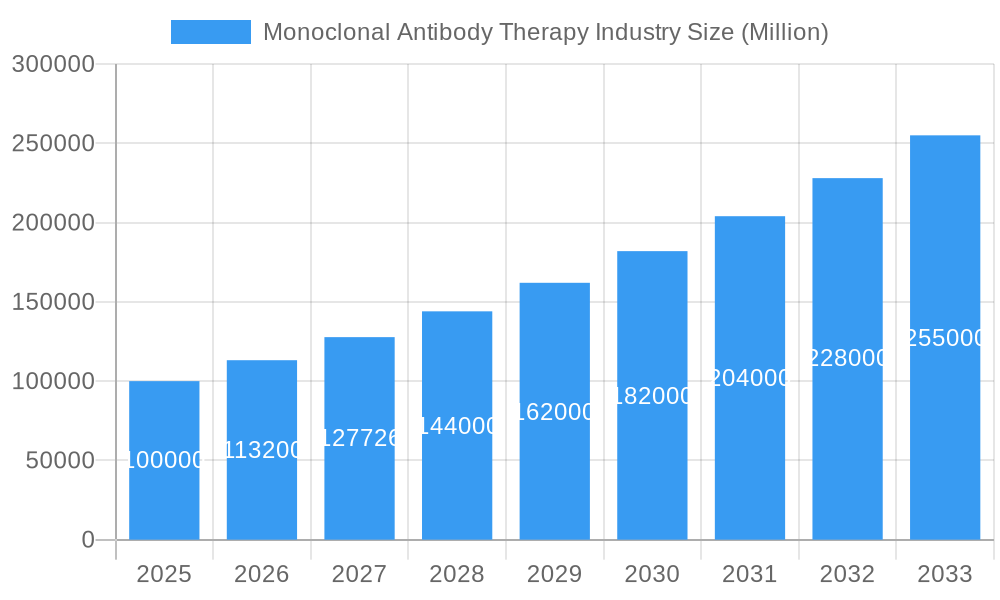
Monoclonal Antibody Therapy Industry Market Size (In Billion)
The competitive landscape is characterized by intensive R&D, strategic collaborations, and mergers and acquisitions. Companies are prioritizing the development of advanced monoclonal antibody therapies to address unmet medical needs. Favorable government initiatives and reimbursement policies are expected to further accelerate market growth. However, stringent regulatory approvals, potential drug resistance, and the demand for personalized treatment approaches may present obstacles. Nevertheless, the market outlook remains highly positive, with continuous innovation and increasing adoption of these therapies driving robust growth. With an estimated market size of $264.33 billion in 2025, the market is set for significant expansion.
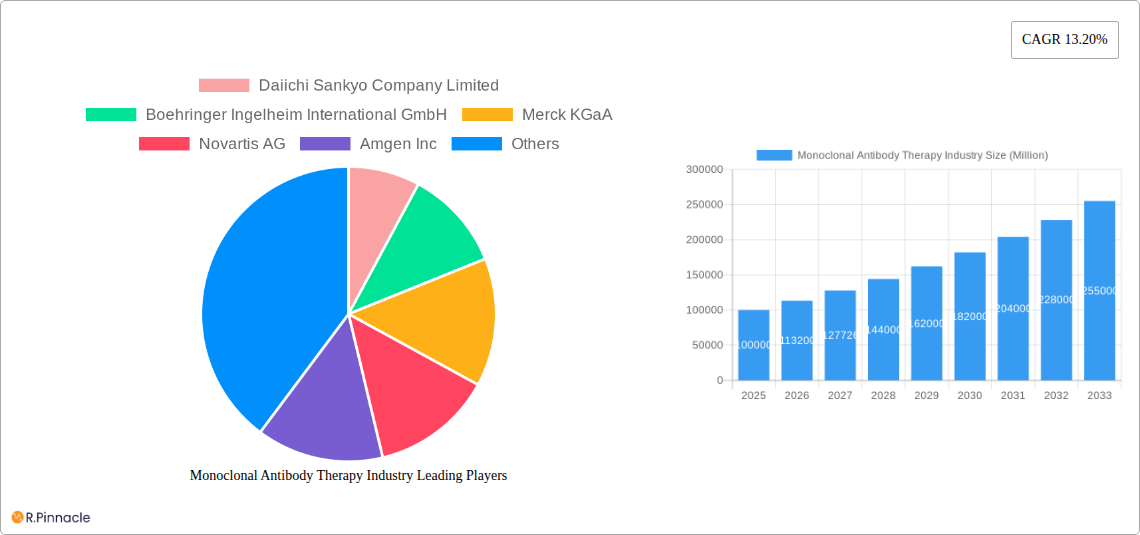
Monoclonal Antibody Therapy Industry Company Market Share
Monoclonal Antibody Therapy Industry Market Report: 2019-2033
This comprehensive report provides a detailed analysis of the Monoclonal Antibody Therapy market, offering actionable insights for industry professionals. With a study period spanning 2019-2033, a base year of 2025, and a forecast period of 2025-2033, this report is your essential guide to navigating the complexities of this rapidly evolving sector. The report covers key segments, leading players, and significant market developments, providing a complete picture of the current landscape and future projections. The market is expected to reach xx Million by 2033, showcasing substantial growth potential.
Monoclonal Antibody Therapy Industry Market Structure & Innovation Trends
The monoclonal antibody therapy market exhibits a moderately concentrated structure, with several key players holding significant market share. Daiichi Sankyo Company Limited, Boehringer Ingelheim International GmbH, Merck KGaA, Novartis AG, Amgen Inc, F Hoffmann-La Roche Ltd, UCB S A Belgium (UCB Inc), AbbVie Inc, Johnson & Johnson, and Pfizer Inc are amongst the leading companies driving innovation and competition. Market share dynamics are influenced by factors such as R&D investment, product portfolio breadth, and successful clinical trials. The industry is characterized by high R&D expenditure, focusing on novel antibody engineering techniques and targeted therapies. Regulatory frameworks, particularly those governing drug approvals and pricing, play a crucial role in shaping market dynamics. While biosimilars represent a growing substitute, the innovation pipeline continues to introduce novel monoclonal antibodies with improved efficacy and safety profiles. The market has witnessed notable M&A activities, with deal values exceeding xx Million in recent years, signifying strategic consolidation and expansion efforts. These activities are driven by the pursuit of enhanced market access, technological capabilities, and diversified product pipelines.
- Market Concentration: Moderately concentrated, with top 10 players holding approximately xx% market share (2024).
- Innovation Drivers: High R&D investment in novel antibody engineering, targeted therapies, and bioconjugates.
- Regulatory Frameworks: Stringent approval processes and pricing regulations significantly impact market access.
- Product Substitutes: Biosimilars are emerging as significant substitutes, increasing competitive pressure.
- M&A Activity: Significant M&A activity observed, with total deal value exceeding xx Million in the last five years (2019-2024).
Monoclonal Antibody Therapy Industry Market Dynamics & Trends
The global monoclonal antibody therapy market is experiencing robust growth, driven by a confluence of factors. Rising prevalence of chronic diseases such as cancer, autoimmune disorders, and hematological malignancies fuels increased demand for effective treatment options. Technological advancements in antibody engineering, such as antibody-drug conjugates (ADCs) and bispecific antibodies, enhance efficacy and therapeutic potential, further expanding the market. The increasing adoption of personalized medicine approaches, enabling tailored therapies based on individual patient characteristics, is also contributing to market expansion. Furthermore, the growing awareness of monoclonal antibody therapies among healthcare professionals and patients, coupled with supportive regulatory policies, fosters market adoption. The market is expected to experience a compound annual growth rate (CAGR) of xx% during the forecast period (2025-2033), with significant market penetration across various regions. Competitive dynamics are intense, with companies focusing on product differentiation, strategic partnerships, and aggressive market expansion strategies.
Dominant Regions & Segments in Monoclonal Antibody Therapy Industry
The North American region holds the largest market share in the monoclonal antibody therapy market, primarily driven by advanced healthcare infrastructure, high disposable incomes, and robust R&D activities. Within the application segments, cancer treatment dominates due to the high prevalence of various cancers and the significant efficacy of monoclonal antibody therapies in oncology. In terms of source, humanized monoclonal antibodies hold the largest market share owing to their improved safety profile and reduced immunogenicity compared to chimeric antibodies. Hospitals are the primary end-users, driven by their capacity for administering complex treatments and providing comprehensive patient care.
- Key Drivers in North America: Advanced healthcare infrastructure, high R&D investments, favorable regulatory environment.
- Cancer Segment Dominance: High prevalence of cancer and the significant therapeutic benefits of monoclonal antibodies.
- Humanized Antibodies: Superior safety profile and reduced immunogenicity compared to other antibody types.
- Hospitals as Primary End-Users: Capacity to administer complex treatments and provide comprehensive patient care.
Monoclonal Antibody Therapy Industry Product Innovations
Recent years have witnessed significant advancements in monoclonal antibody therapy, with a focus on improving efficacy, reducing side effects, and expanding therapeutic applications. This includes the development of novel antibody formats such as bispecific antibodies and antibody-drug conjugates (ADCs), which offer enhanced targeting and therapeutic capabilities. Technological innovations like next-generation sequencing (NGS) and AI-powered drug discovery platforms facilitate the identification and development of novel antibodies with improved properties. These innovations aim to address unmet medical needs and enhance patient outcomes, leading to increased market adoption and revenue growth.
Report Scope & Segmentation Analysis
This report segments the monoclonal antibody therapy market based on application (hematological diseases, autoimmune diseases, cancer, others), source (human, humanized, chimeric, others), and end-user (hospitals, private clinics, others). Each segment presents unique growth trajectories, market sizes, and competitive dynamics. The cancer segment is projected to exhibit the highest growth rate, driven by increasing prevalence and advancements in targeted therapies. Humanized antibodies are expected to maintain a substantial market share due to their improved safety and efficacy. Hospitals represent the largest end-user segment due to their infrastructure and expertise in administering complex treatments. Detailed growth projections for each segment are provided within the full report.
Key Drivers of Monoclonal Antibody Therapy Industry Growth
Several factors fuel the growth of the monoclonal antibody therapy market. These include the increasing prevalence of chronic diseases, technological advancements leading to improved efficacy and safety, growing adoption of personalized medicine, supportive regulatory landscapes, and rising healthcare expenditure. The development of novel antibody formats like bispecific antibodies and ADCs further enhances market potential. Furthermore, increased awareness among both healthcare professionals and patients contributes to market expansion.
Challenges in the Monoclonal Antibody Therapy Industry Sector
The monoclonal antibody therapy market faces several challenges, including high development costs, stringent regulatory requirements, complex manufacturing processes, potential for immunogenicity, and the emergence of biosimilars. These factors can impact profitability and limit market access. Supply chain disruptions can also affect the availability of raw materials and finished products. The emergence of biosimilars, while offering cost-effective alternatives, creates intense competitive pressure on original biologics.
Emerging Opportunities in Monoclonal Antibody Therapy Industry
Emerging opportunities in the monoclonal antibody therapy market include the development of novel antibody formats, the expansion into new therapeutic areas, the integration of AI-powered drug discovery platforms, and personalized medicine approaches. The development of next-generation antibody therapies targeting previously undruggable targets promises significant advances. Furthermore, exploring new delivery methods and expanding into emerging markets present significant growth potential.
Leading Players in the Monoclonal Antibody Therapy Industry Market
Key Developments in Monoclonal Antibody Therapy Industry Industry
- February 2022: The United States Food and Drug Administration (FDA) issued an Emergency Use Authorization (EUA) for bebtelovimab, an antibody demonstrating neutralization against the Omicron variant developed by Eli Lilly and Company. This highlighted the rapid response capabilities of the industry to emerging viral threats.
- September 2022: AstraZeneca's Evusheld (tixagevimab and cilgavimab, formerly AZD7442), a long-acting antibody combination, was recommended for marketing authorization in the European Union (EU) for the treatment of adults and adolescents with COVID-19 at increased risk of severe disease. This showcased advancements in long-acting antibody technologies.
Future Outlook for Monoclonal Antibody Therapy Industry Market
The future of the monoclonal antibody therapy market is promising, driven by continued technological advancements, expansion into new therapeutic areas, and growing adoption of personalized medicine approaches. The development of novel antibody formats, such as bispecific antibodies and ADCs, will drive market growth. The increasing prevalence of chronic diseases and the potential for preventative monoclonal antibody therapies further enhance future market potential. Strategic partnerships and collaborations will continue to shape the competitive landscape, leading to innovative therapies and expanded market access.
Monoclonal Antibody Therapy Industry Segmentation
-
1. Application
- 1.1. Hematological Diseases
- 1.2. Autoimmune Diseases
- 1.3. Cancer
- 1.4. Others
-
2. Source
- 2.1. Human
- 2.2. Humanized
- 2.3. Chimeric
- 2.4. Others
-
3. End-user
- 3.1. Hospitals
- 3.2. Private Clinics
- 3.3. Others
Monoclonal Antibody Therapy Industry Segmentation By Geography
-
1. North America
- 1.1. United States
- 1.2. Canada
- 1.3. Mexico
-
2. Europe
- 2.1. Germany
- 2.2. United Kingdom
- 2.3. France
- 2.4. Italy
- 2.5. Spain
- 2.6. Rest of Europe
-
3. Asia Pacific
- 3.1. China
- 3.2. Japan
- 3.3. India
- 3.4. Australia
- 3.5. South Korea
- 3.6. Rest of Asia Pacific
-
4. Middle East and Africa
- 4.1. GCC
- 4.2. South Africa
- 4.3. Rest of Middle East and Africa
-
5. South America
- 5.1. Brazil
- 5.2. Argentina
- 5.3. Rest of South America
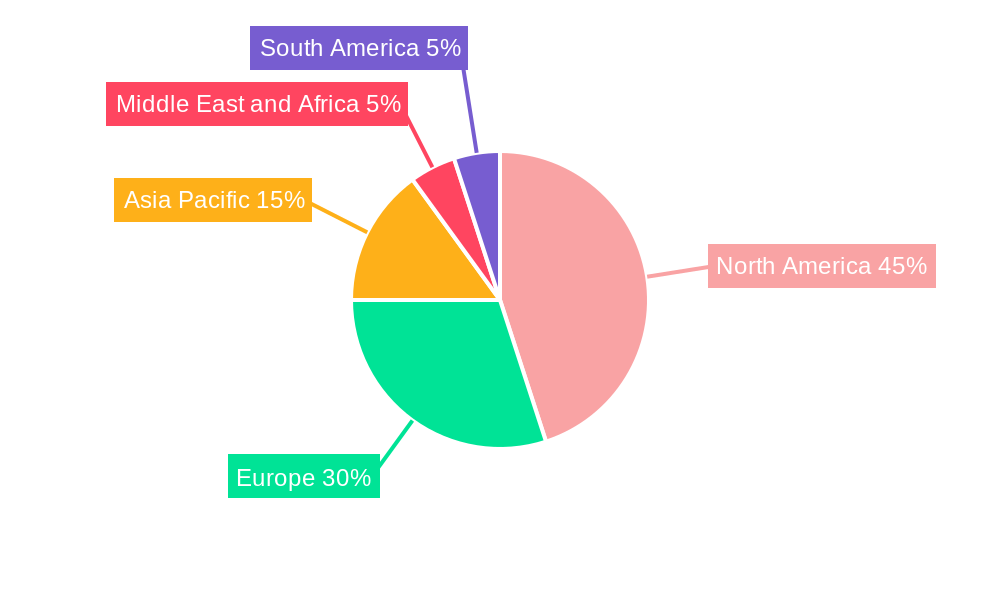
Monoclonal Antibody Therapy Industry Regional Market Share
Geographic Coverage of Monoclonal Antibody Therapy Industry
Monoclonal Antibody Therapy Industry REPORT HIGHLIGHTS
| Aspects | Details |
|---|---|
| Study Period | 2020-2034 |
| Base Year | 2025 |
| Estimated Year | 2026 |
| Forecast Period | 2026-2034 |
| Historical Period | 2020-2025 |
| Growth Rate | CAGR of 16.24% from 2020-2034 |
| Segmentation |
|
Table of Contents
- 1. Introduction
- 1.1. Research Scope
- 1.2. Market Segmentation
- 1.3. Research Objective
- 1.4. Definitions and Assumptions
- 2. Executive Summary
- 2.1. Market Snapshot
- 3. Market Dynamics
- 3.1. Market Drivers
- 3.2. Market Restrains
- 3.3. Market Trends
- 3.4. Market Opportunities
- 4. Market Factor Analysis
- 4.1. Porters Five Forces
- 4.1.1. Bargaining Power of Suppliers
- 4.1.2. Bargaining Power of Buyers
- 4.1.3. Threat of New Entrants
- 4.1.4. Threat of Substitutes
- 4.1.5. Competitive Rivalry
- 4.2. PESTEL analysis
- 4.3. BCG Analysis
- 4.3.1. Stars (High Growth, High Market Share)
- 4.3.2. Cash Cows (Low Growth, High Market Share)
- 4.3.3. Question Mark (High Growth, Low Market Share)
- 4.3.4. Dogs (Low Growth, Low Market Share)
- 4.4. Ansoff Matrix Analysis
- 4.5. Supply Chain Analysis
- 4.6. Regulatory Landscape
- 4.7. Current Market Potential and Opportunity Assessment (TAM–SAM–SOM Framework)
- 4.8. PRI Analyst Note
- 4.1. Porters Five Forces
- 5. Market Analysis, Insights and Forecast 2021-2033
- 5.1. Market Analysis, Insights and Forecast - by Application
- 5.1.1. Hematological Diseases
- 5.1.2. Autoimmune Diseases
- 5.1.3. Cancer
- 5.1.4. Others
- 5.2. Market Analysis, Insights and Forecast - by Source
- 5.2.1. Human
- 5.2.2. Humanized
- 5.2.3. Chimeric
- 5.2.4. Others
- 5.3. Market Analysis, Insights and Forecast - by End-user
- 5.3.1. Hospitals
- 5.3.2. Private Clinics
- 5.3.3. Others
- 5.4. Market Analysis, Insights and Forecast - by Region
- 5.4.1. North America
- 5.4.2. Europe
- 5.4.3. Asia Pacific
- 5.4.4. Middle East and Africa
- 5.4.5. South America
- 5.1. Market Analysis, Insights and Forecast - by Application
- 6. Global Monoclonal Antibody Therapy Industry Analysis, Insights and Forecast, 2021-2033
- 6.1. Market Analysis, Insights and Forecast - by Application
- 6.1.1. Hematological Diseases
- 6.1.2. Autoimmune Diseases
- 6.1.3. Cancer
- 6.1.4. Others
- 6.2. Market Analysis, Insights and Forecast - by Source
- 6.2.1. Human
- 6.2.2. Humanized
- 6.2.3. Chimeric
- 6.2.4. Others
- 6.3. Market Analysis, Insights and Forecast - by End-user
- 6.3.1. Hospitals
- 6.3.2. Private Clinics
- 6.3.3. Others
- 6.1. Market Analysis, Insights and Forecast - by Application
- 7. North America Monoclonal Antibody Therapy Industry Analysis, Insights and Forecast, 2020-2032
- 7.1. Market Analysis, Insights and Forecast - by Application
- 7.1.1. Hematological Diseases
- 7.1.2. Autoimmune Diseases
- 7.1.3. Cancer
- 7.1.4. Others
- 7.2. Market Analysis, Insights and Forecast - by Source
- 7.2.1. Human
- 7.2.2. Humanized
- 7.2.3. Chimeric
- 7.2.4. Others
- 7.3. Market Analysis, Insights and Forecast - by End-user
- 7.3.1. Hospitals
- 7.3.2. Private Clinics
- 7.3.3. Others
- 7.1. Market Analysis, Insights and Forecast - by Application
- 8. Europe Monoclonal Antibody Therapy Industry Analysis, Insights and Forecast, 2020-2032
- 8.1. Market Analysis, Insights and Forecast - by Application
- 8.1.1. Hematological Diseases
- 8.1.2. Autoimmune Diseases
- 8.1.3. Cancer
- 8.1.4. Others
- 8.2. Market Analysis, Insights and Forecast - by Source
- 8.2.1. Human
- 8.2.2. Humanized
- 8.2.3. Chimeric
- 8.2.4. Others
- 8.3. Market Analysis, Insights and Forecast - by End-user
- 8.3.1. Hospitals
- 8.3.2. Private Clinics
- 8.3.3. Others
- 8.1. Market Analysis, Insights and Forecast - by Application
- 9. Asia Pacific Monoclonal Antibody Therapy Industry Analysis, Insights and Forecast, 2020-2032
- 9.1. Market Analysis, Insights and Forecast - by Application
- 9.1.1. Hematological Diseases
- 9.1.2. Autoimmune Diseases
- 9.1.3. Cancer
- 9.1.4. Others
- 9.2. Market Analysis, Insights and Forecast - by Source
- 9.2.1. Human
- 9.2.2. Humanized
- 9.2.3. Chimeric
- 9.2.4. Others
- 9.3. Market Analysis, Insights and Forecast - by End-user
- 9.3.1. Hospitals
- 9.3.2. Private Clinics
- 9.3.3. Others
- 9.1. Market Analysis, Insights and Forecast - by Application
- 10. Middle East and Africa Monoclonal Antibody Therapy Industry Analysis, Insights and Forecast, 2020-2032
- 10.1. Market Analysis, Insights and Forecast - by Application
- 10.1.1. Hematological Diseases
- 10.1.2. Autoimmune Diseases
- 10.1.3. Cancer
- 10.1.4. Others
- 10.2. Market Analysis, Insights and Forecast - by Source
- 10.2.1. Human
- 10.2.2. Humanized
- 10.2.3. Chimeric
- 10.2.4. Others
- 10.3. Market Analysis, Insights and Forecast - by End-user
- 10.3.1. Hospitals
- 10.3.2. Private Clinics
- 10.3.3. Others
- 10.1. Market Analysis, Insights and Forecast - by Application
- 11. South America Monoclonal Antibody Therapy Industry Analysis, Insights and Forecast, 2020-2032
- 11.1. Market Analysis, Insights and Forecast - by Application
- 11.1.1. Hematological Diseases
- 11.1.2. Autoimmune Diseases
- 11.1.3. Cancer
- 11.1.4. Others
- 11.2. Market Analysis, Insights and Forecast - by Source
- 11.2.1. Human
- 11.2.2. Humanized
- 11.2.3. Chimeric
- 11.2.4. Others
- 11.3. Market Analysis, Insights and Forecast - by End-user
- 11.3.1. Hospitals
- 11.3.2. Private Clinics
- 11.3.3. Others
- 11.1. Market Analysis, Insights and Forecast - by Application
- 12. Competitive Analysis
- 12.1. Company Profiles
- 12.1.1 Daiichi Sankyo Company Limited
- 12.1.1.1. Company Overview
- 12.1.1.2. Products
- 12.1.1.3. Company Financials
- 12.1.1.4. SWOT Analysis
- 12.1.2 Boehringer Ingelheim International GmbH
- 12.1.2.1. Company Overview
- 12.1.2.2. Products
- 12.1.2.3. Company Financials
- 12.1.2.4. SWOT Analysis
- 12.1.3 Merck KGaA
- 12.1.3.1. Company Overview
- 12.1.3.2. Products
- 12.1.3.3. Company Financials
- 12.1.3.4. SWOT Analysis
- 12.1.4 Novartis AG
- 12.1.4.1. Company Overview
- 12.1.4.2. Products
- 12.1.4.3. Company Financials
- 12.1.4.4. SWOT Analysis
- 12.1.5 Amgen Inc
- 12.1.5.1. Company Overview
- 12.1.5.2. Products
- 12.1.5.3. Company Financials
- 12.1.5.4. SWOT Analysis
- 12.1.6 F Hoffmann-La Roche Ltd
- 12.1.6.1. Company Overview
- 12.1.6.2. Products
- 12.1.6.3. Company Financials
- 12.1.6.4. SWOT Analysis
- 12.1.7 UCB S A Belgium (UCB Inc)
- 12.1.7.1. Company Overview
- 12.1.7.2. Products
- 12.1.7.3. Company Financials
- 12.1.7.4. SWOT Analysis
- 12.1.8 AbbVie Inc
- 12.1.8.1. Company Overview
- 12.1.8.2. Products
- 12.1.8.3. Company Financials
- 12.1.8.4. SWOT Analysis
- 12.1.9 Johnson & Johnson
- 12.1.9.1. Company Overview
- 12.1.9.2. Products
- 12.1.9.3. Company Financials
- 12.1.9.4. SWOT Analysis
- 12.1.10 Pfizer Inc
- 12.1.10.1. Company Overview
- 12.1.10.2. Products
- 12.1.10.3. Company Financials
- 12.1.10.4. SWOT Analysis
- 12.1.1 Daiichi Sankyo Company Limited
- 12.2. Market Entropy
- 12.2.1 Company's Key Areas Served
- 12.2.2 Recent Developments
- 12.3. Company Market Share Analysis 2025
- 12.3.1 Top 5 Companies Market Share Analysis
- 12.3.2 Top 3 Companies Market Share Analysis
- 12.4. List of Potential Customers
- 13. Research Methodology
List of Figures
- Figure 1: Global Monoclonal Antibody Therapy Industry Revenue Breakdown (billion, %) by Region 2025 & 2033
- Figure 2: Global Monoclonal Antibody Therapy Industry Volume Breakdown (K Unit, %) by Region 2025 & 2033
- Figure 3: North America Monoclonal Antibody Therapy Industry Revenue (billion), by Application 2025 & 2033
- Figure 4: North America Monoclonal Antibody Therapy Industry Volume (K Unit), by Application 2025 & 2033
- Figure 5: North America Monoclonal Antibody Therapy Industry Revenue Share (%), by Application 2025 & 2033
- Figure 6: North America Monoclonal Antibody Therapy Industry Volume Share (%), by Application 2025 & 2033
- Figure 7: North America Monoclonal Antibody Therapy Industry Revenue (billion), by Source 2025 & 2033
- Figure 8: North America Monoclonal Antibody Therapy Industry Volume (K Unit), by Source 2025 & 2033
- Figure 9: North America Monoclonal Antibody Therapy Industry Revenue Share (%), by Source 2025 & 2033
- Figure 10: North America Monoclonal Antibody Therapy Industry Volume Share (%), by Source 2025 & 2033
- Figure 11: North America Monoclonal Antibody Therapy Industry Revenue (billion), by End-user 2025 & 2033
- Figure 12: North America Monoclonal Antibody Therapy Industry Volume (K Unit), by End-user 2025 & 2033
- Figure 13: North America Monoclonal Antibody Therapy Industry Revenue Share (%), by End-user 2025 & 2033
- Figure 14: North America Monoclonal Antibody Therapy Industry Volume Share (%), by End-user 2025 & 2033
- Figure 15: North America Monoclonal Antibody Therapy Industry Revenue (billion), by Country 2025 & 2033
- Figure 16: North America Monoclonal Antibody Therapy Industry Volume (K Unit), by Country 2025 & 2033
- Figure 17: North America Monoclonal Antibody Therapy Industry Revenue Share (%), by Country 2025 & 2033
- Figure 18: North America Monoclonal Antibody Therapy Industry Volume Share (%), by Country 2025 & 2033
- Figure 19: Europe Monoclonal Antibody Therapy Industry Revenue (billion), by Application 2025 & 2033
- Figure 20: Europe Monoclonal Antibody Therapy Industry Volume (K Unit), by Application 2025 & 2033
- Figure 21: Europe Monoclonal Antibody Therapy Industry Revenue Share (%), by Application 2025 & 2033
- Figure 22: Europe Monoclonal Antibody Therapy Industry Volume Share (%), by Application 2025 & 2033
- Figure 23: Europe Monoclonal Antibody Therapy Industry Revenue (billion), by Source 2025 & 2033
- Figure 24: Europe Monoclonal Antibody Therapy Industry Volume (K Unit), by Source 2025 & 2033
- Figure 25: Europe Monoclonal Antibody Therapy Industry Revenue Share (%), by Source 2025 & 2033
- Figure 26: Europe Monoclonal Antibody Therapy Industry Volume Share (%), by Source 2025 & 2033
- Figure 27: Europe Monoclonal Antibody Therapy Industry Revenue (billion), by End-user 2025 & 2033
- Figure 28: Europe Monoclonal Antibody Therapy Industry Volume (K Unit), by End-user 2025 & 2033
- Figure 29: Europe Monoclonal Antibody Therapy Industry Revenue Share (%), by End-user 2025 & 2033
- Figure 30: Europe Monoclonal Antibody Therapy Industry Volume Share (%), by End-user 2025 & 2033
- Figure 31: Europe Monoclonal Antibody Therapy Industry Revenue (billion), by Country 2025 & 2033
- Figure 32: Europe Monoclonal Antibody Therapy Industry Volume (K Unit), by Country 2025 & 2033
- Figure 33: Europe Monoclonal Antibody Therapy Industry Revenue Share (%), by Country 2025 & 2033
- Figure 34: Europe Monoclonal Antibody Therapy Industry Volume Share (%), by Country 2025 & 2033
- Figure 35: Asia Pacific Monoclonal Antibody Therapy Industry Revenue (billion), by Application 2025 & 2033
- Figure 36: Asia Pacific Monoclonal Antibody Therapy Industry Volume (K Unit), by Application 2025 & 2033
- Figure 37: Asia Pacific Monoclonal Antibody Therapy Industry Revenue Share (%), by Application 2025 & 2033
- Figure 38: Asia Pacific Monoclonal Antibody Therapy Industry Volume Share (%), by Application 2025 & 2033
- Figure 39: Asia Pacific Monoclonal Antibody Therapy Industry Revenue (billion), by Source 2025 & 2033
- Figure 40: Asia Pacific Monoclonal Antibody Therapy Industry Volume (K Unit), by Source 2025 & 2033
- Figure 41: Asia Pacific Monoclonal Antibody Therapy Industry Revenue Share (%), by Source 2025 & 2033
- Figure 42: Asia Pacific Monoclonal Antibody Therapy Industry Volume Share (%), by Source 2025 & 2033
- Figure 43: Asia Pacific Monoclonal Antibody Therapy Industry Revenue (billion), by End-user 2025 & 2033
- Figure 44: Asia Pacific Monoclonal Antibody Therapy Industry Volume (K Unit), by End-user 2025 & 2033
- Figure 45: Asia Pacific Monoclonal Antibody Therapy Industry Revenue Share (%), by End-user 2025 & 2033
- Figure 46: Asia Pacific Monoclonal Antibody Therapy Industry Volume Share (%), by End-user 2025 & 2033
- Figure 47: Asia Pacific Monoclonal Antibody Therapy Industry Revenue (billion), by Country 2025 & 2033
- Figure 48: Asia Pacific Monoclonal Antibody Therapy Industry Volume (K Unit), by Country 2025 & 2033
- Figure 49: Asia Pacific Monoclonal Antibody Therapy Industry Revenue Share (%), by Country 2025 & 2033
- Figure 50: Asia Pacific Monoclonal Antibody Therapy Industry Volume Share (%), by Country 2025 & 2033
- Figure 51: Middle East and Africa Monoclonal Antibody Therapy Industry Revenue (billion), by Application 2025 & 2033
- Figure 52: Middle East and Africa Monoclonal Antibody Therapy Industry Volume (K Unit), by Application 2025 & 2033
- Figure 53: Middle East and Africa Monoclonal Antibody Therapy Industry Revenue Share (%), by Application 2025 & 2033
- Figure 54: Middle East and Africa Monoclonal Antibody Therapy Industry Volume Share (%), by Application 2025 & 2033
- Figure 55: Middle East and Africa Monoclonal Antibody Therapy Industry Revenue (billion), by Source 2025 & 2033
- Figure 56: Middle East and Africa Monoclonal Antibody Therapy Industry Volume (K Unit), by Source 2025 & 2033
- Figure 57: Middle East and Africa Monoclonal Antibody Therapy Industry Revenue Share (%), by Source 2025 & 2033
- Figure 58: Middle East and Africa Monoclonal Antibody Therapy Industry Volume Share (%), by Source 2025 & 2033
- Figure 59: Middle East and Africa Monoclonal Antibody Therapy Industry Revenue (billion), by End-user 2025 & 2033
- Figure 60: Middle East and Africa Monoclonal Antibody Therapy Industry Volume (K Unit), by End-user 2025 & 2033
- Figure 61: Middle East and Africa Monoclonal Antibody Therapy Industry Revenue Share (%), by End-user 2025 & 2033
- Figure 62: Middle East and Africa Monoclonal Antibody Therapy Industry Volume Share (%), by End-user 2025 & 2033
- Figure 63: Middle East and Africa Monoclonal Antibody Therapy Industry Revenue (billion), by Country 2025 & 2033
- Figure 64: Middle East and Africa Monoclonal Antibody Therapy Industry Volume (K Unit), by Country 2025 & 2033
- Figure 65: Middle East and Africa Monoclonal Antibody Therapy Industry Revenue Share (%), by Country 2025 & 2033
- Figure 66: Middle East and Africa Monoclonal Antibody Therapy Industry Volume Share (%), by Country 2025 & 2033
- Figure 67: South America Monoclonal Antibody Therapy Industry Revenue (billion), by Application 2025 & 2033
- Figure 68: South America Monoclonal Antibody Therapy Industry Volume (K Unit), by Application 2025 & 2033
- Figure 69: South America Monoclonal Antibody Therapy Industry Revenue Share (%), by Application 2025 & 2033
- Figure 70: South America Monoclonal Antibody Therapy Industry Volume Share (%), by Application 2025 & 2033
- Figure 71: South America Monoclonal Antibody Therapy Industry Revenue (billion), by Source 2025 & 2033
- Figure 72: South America Monoclonal Antibody Therapy Industry Volume (K Unit), by Source 2025 & 2033
- Figure 73: South America Monoclonal Antibody Therapy Industry Revenue Share (%), by Source 2025 & 2033
- Figure 74: South America Monoclonal Antibody Therapy Industry Volume Share (%), by Source 2025 & 2033
- Figure 75: South America Monoclonal Antibody Therapy Industry Revenue (billion), by End-user 2025 & 2033
- Figure 76: South America Monoclonal Antibody Therapy Industry Volume (K Unit), by End-user 2025 & 2033
- Figure 77: South America Monoclonal Antibody Therapy Industry Revenue Share (%), by End-user 2025 & 2033
- Figure 78: South America Monoclonal Antibody Therapy Industry Volume Share (%), by End-user 2025 & 2033
- Figure 79: South America Monoclonal Antibody Therapy Industry Revenue (billion), by Country 2025 & 2033
- Figure 80: South America Monoclonal Antibody Therapy Industry Volume (K Unit), by Country 2025 & 2033
- Figure 81: South America Monoclonal Antibody Therapy Industry Revenue Share (%), by Country 2025 & 2033
- Figure 82: South America Monoclonal Antibody Therapy Industry Volume Share (%), by Country 2025 & 2033
List of Tables
- Table 1: Global Monoclonal Antibody Therapy Industry Revenue billion Forecast, by Application 2020 & 2033
- Table 2: Global Monoclonal Antibody Therapy Industry Volume K Unit Forecast, by Application 2020 & 2033
- Table 3: Global Monoclonal Antibody Therapy Industry Revenue billion Forecast, by Source 2020 & 2033
- Table 4: Global Monoclonal Antibody Therapy Industry Volume K Unit Forecast, by Source 2020 & 2033
- Table 5: Global Monoclonal Antibody Therapy Industry Revenue billion Forecast, by End-user 2020 & 2033
- Table 6: Global Monoclonal Antibody Therapy Industry Volume K Unit Forecast, by End-user 2020 & 2033
- Table 7: Global Monoclonal Antibody Therapy Industry Revenue billion Forecast, by Region 2020 & 2033
- Table 8: Global Monoclonal Antibody Therapy Industry Volume K Unit Forecast, by Region 2020 & 2033
- Table 9: Global Monoclonal Antibody Therapy Industry Revenue billion Forecast, by Application 2020 & 2033
- Table 10: Global Monoclonal Antibody Therapy Industry Volume K Unit Forecast, by Application 2020 & 2033
- Table 11: Global Monoclonal Antibody Therapy Industry Revenue billion Forecast, by Source 2020 & 2033
- Table 12: Global Monoclonal Antibody Therapy Industry Volume K Unit Forecast, by Source 2020 & 2033
- Table 13: Global Monoclonal Antibody Therapy Industry Revenue billion Forecast, by End-user 2020 & 2033
- Table 14: Global Monoclonal Antibody Therapy Industry Volume K Unit Forecast, by End-user 2020 & 2033
- Table 15: Global Monoclonal Antibody Therapy Industry Revenue billion Forecast, by Country 2020 & 2033
- Table 16: Global Monoclonal Antibody Therapy Industry Volume K Unit Forecast, by Country 2020 & 2033
- Table 17: United States Monoclonal Antibody Therapy Industry Revenue (billion) Forecast, by Application 2020 & 2033
- Table 18: United States Monoclonal Antibody Therapy Industry Volume (K Unit) Forecast, by Application 2020 & 2033
- Table 19: Canada Monoclonal Antibody Therapy Industry Revenue (billion) Forecast, by Application 2020 & 2033
- Table 20: Canada Monoclonal Antibody Therapy Industry Volume (K Unit) Forecast, by Application 2020 & 2033
- Table 21: Mexico Monoclonal Antibody Therapy Industry Revenue (billion) Forecast, by Application 2020 & 2033
- Table 22: Mexico Monoclonal Antibody Therapy Industry Volume (K Unit) Forecast, by Application 2020 & 2033
- Table 23: Global Monoclonal Antibody Therapy Industry Revenue billion Forecast, by Application 2020 & 2033
- Table 24: Global Monoclonal Antibody Therapy Industry Volume K Unit Forecast, by Application 2020 & 2033
- Table 25: Global Monoclonal Antibody Therapy Industry Revenue billion Forecast, by Source 2020 & 2033
- Table 26: Global Monoclonal Antibody Therapy Industry Volume K Unit Forecast, by Source 2020 & 2033
- Table 27: Global Monoclonal Antibody Therapy Industry Revenue billion Forecast, by End-user 2020 & 2033
- Table 28: Global Monoclonal Antibody Therapy Industry Volume K Unit Forecast, by End-user 2020 & 2033
- Table 29: Global Monoclonal Antibody Therapy Industry Revenue billion Forecast, by Country 2020 & 2033
- Table 30: Global Monoclonal Antibody Therapy Industry Volume K Unit Forecast, by Country 2020 & 2033
- Table 31: Germany Monoclonal Antibody Therapy Industry Revenue (billion) Forecast, by Application 2020 & 2033
- Table 32: Germany Monoclonal Antibody Therapy Industry Volume (K Unit) Forecast, by Application 2020 & 2033
- Table 33: United Kingdom Monoclonal Antibody Therapy Industry Revenue (billion) Forecast, by Application 2020 & 2033
- Table 34: United Kingdom Monoclonal Antibody Therapy Industry Volume (K Unit) Forecast, by Application 2020 & 2033
- Table 35: France Monoclonal Antibody Therapy Industry Revenue (billion) Forecast, by Application 2020 & 2033
- Table 36: France Monoclonal Antibody Therapy Industry Volume (K Unit) Forecast, by Application 2020 & 2033
- Table 37: Italy Monoclonal Antibody Therapy Industry Revenue (billion) Forecast, by Application 2020 & 2033
- Table 38: Italy Monoclonal Antibody Therapy Industry Volume (K Unit) Forecast, by Application 2020 & 2033
- Table 39: Spain Monoclonal Antibody Therapy Industry Revenue (billion) Forecast, by Application 2020 & 2033
- Table 40: Spain Monoclonal Antibody Therapy Industry Volume (K Unit) Forecast, by Application 2020 & 2033
- Table 41: Rest of Europe Monoclonal Antibody Therapy Industry Revenue (billion) Forecast, by Application 2020 & 2033
- Table 42: Rest of Europe Monoclonal Antibody Therapy Industry Volume (K Unit) Forecast, by Application 2020 & 2033
- Table 43: Global Monoclonal Antibody Therapy Industry Revenue billion Forecast, by Application 2020 & 2033
- Table 44: Global Monoclonal Antibody Therapy Industry Volume K Unit Forecast, by Application 2020 & 2033
- Table 45: Global Monoclonal Antibody Therapy Industry Revenue billion Forecast, by Source 2020 & 2033
- Table 46: Global Monoclonal Antibody Therapy Industry Volume K Unit Forecast, by Source 2020 & 2033
- Table 47: Global Monoclonal Antibody Therapy Industry Revenue billion Forecast, by End-user 2020 & 2033
- Table 48: Global Monoclonal Antibody Therapy Industry Volume K Unit Forecast, by End-user 2020 & 2033
- Table 49: Global Monoclonal Antibody Therapy Industry Revenue billion Forecast, by Country 2020 & 2033
- Table 50: Global Monoclonal Antibody Therapy Industry Volume K Unit Forecast, by Country 2020 & 2033
- Table 51: China Monoclonal Antibody Therapy Industry Revenue (billion) Forecast, by Application 2020 & 2033
- Table 52: China Monoclonal Antibody Therapy Industry Volume (K Unit) Forecast, by Application 2020 & 2033
- Table 53: Japan Monoclonal Antibody Therapy Industry Revenue (billion) Forecast, by Application 2020 & 2033
- Table 54: Japan Monoclonal Antibody Therapy Industry Volume (K Unit) Forecast, by Application 2020 & 2033
- Table 55: India Monoclonal Antibody Therapy Industry Revenue (billion) Forecast, by Application 2020 & 2033
- Table 56: India Monoclonal Antibody Therapy Industry Volume (K Unit) Forecast, by Application 2020 & 2033
- Table 57: Australia Monoclonal Antibody Therapy Industry Revenue (billion) Forecast, by Application 2020 & 2033
- Table 58: Australia Monoclonal Antibody Therapy Industry Volume (K Unit) Forecast, by Application 2020 & 2033
- Table 59: South Korea Monoclonal Antibody Therapy Industry Revenue (billion) Forecast, by Application 2020 & 2033
- Table 60: South Korea Monoclonal Antibody Therapy Industry Volume (K Unit) Forecast, by Application 2020 & 2033
- Table 61: Rest of Asia Pacific Monoclonal Antibody Therapy Industry Revenue (billion) Forecast, by Application 2020 & 2033
- Table 62: Rest of Asia Pacific Monoclonal Antibody Therapy Industry Volume (K Unit) Forecast, by Application 2020 & 2033
- Table 63: Global Monoclonal Antibody Therapy Industry Revenue billion Forecast, by Application 2020 & 2033
- Table 64: Global Monoclonal Antibody Therapy Industry Volume K Unit Forecast, by Application 2020 & 2033
- Table 65: Global Monoclonal Antibody Therapy Industry Revenue billion Forecast, by Source 2020 & 2033
- Table 66: Global Monoclonal Antibody Therapy Industry Volume K Unit Forecast, by Source 2020 & 2033
- Table 67: Global Monoclonal Antibody Therapy Industry Revenue billion Forecast, by End-user 2020 & 2033
- Table 68: Global Monoclonal Antibody Therapy Industry Volume K Unit Forecast, by End-user 2020 & 2033
- Table 69: Global Monoclonal Antibody Therapy Industry Revenue billion Forecast, by Country 2020 & 2033
- Table 70: Global Monoclonal Antibody Therapy Industry Volume K Unit Forecast, by Country 2020 & 2033
- Table 71: GCC Monoclonal Antibody Therapy Industry Revenue (billion) Forecast, by Application 2020 & 2033
- Table 72: GCC Monoclonal Antibody Therapy Industry Volume (K Unit) Forecast, by Application 2020 & 2033
- Table 73: South Africa Monoclonal Antibody Therapy Industry Revenue (billion) Forecast, by Application 2020 & 2033
- Table 74: South Africa Monoclonal Antibody Therapy Industry Volume (K Unit) Forecast, by Application 2020 & 2033
- Table 75: Rest of Middle East and Africa Monoclonal Antibody Therapy Industry Revenue (billion) Forecast, by Application 2020 & 2033
- Table 76: Rest of Middle East and Africa Monoclonal Antibody Therapy Industry Volume (K Unit) Forecast, by Application 2020 & 2033
- Table 77: Global Monoclonal Antibody Therapy Industry Revenue billion Forecast, by Application 2020 & 2033
- Table 78: Global Monoclonal Antibody Therapy Industry Volume K Unit Forecast, by Application 2020 & 2033
- Table 79: Global Monoclonal Antibody Therapy Industry Revenue billion Forecast, by Source 2020 & 2033
- Table 80: Global Monoclonal Antibody Therapy Industry Volume K Unit Forecast, by Source 2020 & 2033
- Table 81: Global Monoclonal Antibody Therapy Industry Revenue billion Forecast, by End-user 2020 & 2033
- Table 82: Global Monoclonal Antibody Therapy Industry Volume K Unit Forecast, by End-user 2020 & 2033
- Table 83: Global Monoclonal Antibody Therapy Industry Revenue billion Forecast, by Country 2020 & 2033
- Table 84: Global Monoclonal Antibody Therapy Industry Volume K Unit Forecast, by Country 2020 & 2033
- Table 85: Brazil Monoclonal Antibody Therapy Industry Revenue (billion) Forecast, by Application 2020 & 2033
- Table 86: Brazil Monoclonal Antibody Therapy Industry Volume (K Unit) Forecast, by Application 2020 & 2033
- Table 87: Argentina Monoclonal Antibody Therapy Industry Revenue (billion) Forecast, by Application 2020 & 2033
- Table 88: Argentina Monoclonal Antibody Therapy Industry Volume (K Unit) Forecast, by Application 2020 & 2033
- Table 89: Rest of South America Monoclonal Antibody Therapy Industry Revenue (billion) Forecast, by Application 2020 & 2033
- Table 90: Rest of South America Monoclonal Antibody Therapy Industry Volume (K Unit) Forecast, by Application 2020 & 2033
Frequently Asked Questions
1. What is the projected Compound Annual Growth Rate (CAGR) of the Monoclonal Antibody Therapy Industry?
The projected CAGR is approximately 16.24%.
2. Which companies are prominent players in the Monoclonal Antibody Therapy Industry?
Key companies in the market include Daiichi Sankyo Company Limited, Boehringer Ingelheim International GmbH, Merck KGaA, Novartis AG, Amgen Inc, F Hoffmann-La Roche Ltd, UCB S A Belgium (UCB Inc), AbbVie Inc, Johnson & Johnson, Pfizer Inc.
3. What are the main segments of the Monoclonal Antibody Therapy Industry?
The market segments include Application, Source, End-user.
4. Can you provide details about the market size?
The market size is estimated to be USD 264.33 billion as of 2022.
5. What are some drivers contributing to market growth?
Increasing Global Prevalence of Autoimmune Disorders and Rise in Geriatric Population; New Product Launches with Accelerated Drug Approval Initiative by USFDA.
6. What are the notable trends driving market growth?
Autoimmune Diseases are Expected to Hold the Significant Market Share in the Monoclonal Antibody Therapeutics Market.
7. Are there any restraints impacting market growth?
High Risk of Complications such as Heart Failure. Liver Injury. Neurological Disorders. Psoriasis and many Allergic Reactions; High Challenges while in the Development Stage and Expensive Patented Products.
8. Can you provide examples of recent developments in the market?
September 2022: AstraZeneca's Evusheld (tixagevimab and cilgavimab, formerly AZD7442), a long-acting antibody combination, was recommended for marketing authorization in the European Union (EU) for the treatment of adults and adolescents (aged 12 years and older weighing at least 40 kg) with COVID19 who do not require supplemental oxygen and who are at increased risk of progressing to severe COVID19.
9. What pricing options are available for accessing the report?
Pricing options include single-user, multi-user, and enterprise licenses priced at USD 4750, USD 5250, and USD 8750 respectively.
10. Is the market size provided in terms of value or volume?
The market size is provided in terms of value, measured in billion and volume, measured in K Unit.
11. Are there any specific market keywords associated with the report?
Yes, the market keyword associated with the report is "Monoclonal Antibody Therapy Industry," which aids in identifying and referencing the specific market segment covered.
12. How do I determine which pricing option suits my needs best?
The pricing options vary based on user requirements and access needs. Individual users may opt for single-user licenses, while businesses requiring broader access may choose multi-user or enterprise licenses for cost-effective access to the report.
13. Are there any additional resources or data provided in the Monoclonal Antibody Therapy Industry report?
While the report offers comprehensive insights, it's advisable to review the specific contents or supplementary materials provided to ascertain if additional resources or data are available.
14. How can I stay updated on further developments or reports in the Monoclonal Antibody Therapy Industry?
To stay informed about further developments, trends, and reports in the Monoclonal Antibody Therapy Industry, consider subscribing to industry newsletters, following relevant companies and organizations, or regularly checking reputable industry news sources and publications.
Methodology
Step 1 - Identification of Relevant Samples Size from Population Database


Step 2 - Approaches for Defining Global Market Size (Value, Volume* & Price*)

Note*: In applicable scenarios
Step 3 - Data Sources
Primary Research
- Web Analytics
- Survey Reports
- Research Institute
- Latest Research Reports
- Opinion Leaders
Secondary Research
- Annual Reports
- White Paper
- Latest Press Release
- Industry Association
- Paid Database
- Investor Presentations

Step 4 - Data Triangulation
Involves using different sources of information in order to increase the validity of a study
These sources are likely to be stakeholders in a program - participants, other researchers, program staff, other community members, and so on.
Then we put all data in single framework & apply various statistical tools to find out the dynamic on the market.
During the analysis stage, feedback from the stakeholder groups would be compared to determine areas of agreement as well as areas of divergence