

Key Insights
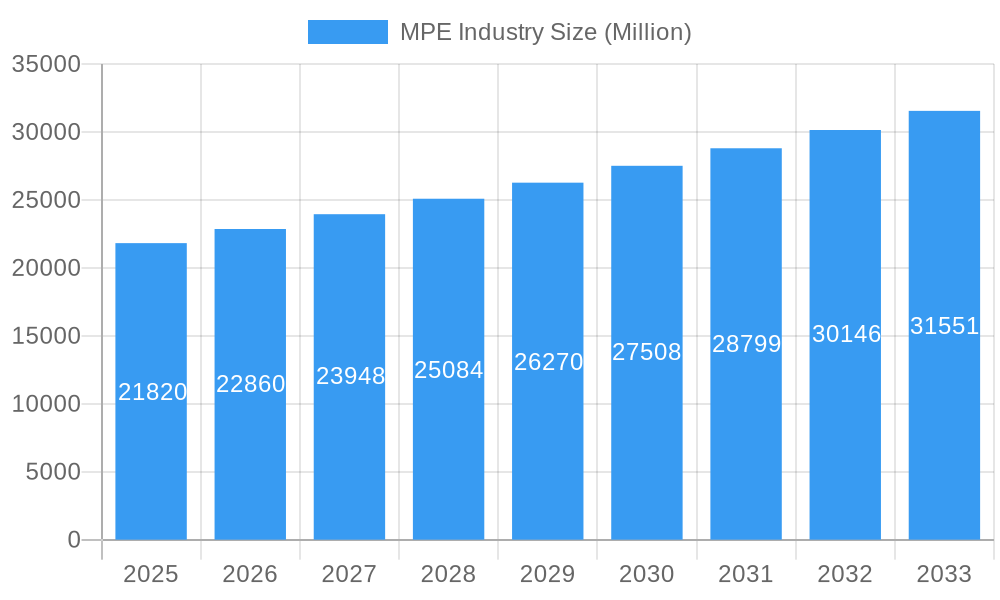
The global Metallocene Polyethylene (mPE) market, valued at $21.82 billion in 2025, is projected to experience robust growth, driven by increasing demand from the packaging, films, and automotive industries. A Compound Annual Growth Rate (CAGR) of 4.63% from 2025 to 2033 indicates a substantial market expansion. Key drivers include the superior properties of mPE, such as enhanced strength, flexibility, and barrier properties compared to conventional polyethylene. This allows for lighter weight packaging, reduced material usage, and improved product protection, aligning perfectly with sustainability initiatives and consumer preference for eco-friendly solutions. The growing emphasis on food safety and the need for advanced packaging solutions further fuel the demand for mPE. Technological advancements in mPE production processes, leading to improved efficiency and cost-effectiveness, also contribute to market expansion. However, factors like fluctuating raw material prices and intense competition among established players could pose challenges to market growth.
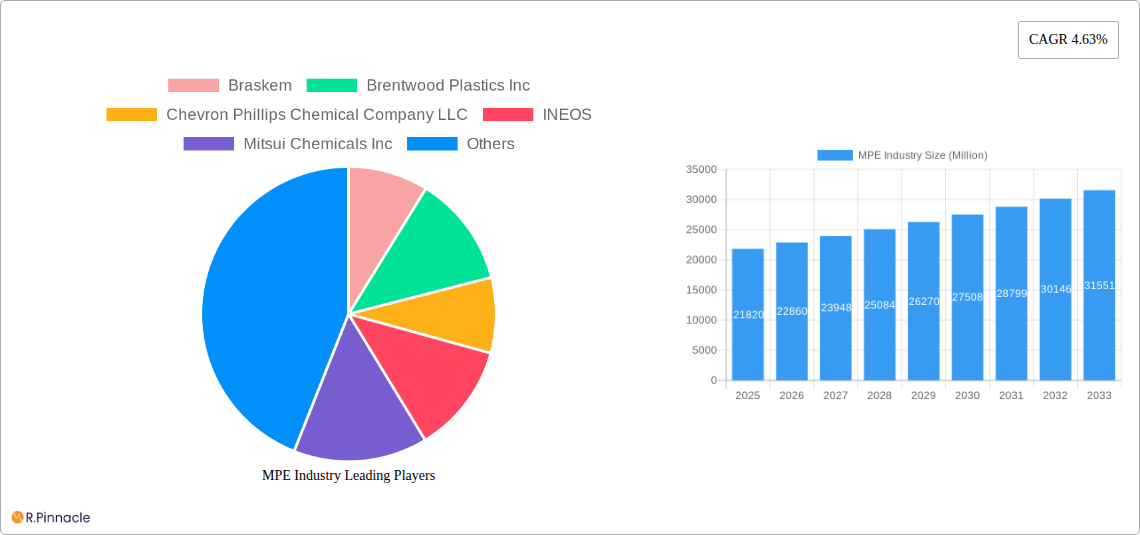
MPE Industry Market Size (In Billion)
Despite these challenges, the market is segmented into various grades offering specific properties catering to diverse application requirements. Leading players like Braskem, Chevron Phillips Chemical, and INEOS are driving innovation and investing in capacity expansions to meet the rising global demand. Regional variations in growth rates are anticipated, with regions like Asia-Pacific showing potentially higher growth due to rapid industrialization and increasing consumer spending. The continued focus on sustainable packaging solutions and advancements in mPE technology are likely to sustain the market's positive trajectory throughout the forecast period, creating significant opportunities for market participants. The ongoing evolution of mPE grades with tailored properties will further solidify its position in diverse applications.
MPE Industry Company Market Share
MPE Industry Market Report: 2019-2033 Forecast
This comprehensive report provides an in-depth analysis of the global MPE industry, offering invaluable insights for industry professionals, investors, and strategists. With a study period spanning 2019-2033, a base year of 2025, and a forecast period of 2025-2033, this report offers a robust understanding of the current market landscape and future growth trajectory. The report covers key market segments, dominant players, and emerging trends, leveraging data to provide actionable recommendations. The global MPE market is projected to reach xx Million by 2033.
MPE Industry Market Structure & Innovation Trends
This section analyzes the competitive landscape of the MPE industry, encompassing market concentration, innovation drivers, regulatory frameworks, product substitutes, and end-user demographics. We delve into M&A activities, providing metrics such as market share and deal values. The market is moderately concentrated, with key players like Braskem, SABIC, and INEOS holding significant shares. However, several smaller players contribute to a dynamic competitive environment.
- Market Concentration: The top 5 players hold approximately xx% of the market share in 2025.
- Innovation Drivers: Growing demand from solar panels, vehicles, and flexible packaging is driving innovation in material properties and processing techniques.
- Regulatory Frameworks: Environmental regulations are increasingly influencing material choices, favoring sustainable and recyclable MPE solutions.
- Product Substitutes: Competition comes from alternative materials like conventional polyethylene and other specialized polymers.
- M&A Activities: The past five years have witnessed xx Million in M&A deals within the MPE industry, primarily driven by expansion strategies and technological integration.
MPE Industry Market Dynamics & Trends
This section explores the key factors shaping the MPE market's growth trajectory, including market growth drivers, technological disruptions, consumer preferences, and competitive dynamics. The MPE market is experiencing significant growth, driven primarily by increasing demand from various end-use sectors.
- CAGR: The market is projected to grow at a CAGR of xx% during the forecast period (2025-2033).
- Market Penetration: MPE penetration in key segments is expected to reach xx% by 2033.
- Growth Drivers: Rising demand from packaging, automotive, and construction industries fuels market expansion. Advancements in MPE technology further enhance its applicability.
- Technological Disruptions: Innovations in polymerization processes and additive manufacturing are transforming the industry.
- Consumer Preferences: A shift towards sustainable and eco-friendly materials is boosting demand for recyclable MPE products.
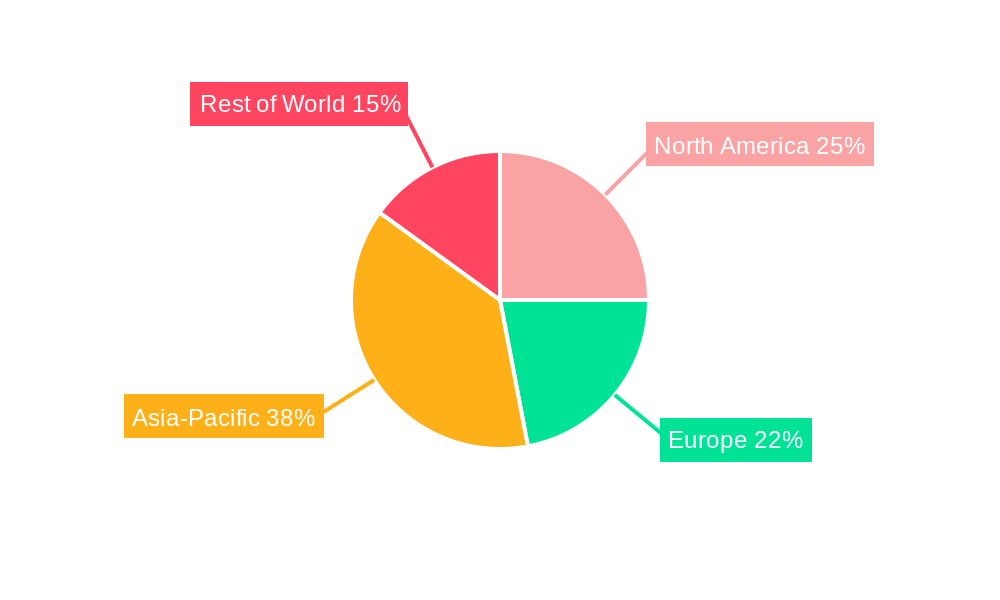
Dominant Regions & Segments in MPE Industry
This section identifies the leading regions and segments within the MPE market. Asia-Pacific currently dominates the global MPE market, fueled by strong economic growth and significant investments in infrastructure. Europe and North America also hold substantial market shares.
- Key Drivers (Asia-Pacific):
- Rapid industrialization and infrastructure development.
- Increasing demand from automotive and packaging sectors.
- Supportive government policies and initiatives.
- Dominance Analysis: Asia-Pacific's robust manufacturing base, coupled with substantial downstream demand, contributes to its leading position. Europe and North America are expected to experience steady growth, driven by innovation and sustainability concerns.
MPE Industry Product Innovations
Recent advancements in MPE technology have led to the development of high-performance materials with enhanced properties such as improved tensile strength, flexibility, and durability. These innovations have broadened the range of applications for MPE, making it suitable for diverse industries, from flexible packaging and automotive to medical devices. The focus on sustainability drives further innovation towards bio-based and readily recyclable MPE options.
Report Scope & Segmentation Analysis
This report offers detailed market segmentation based on type, application, and region. Each segment's growth prospects, market size, and competitive dynamics are analyzed in detail. (Specific segment details would be included here in the full report – e.g., by type of MPE, by end-use application, by region).
Key Drivers of MPE Industry Growth
Several factors contribute to the MPE industry's growth, including rising demand from diverse end-use industries, technological advancements, and supportive government policies promoting sustainable materials. The increasing focus on lightweighting in the automotive sector also drives demand for high-performance MPE solutions.
Challenges in the MPE Industry Sector
Challenges include fluctuating raw material prices, intense competition, and concerns related to the environmental impact of polymer production. Stringent environmental regulations require producers to adopt sustainable practices, while fluctuating oil prices impact production costs. Meeting the increasing demand while maintaining sustainable practices presents a significant challenge.
Emerging Opportunities in MPE Industry
Opportunities lie in exploring new applications, such as in renewable energy technologies and advanced packaging solutions. The growing emphasis on sustainable and bio-based polymers presents further opportunities for innovation and expansion. Investment in research and development of advanced MPE formulations will drive future growth.
Leading Players in the MPE Industry Market
- Braskem
- Brentwood Plastics Inc
- Chevron Phillips Chemical Company LLC
- INEOS
- Mitsui Chemicals Inc
- Prime Polymer Co Ltd
- SABIC
- TotalEnergies
- Univation Technologies LLC
- W R Grace & Co -Conn
Key Developments in MPE Industry Industry
- August 2022: SABIC SK Nexlene Company (SSNC), a joint venture of SABIC and SK Geo Centric, announced plans to expand the capacity of its Ulsan plant to produce mPE. This expansion is driven by the growing demand for mPE in solar panels, vehicles, footwear, and flexible packaging.
Future Outlook for MPE Industry Market
The MPE industry is poised for continued growth, driven by technological advancements, increasing demand from diverse end-use sectors, and a growing focus on sustainable materials. Strategic partnerships and investments in research and development will be crucial for success in this dynamic market. The market is expected to witness a significant increase in demand in the coming years.
MPE Industry Segmentation
-
1. Type
- 1.1. Metalloc
- 1.2. Metallocene High-density Polyethylene (mHDPE)
- 1.3. Other Ty
-
2. Application
- 2.1. Films
- 2.2. Sheets
- 2.3. Other Applications
-
3. End-User Industry
- 3.1. Packaging
- 3.2. Agriculture
- 3.3. Automotive
- 3.4. Building and Construction
- 3.5. Other End-User Industries
MPE Industry Segmentation By Geography
-
1. Asia Pacific
- 1.1. China
- 1.2. India
- 1.3. Japan
- 1.4. South Korea
- 1.5. Rest of Asia Pacific
-
2. North America
- 2.1. United States
- 2.2. Canada
- 2.3. Mexico
-
3. Europe
- 3.1. Germany
- 3.2. United Kingdom
- 3.3. Italy
- 3.4. France
- 3.5. Rest of Europe
-
4. South America
- 4.1. Brazil
- 4.2. Argentina
- 4.3. Rest of South America
- 5. Middle East
-
6. Saudi Arabia
- 6.1. South Africa
- 6.2. Rest of Middle East
MPE Industry Regional Market Share
Geographic Coverage of MPE Industry
MPE Industry REPORT HIGHLIGHTS
| Aspects | Details |
|---|---|
| Study Period | 2020-2034 |
| Base Year | 2025 |
| Estimated Year | 2026 |
| Forecast Period | 2026-2034 |
| Historical Period | 2020-2025 |
| Growth Rate | CAGR of 4.63% from 2020-2034 |
| Segmentation |
|
Table of Contents
- 1. Introduction
- 1.1. Research Scope
- 1.2. Market Segmentation
- 1.3. Research Objective
- 1.4. Definitions and Assumptions
- 2. Executive Summary
- 2.1. Market Snapshot
- 3. Market Dynamics
- 3.1. Market Drivers
- 3.2. Market Restrains
- 3.3. Market Trends
- 3.4. Market Opportunities
- 4. Market Factor Analysis
- 4.1. Porters Five Forces
- 4.1.1. Bargaining Power of Suppliers
- 4.1.2. Bargaining Power of Buyers
- 4.1.3. Threat of New Entrants
- 4.1.4. Threat of Substitutes
- 4.1.5. Competitive Rivalry
- 4.2. PESTEL analysis
- 4.3. BCG Analysis
- 4.3.1. Stars (High Growth, High Market Share)
- 4.3.2. Cash Cows (Low Growth, High Market Share)
- 4.3.3. Question Mark (High Growth, Low Market Share)
- 4.3.4. Dogs (Low Growth, Low Market Share)
- 4.4. Ansoff Matrix Analysis
- 4.5. Supply Chain Analysis
- 4.6. Regulatory Landscape
- 4.7. Current Market Potential and Opportunity Assessment (TAM–SAM–SOM Framework)
- 4.8. PRI Analyst Note
- 4.1. Porters Five Forces
- 5. Market Analysis, Insights and Forecast 2021-2033
- 5.1. Market Analysis, Insights and Forecast - by Type
- 5.1.1. Metalloc
- 5.1.2. Metallocene High-density Polyethylene (mHDPE)
- 5.1.3. Other Ty
- 5.2. Market Analysis, Insights and Forecast - by Application
- 5.2.1. Films
- 5.2.2. Sheets
- 5.2.3. Other Applications
- 5.3. Market Analysis, Insights and Forecast - by End-User Industry
- 5.3.1. Packaging
- 5.3.2. Agriculture
- 5.3.3. Automotive
- 5.3.4. Building and Construction
- 5.3.5. Other End-User Industries
- 5.4. Market Analysis, Insights and Forecast - by Region
- 5.4.1. Asia Pacific
- 5.4.2. North America
- 5.4.3. Europe
- 5.4.4. South America
- 5.4.5. Middle East
- 5.4.6. Saudi Arabia
- 5.1. Market Analysis, Insights and Forecast - by Type
- 6. Global MPE Industry Analysis, Insights and Forecast, 2021-2033
- 6.1. Market Analysis, Insights and Forecast - by Type
- 6.1.1. Metalloc
- 6.1.2. Metallocene High-density Polyethylene (mHDPE)
- 6.1.3. Other Ty
- 6.2. Market Analysis, Insights and Forecast - by Application
- 6.2.1. Films
- 6.2.2. Sheets
- 6.2.3. Other Applications
- 6.3. Market Analysis, Insights and Forecast - by End-User Industry
- 6.3.1. Packaging
- 6.3.2. Agriculture
- 6.3.3. Automotive
- 6.3.4. Building and Construction
- 6.3.5. Other End-User Industries
- 6.1. Market Analysis, Insights and Forecast - by Type
- 7. Asia Pacific MPE Industry Analysis, Insights and Forecast, 2020-2032
- 7.1. Market Analysis, Insights and Forecast - by Type
- 7.1.1. Metalloc
- 7.1.2. Metallocene High-density Polyethylene (mHDPE)
- 7.1.3. Other Ty
- 7.2. Market Analysis, Insights and Forecast - by Application
- 7.2.1. Films
- 7.2.2. Sheets
- 7.2.3. Other Applications
- 7.3. Market Analysis, Insights and Forecast - by End-User Industry
- 7.3.1. Packaging
- 7.3.2. Agriculture
- 7.3.3. Automotive
- 7.3.4. Building and Construction
- 7.3.5. Other End-User Industries
- 7.1. Market Analysis, Insights and Forecast - by Type
- 8. North America MPE Industry Analysis, Insights and Forecast, 2020-2032
- 8.1. Market Analysis, Insights and Forecast - by Type
- 8.1.1. Metalloc
- 8.1.2. Metallocene High-density Polyethylene (mHDPE)
- 8.1.3. Other Ty
- 8.2. Market Analysis, Insights and Forecast - by Application
- 8.2.1. Films
- 8.2.2. Sheets
- 8.2.3. Other Applications
- 8.3. Market Analysis, Insights and Forecast - by End-User Industry
- 8.3.1. Packaging
- 8.3.2. Agriculture
- 8.3.3. Automotive
- 8.3.4. Building and Construction
- 8.3.5. Other End-User Industries
- 8.1. Market Analysis, Insights and Forecast - by Type
- 9. Europe MPE Industry Analysis, Insights and Forecast, 2020-2032
- 9.1. Market Analysis, Insights and Forecast - by Type
- 9.1.1. Metalloc
- 9.1.2. Metallocene High-density Polyethylene (mHDPE)
- 9.1.3. Other Ty
- 9.2. Market Analysis, Insights and Forecast - by Application
- 9.2.1. Films
- 9.2.2. Sheets
- 9.2.3. Other Applications
- 9.3. Market Analysis, Insights and Forecast - by End-User Industry
- 9.3.1. Packaging
- 9.3.2. Agriculture
- 9.3.3. Automotive
- 9.3.4. Building and Construction
- 9.3.5. Other End-User Industries
- 9.1. Market Analysis, Insights and Forecast - by Type
- 10. South America MPE Industry Analysis, Insights and Forecast, 2020-2032
- 10.1. Market Analysis, Insights and Forecast - by Type
- 10.1.1. Metalloc
- 10.1.2. Metallocene High-density Polyethylene (mHDPE)
- 10.1.3. Other Ty
- 10.2. Market Analysis, Insights and Forecast - by Application
- 10.2.1. Films
- 10.2.2. Sheets
- 10.2.3. Other Applications
- 10.3. Market Analysis, Insights and Forecast - by End-User Industry
- 10.3.1. Packaging
- 10.3.2. Agriculture
- 10.3.3. Automotive
- 10.3.4. Building and Construction
- 10.3.5. Other End-User Industries
- 10.1. Market Analysis, Insights and Forecast - by Type
- 11. Middle East MPE Industry Analysis, Insights and Forecast, 2020-2032
- 11.1. Market Analysis, Insights and Forecast - by Type
- 11.1.1. Metalloc
- 11.1.2. Metallocene High-density Polyethylene (mHDPE)
- 11.1.3. Other Ty
- 11.2. Market Analysis, Insights and Forecast - by Application
- 11.2.1. Films
- 11.2.2. Sheets
- 11.2.3. Other Applications
- 11.3. Market Analysis, Insights and Forecast - by End-User Industry
- 11.3.1. Packaging
- 11.3.2. Agriculture
- 11.3.3. Automotive
- 11.3.4. Building and Construction
- 11.3.5. Other End-User Industries
- 11.1. Market Analysis, Insights and Forecast - by Type
- 12. Saudi Arabia MPE Industry Analysis, Insights and Forecast, 2020-2032
- 12.1. Market Analysis, Insights and Forecast - by Type
- 12.1.1. Metalloc
- 12.1.2. Metallocene High-density Polyethylene (mHDPE)
- 12.1.3. Other Ty
- 12.2. Market Analysis, Insights and Forecast - by Application
- 12.2.1. Films
- 12.2.2. Sheets
- 12.2.3. Other Applications
- 12.3. Market Analysis, Insights and Forecast - by End-User Industry
- 12.3.1. Packaging
- 12.3.2. Agriculture
- 12.3.3. Automotive
- 12.3.4. Building and Construction
- 12.3.5. Other End-User Industries
- 12.1. Market Analysis, Insights and Forecast - by Type
- 13. Competitive Analysis
- 13.1. Company Profiles
- 13.1.1 Braskem
- 13.1.1.1. Company Overview
- 13.1.1.2. Products
- 13.1.1.3. Company Financials
- 13.1.1.4. SWOT Analysis
- 13.1.2 Brentwood Plastics Inc
- 13.1.2.1. Company Overview
- 13.1.2.2. Products
- 13.1.2.3. Company Financials
- 13.1.2.4. SWOT Analysis
- 13.1.3 Chevron Phillips Chemical Company LLC
- 13.1.3.1. Company Overview
- 13.1.3.2. Products
- 13.1.3.3. Company Financials
- 13.1.3.4. SWOT Analysis
- 13.1.4 INEOS
- 13.1.4.1. Company Overview
- 13.1.4.2. Products
- 13.1.4.3. Company Financials
- 13.1.4.4. SWOT Analysis
- 13.1.5 Mitsui Chemicals Inc
- 13.1.5.1. Company Overview
- 13.1.5.2. Products
- 13.1.5.3. Company Financials
- 13.1.5.4. SWOT Analysis
- 13.1.6 Prime Polymer Co Ltd
- 13.1.6.1. Company Overview
- 13.1.6.2. Products
- 13.1.6.3. Company Financials
- 13.1.6.4. SWOT Analysis
- 13.1.7 SABIC
- 13.1.7.1. Company Overview
- 13.1.7.2. Products
- 13.1.7.3. Company Financials
- 13.1.7.4. SWOT Analysis
- 13.1.8 TotalEnergies
- 13.1.8.1. Company Overview
- 13.1.8.2. Products
- 13.1.8.3. Company Financials
- 13.1.8.4. SWOT Analysis
- 13.1.9 Univation Technologies LLC
- 13.1.9.1. Company Overview
- 13.1.9.2. Products
- 13.1.9.3. Company Financials
- 13.1.9.4. SWOT Analysis
- 13.1.10 W R Grace & Co -Conn*List Not Exhaustive
- 13.1.10.1. Company Overview
- 13.1.10.2. Products
- 13.1.10.3. Company Financials
- 13.1.10.4. SWOT Analysis
- 13.1.1 Braskem
- 13.2. Market Entropy
- 13.2.1 Company's Key Areas Served
- 13.2.2 Recent Developments
- 13.3. Company Market Share Analysis 2025
- 13.3.1 Top 5 Companies Market Share Analysis
- 13.3.2 Top 3 Companies Market Share Analysis
- 13.4. List of Potential Customers
- 14. Research Methodology
List of Figures
- Figure 1: Global MPE Industry Revenue Breakdown (Million, %) by Region 2025 & 2033
- Figure 2: Global MPE Industry Volume Breakdown (Billion, %) by Region 2025 & 2033
- Figure 3: Asia Pacific MPE Industry Revenue (Million), by Type 2025 & 2033
- Figure 4: Asia Pacific MPE Industry Volume (Billion), by Type 2025 & 2033
- Figure 5: Asia Pacific MPE Industry Revenue Share (%), by Type 2025 & 2033
- Figure 6: Asia Pacific MPE Industry Volume Share (%), by Type 2025 & 2033
- Figure 7: Asia Pacific MPE Industry Revenue (Million), by Application 2025 & 2033
- Figure 8: Asia Pacific MPE Industry Volume (Billion), by Application 2025 & 2033
- Figure 9: Asia Pacific MPE Industry Revenue Share (%), by Application 2025 & 2033
- Figure 10: Asia Pacific MPE Industry Volume Share (%), by Application 2025 & 2033
- Figure 11: Asia Pacific MPE Industry Revenue (Million), by End-User Industry 2025 & 2033
- Figure 12: Asia Pacific MPE Industry Volume (Billion), by End-User Industry 2025 & 2033
- Figure 13: Asia Pacific MPE Industry Revenue Share (%), by End-User Industry 2025 & 2033
- Figure 14: Asia Pacific MPE Industry Volume Share (%), by End-User Industry 2025 & 2033
- Figure 15: Asia Pacific MPE Industry Revenue (Million), by Country 2025 & 2033
- Figure 16: Asia Pacific MPE Industry Volume (Billion), by Country 2025 & 2033
- Figure 17: Asia Pacific MPE Industry Revenue Share (%), by Country 2025 & 2033
- Figure 18: Asia Pacific MPE Industry Volume Share (%), by Country 2025 & 2033
- Figure 19: North America MPE Industry Revenue (Million), by Type 2025 & 2033
- Figure 20: North America MPE Industry Volume (Billion), by Type 2025 & 2033
- Figure 21: North America MPE Industry Revenue Share (%), by Type 2025 & 2033
- Figure 22: North America MPE Industry Volume Share (%), by Type 2025 & 2033
- Figure 23: North America MPE Industry Revenue (Million), by Application 2025 & 2033
- Figure 24: North America MPE Industry Volume (Billion), by Application 2025 & 2033
- Figure 25: North America MPE Industry Revenue Share (%), by Application 2025 & 2033
- Figure 26: North America MPE Industry Volume Share (%), by Application 2025 & 2033
- Figure 27: North America MPE Industry Revenue (Million), by End-User Industry 2025 & 2033
- Figure 28: North America MPE Industry Volume (Billion), by End-User Industry 2025 & 2033
- Figure 29: North America MPE Industry Revenue Share (%), by End-User Industry 2025 & 2033
- Figure 30: North America MPE Industry Volume Share (%), by End-User Industry 2025 & 2033
- Figure 31: North America MPE Industry Revenue (Million), by Country 2025 & 2033
- Figure 32: North America MPE Industry Volume (Billion), by Country 2025 & 2033
- Figure 33: North America MPE Industry Revenue Share (%), by Country 2025 & 2033
- Figure 34: North America MPE Industry Volume Share (%), by Country 2025 & 2033
- Figure 35: Europe MPE Industry Revenue (Million), by Type 2025 & 2033
- Figure 36: Europe MPE Industry Volume (Billion), by Type 2025 & 2033
- Figure 37: Europe MPE Industry Revenue Share (%), by Type 2025 & 2033
- Figure 38: Europe MPE Industry Volume Share (%), by Type 2025 & 2033
- Figure 39: Europe MPE Industry Revenue (Million), by Application 2025 & 2033
- Figure 40: Europe MPE Industry Volume (Billion), by Application 2025 & 2033
- Figure 41: Europe MPE Industry Revenue Share (%), by Application 2025 & 2033
- Figure 42: Europe MPE Industry Volume Share (%), by Application 2025 & 2033
- Figure 43: Europe MPE Industry Revenue (Million), by End-User Industry 2025 & 2033
- Figure 44: Europe MPE Industry Volume (Billion), by End-User Industry 2025 & 2033
- Figure 45: Europe MPE Industry Revenue Share (%), by End-User Industry 2025 & 2033
- Figure 46: Europe MPE Industry Volume Share (%), by End-User Industry 2025 & 2033
- Figure 47: Europe MPE Industry Revenue (Million), by Country 2025 & 2033
- Figure 48: Europe MPE Industry Volume (Billion), by Country 2025 & 2033
- Figure 49: Europe MPE Industry Revenue Share (%), by Country 2025 & 2033
- Figure 50: Europe MPE Industry Volume Share (%), by Country 2025 & 2033
- Figure 51: South America MPE Industry Revenue (Million), by Type 2025 & 2033
- Figure 52: South America MPE Industry Volume (Billion), by Type 2025 & 2033
- Figure 53: South America MPE Industry Revenue Share (%), by Type 2025 & 2033
- Figure 54: South America MPE Industry Volume Share (%), by Type 2025 & 2033
- Figure 55: South America MPE Industry Revenue (Million), by Application 2025 & 2033
- Figure 56: South America MPE Industry Volume (Billion), by Application 2025 & 2033
- Figure 57: South America MPE Industry Revenue Share (%), by Application 2025 & 2033
- Figure 58: South America MPE Industry Volume Share (%), by Application 2025 & 2033
- Figure 59: South America MPE Industry Revenue (Million), by End-User Industry 2025 & 2033
- Figure 60: South America MPE Industry Volume (Billion), by End-User Industry 2025 & 2033
- Figure 61: South America MPE Industry Revenue Share (%), by End-User Industry 2025 & 2033
- Figure 62: South America MPE Industry Volume Share (%), by End-User Industry 2025 & 2033
- Figure 63: South America MPE Industry Revenue (Million), by Country 2025 & 2033
- Figure 64: South America MPE Industry Volume (Billion), by Country 2025 & 2033
- Figure 65: South America MPE Industry Revenue Share (%), by Country 2025 & 2033
- Figure 66: South America MPE Industry Volume Share (%), by Country 2025 & 2033
- Figure 67: Middle East MPE Industry Revenue (Million), by Type 2025 & 2033
- Figure 68: Middle East MPE Industry Volume (Billion), by Type 2025 & 2033
- Figure 69: Middle East MPE Industry Revenue Share (%), by Type 2025 & 2033
- Figure 70: Middle East MPE Industry Volume Share (%), by Type 2025 & 2033
- Figure 71: Middle East MPE Industry Revenue (Million), by Application 2025 & 2033
- Figure 72: Middle East MPE Industry Volume (Billion), by Application 2025 & 2033
- Figure 73: Middle East MPE Industry Revenue Share (%), by Application 2025 & 2033
- Figure 74: Middle East MPE Industry Volume Share (%), by Application 2025 & 2033
- Figure 75: Middle East MPE Industry Revenue (Million), by End-User Industry 2025 & 2033
- Figure 76: Middle East MPE Industry Volume (Billion), by End-User Industry 2025 & 2033
- Figure 77: Middle East MPE Industry Revenue Share (%), by End-User Industry 2025 & 2033
- Figure 78: Middle East MPE Industry Volume Share (%), by End-User Industry 2025 & 2033
- Figure 79: Middle East MPE Industry Revenue (Million), by Country 2025 & 2033
- Figure 80: Middle East MPE Industry Volume (Billion), by Country 2025 & 2033
- Figure 81: Middle East MPE Industry Revenue Share (%), by Country 2025 & 2033
- Figure 82: Middle East MPE Industry Volume Share (%), by Country 2025 & 2033
- Figure 83: Saudi Arabia MPE Industry Revenue (Million), by Type 2025 & 2033
- Figure 84: Saudi Arabia MPE Industry Volume (Billion), by Type 2025 & 2033
- Figure 85: Saudi Arabia MPE Industry Revenue Share (%), by Type 2025 & 2033
- Figure 86: Saudi Arabia MPE Industry Volume Share (%), by Type 2025 & 2033
- Figure 87: Saudi Arabia MPE Industry Revenue (Million), by Application 2025 & 2033
- Figure 88: Saudi Arabia MPE Industry Volume (Billion), by Application 2025 & 2033
- Figure 89: Saudi Arabia MPE Industry Revenue Share (%), by Application 2025 & 2033
- Figure 90: Saudi Arabia MPE Industry Volume Share (%), by Application 2025 & 2033
- Figure 91: Saudi Arabia MPE Industry Revenue (Million), by End-User Industry 2025 & 2033
- Figure 92: Saudi Arabia MPE Industry Volume (Billion), by End-User Industry 2025 & 2033
- Figure 93: Saudi Arabia MPE Industry Revenue Share (%), by End-User Industry 2025 & 2033
- Figure 94: Saudi Arabia MPE Industry Volume Share (%), by End-User Industry 2025 & 2033
- Figure 95: Saudi Arabia MPE Industry Revenue (Million), by Country 2025 & 2033
- Figure 96: Saudi Arabia MPE Industry Volume (Billion), by Country 2025 & 2033
- Figure 97: Saudi Arabia MPE Industry Revenue Share (%), by Country 2025 & 2033
- Figure 98: Saudi Arabia MPE Industry Volume Share (%), by Country 2025 & 2033
List of Tables
- Table 1: Global MPE Industry Revenue Million Forecast, by Type 2020 & 2033
- Table 2: Global MPE Industry Volume Billion Forecast, by Type 2020 & 2033
- Table 3: Global MPE Industry Revenue Million Forecast, by Application 2020 & 2033
- Table 4: Global MPE Industry Volume Billion Forecast, by Application 2020 & 2033
- Table 5: Global MPE Industry Revenue Million Forecast, by End-User Industry 2020 & 2033
- Table 6: Global MPE Industry Volume Billion Forecast, by End-User Industry 2020 & 2033
- Table 7: Global MPE Industry Revenue Million Forecast, by Region 2020 & 2033
- Table 8: Global MPE Industry Volume Billion Forecast, by Region 2020 & 2033
- Table 9: Global MPE Industry Revenue Million Forecast, by Type 2020 & 2033
- Table 10: Global MPE Industry Volume Billion Forecast, by Type 2020 & 2033
- Table 11: Global MPE Industry Revenue Million Forecast, by Application 2020 & 2033
- Table 12: Global MPE Industry Volume Billion Forecast, by Application 2020 & 2033
- Table 13: Global MPE Industry Revenue Million Forecast, by End-User Industry 2020 & 2033
- Table 14: Global MPE Industry Volume Billion Forecast, by End-User Industry 2020 & 2033
- Table 15: Global MPE Industry Revenue Million Forecast, by Country 2020 & 2033
- Table 16: Global MPE Industry Volume Billion Forecast, by Country 2020 & 2033
- Table 17: China MPE Industry Revenue (Million) Forecast, by Application 2020 & 2033
- Table 18: China MPE Industry Volume (Billion) Forecast, by Application 2020 & 2033
- Table 19: India MPE Industry Revenue (Million) Forecast, by Application 2020 & 2033
- Table 20: India MPE Industry Volume (Billion) Forecast, by Application 2020 & 2033
- Table 21: Japan MPE Industry Revenue (Million) Forecast, by Application 2020 & 2033
- Table 22: Japan MPE Industry Volume (Billion) Forecast, by Application 2020 & 2033
- Table 23: South Korea MPE Industry Revenue (Million) Forecast, by Application 2020 & 2033
- Table 24: South Korea MPE Industry Volume (Billion) Forecast, by Application 2020 & 2033
- Table 25: Rest of Asia Pacific MPE Industry Revenue (Million) Forecast, by Application 2020 & 2033
- Table 26: Rest of Asia Pacific MPE Industry Volume (Billion) Forecast, by Application 2020 & 2033
- Table 27: Global MPE Industry Revenue Million Forecast, by Type 2020 & 2033
- Table 28: Global MPE Industry Volume Billion Forecast, by Type 2020 & 2033
- Table 29: Global MPE Industry Revenue Million Forecast, by Application 2020 & 2033
- Table 30: Global MPE Industry Volume Billion Forecast, by Application 2020 & 2033
- Table 31: Global MPE Industry Revenue Million Forecast, by End-User Industry 2020 & 2033
- Table 32: Global MPE Industry Volume Billion Forecast, by End-User Industry 2020 & 2033
- Table 33: Global MPE Industry Revenue Million Forecast, by Country 2020 & 2033
- Table 34: Global MPE Industry Volume Billion Forecast, by Country 2020 & 2033
- Table 35: United States MPE Industry Revenue (Million) Forecast, by Application 2020 & 2033
- Table 36: United States MPE Industry Volume (Billion) Forecast, by Application 2020 & 2033
- Table 37: Canada MPE Industry Revenue (Million) Forecast, by Application 2020 & 2033
- Table 38: Canada MPE Industry Volume (Billion) Forecast, by Application 2020 & 2033
- Table 39: Mexico MPE Industry Revenue (Million) Forecast, by Application 2020 & 2033
- Table 40: Mexico MPE Industry Volume (Billion) Forecast, by Application 2020 & 2033
- Table 41: Global MPE Industry Revenue Million Forecast, by Type 2020 & 2033
- Table 42: Global MPE Industry Volume Billion Forecast, by Type 2020 & 2033
- Table 43: Global MPE Industry Revenue Million Forecast, by Application 2020 & 2033
- Table 44: Global MPE Industry Volume Billion Forecast, by Application 2020 & 2033
- Table 45: Global MPE Industry Revenue Million Forecast, by End-User Industry 2020 & 2033
- Table 46: Global MPE Industry Volume Billion Forecast, by End-User Industry 2020 & 2033
- Table 47: Global MPE Industry Revenue Million Forecast, by Country 2020 & 2033
- Table 48: Global MPE Industry Volume Billion Forecast, by Country 2020 & 2033
- Table 49: Germany MPE Industry Revenue (Million) Forecast, by Application 2020 & 2033
- Table 50: Germany MPE Industry Volume (Billion) Forecast, by Application 2020 & 2033
- Table 51: United Kingdom MPE Industry Revenue (Million) Forecast, by Application 2020 & 2033
- Table 52: United Kingdom MPE Industry Volume (Billion) Forecast, by Application 2020 & 2033
- Table 53: Italy MPE Industry Revenue (Million) Forecast, by Application 2020 & 2033
- Table 54: Italy MPE Industry Volume (Billion) Forecast, by Application 2020 & 2033
- Table 55: France MPE Industry Revenue (Million) Forecast, by Application 2020 & 2033
- Table 56: France MPE Industry Volume (Billion) Forecast, by Application 2020 & 2033
- Table 57: Rest of Europe MPE Industry Revenue (Million) Forecast, by Application 2020 & 2033
- Table 58: Rest of Europe MPE Industry Volume (Billion) Forecast, by Application 2020 & 2033
- Table 59: Global MPE Industry Revenue Million Forecast, by Type 2020 & 2033
- Table 60: Global MPE Industry Volume Billion Forecast, by Type 2020 & 2033
- Table 61: Global MPE Industry Revenue Million Forecast, by Application 2020 & 2033
- Table 62: Global MPE Industry Volume Billion Forecast, by Application 2020 & 2033
- Table 63: Global MPE Industry Revenue Million Forecast, by End-User Industry 2020 & 2033
- Table 64: Global MPE Industry Volume Billion Forecast, by End-User Industry 2020 & 2033
- Table 65: Global MPE Industry Revenue Million Forecast, by Country 2020 & 2033
- Table 66: Global MPE Industry Volume Billion Forecast, by Country 2020 & 2033
- Table 67: Brazil MPE Industry Revenue (Million) Forecast, by Application 2020 & 2033
- Table 68: Brazil MPE Industry Volume (Billion) Forecast, by Application 2020 & 2033
- Table 69: Argentina MPE Industry Revenue (Million) Forecast, by Application 2020 & 2033
- Table 70: Argentina MPE Industry Volume (Billion) Forecast, by Application 2020 & 2033
- Table 71: Rest of South America MPE Industry Revenue (Million) Forecast, by Application 2020 & 2033
- Table 72: Rest of South America MPE Industry Volume (Billion) Forecast, by Application 2020 & 2033
- Table 73: Global MPE Industry Revenue Million Forecast, by Type 2020 & 2033
- Table 74: Global MPE Industry Volume Billion Forecast, by Type 2020 & 2033
- Table 75: Global MPE Industry Revenue Million Forecast, by Application 2020 & 2033
- Table 76: Global MPE Industry Volume Billion Forecast, by Application 2020 & 2033
- Table 77: Global MPE Industry Revenue Million Forecast, by End-User Industry 2020 & 2033
- Table 78: Global MPE Industry Volume Billion Forecast, by End-User Industry 2020 & 2033
- Table 79: Global MPE Industry Revenue Million Forecast, by Country 2020 & 2033
- Table 80: Global MPE Industry Volume Billion Forecast, by Country 2020 & 2033
- Table 81: Global MPE Industry Revenue Million Forecast, by Type 2020 & 2033
- Table 82: Global MPE Industry Volume Billion Forecast, by Type 2020 & 2033
- Table 83: Global MPE Industry Revenue Million Forecast, by Application 2020 & 2033
- Table 84: Global MPE Industry Volume Billion Forecast, by Application 2020 & 2033
- Table 85: Global MPE Industry Revenue Million Forecast, by End-User Industry 2020 & 2033
- Table 86: Global MPE Industry Volume Billion Forecast, by End-User Industry 2020 & 2033
- Table 87: Global MPE Industry Revenue Million Forecast, by Country 2020 & 2033
- Table 88: Global MPE Industry Volume Billion Forecast, by Country 2020 & 2033
- Table 89: South Africa MPE Industry Revenue (Million) Forecast, by Application 2020 & 2033
- Table 90: South Africa MPE Industry Volume (Billion) Forecast, by Application 2020 & 2033
- Table 91: Rest of Middle East MPE Industry Revenue (Million) Forecast, by Application 2020 & 2033
- Table 92: Rest of Middle East MPE Industry Volume (Billion) Forecast, by Application 2020 & 2033
Frequently Asked Questions
1. What is the projected Compound Annual Growth Rate (CAGR) of the MPE Industry?
The projected CAGR is approximately 4.63%.
2. Which companies are prominent players in the MPE Industry?
Key companies in the market include Braskem, Brentwood Plastics Inc, Chevron Phillips Chemical Company LLC, INEOS, Mitsui Chemicals Inc, Prime Polymer Co Ltd, SABIC, TotalEnergies, Univation Technologies LLC, W R Grace & Co -Conn*List Not Exhaustive.
3. What are the main segments of the MPE Industry?
The market segments include Type, Application, End-User Industry.
4. Can you provide details about the market size?
The market size is estimated to be USD 21.82 Million as of 2022.
5. What are some drivers contributing to market growth?
Growing Demand for mPE from Various End User Industries; Surge in Adoption of Films and Sheets in Packaging Industry; Other Drivers.
6. What are the notable trends driving market growth?
Increasing Demand for mPE from Packaging Industry.
7. Are there any restraints impacting market growth?
Growing Demand for mPE from Various End User Industries; Surge in Adoption of Films and Sheets in Packaging Industry; Other Drivers.
8. Can you provide examples of recent developments in the market?
August 2022: SABIC SK Nexlene Company (SSNC), a joint venture of SABIC and SK Geo Centric, announced plans to expand the capacity of its Ulsan plant to produce mPE to address the growing demand from applications in solar panels, vehicles, footwear, and flexible packaging.
9. What pricing options are available for accessing the report?
Pricing options include single-user, multi-user, and enterprise licenses priced at USD 4750, USD 5250, and USD 8750 respectively.
10. Is the market size provided in terms of value or volume?
The market size is provided in terms of value, measured in Million and volume, measured in Billion.
11. Are there any specific market keywords associated with the report?
Yes, the market keyword associated with the report is "MPE Industry," which aids in identifying and referencing the specific market segment covered.
12. How do I determine which pricing option suits my needs best?
The pricing options vary based on user requirements and access needs. Individual users may opt for single-user licenses, while businesses requiring broader access may choose multi-user or enterprise licenses for cost-effective access to the report.
13. Are there any additional resources or data provided in the MPE Industry report?
While the report offers comprehensive insights, it's advisable to review the specific contents or supplementary materials provided to ascertain if additional resources or data are available.
14. How can I stay updated on further developments or reports in the MPE Industry?
To stay informed about further developments, trends, and reports in the MPE Industry, consider subscribing to industry newsletters, following relevant companies and organizations, or regularly checking reputable industry news sources and publications.
Methodology
Step 1 - Identification of Relevant Samples Size from Population Database


Step 2 - Approaches for Defining Global Market Size (Value, Volume* & Price*)

Note*: In applicable scenarios
Step 3 - Data Sources
Primary Research
- Web Analytics
- Survey Reports
- Research Institute
- Latest Research Reports
- Opinion Leaders
Secondary Research
- Annual Reports
- White Paper
- Latest Press Release
- Industry Association
- Paid Database
- Investor Presentations

Step 4 - Data Triangulation
Involves using different sources of information in order to increase the validity of a study
These sources are likely to be stakeholders in a program - participants, other researchers, program staff, other community members, and so on.
Then we put all data in single framework & apply various statistical tools to find out the dynamic on the market.
During the analysis stage, feedback from the stakeholder groups would be compared to determine areas of agreement as well as areas of divergence