

Key Insights
The global nanofiber market is poised for significant expansion, projecting a Compound Annual Growth Rate (CAGR) of 11.1% from 2025 to 2033. This upward trajectory is propelled by escalating demand across critical sectors, including advanced filtration for water and air purification, lightweight automotive components, high-performance textiles, and innovative biomedical devices. The integration of nanofibers into energy storage solutions, such as lithium-ion batteries and supercapacitors, further bolsters market growth. Continuous technological advancements facilitating cost-effective, high-quality nanofiber production are also key drivers. Carbon and polymeric nanofibers, in particular, exhibit strong growth due to their extensive application versatility. While regulatory considerations and potential nanomaterial health concerns present challenges, ongoing research and development in safety and sustainability are actively addressing these issues. Geographically, North America and Asia-Pacific are leading regions, supported by substantial R&D investments and robust manufacturing infrastructure. The market is characterized by intense competition among established corporations and agile, innovative startups.
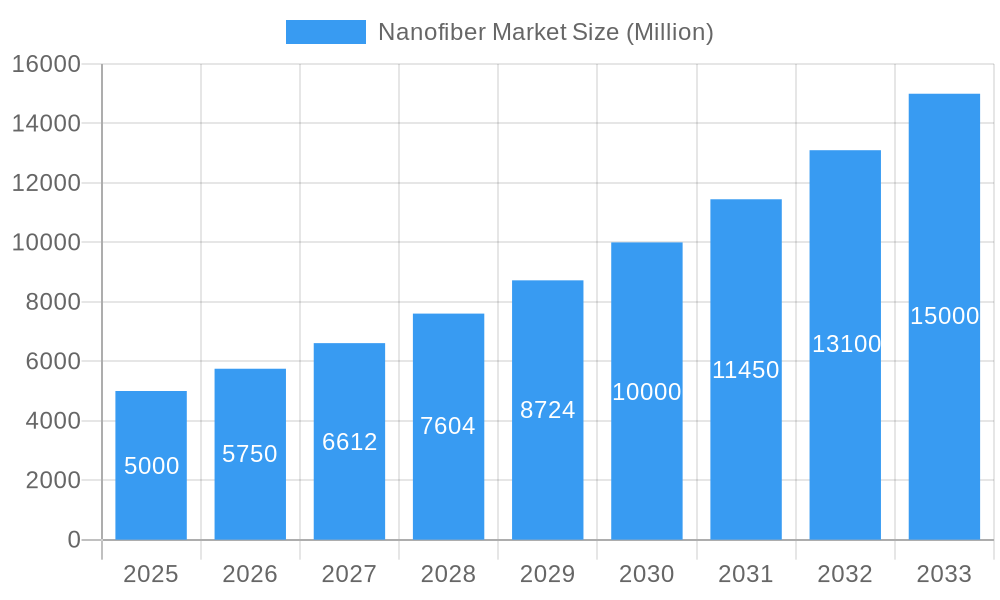
Nanofiber Market Market Size (In Billion)
Market segmentation highlights robust demand across diverse applications. Water and air filtration stands out due to the exceptional efficacy of nanofibers in capturing microscopic contaminants. The automotive sector benefits from nanofibers in developing lightweight, durable components, enhancing fuel efficiency and vehicle performance. In the medical field, nanofibers are integral to drug delivery, tissue engineering, and wound healing, owing to their biocompatibility and large surface area. The electronics industry leverages nanofibers for flexible displays, sensors, and energy harvesting devices, fostering miniaturization and improved performance. The estimated market size in 2025 is $2.21 billion. Future growth will be significantly influenced by the industry's commitment to sustainability and the development of eco-friendly production processes.
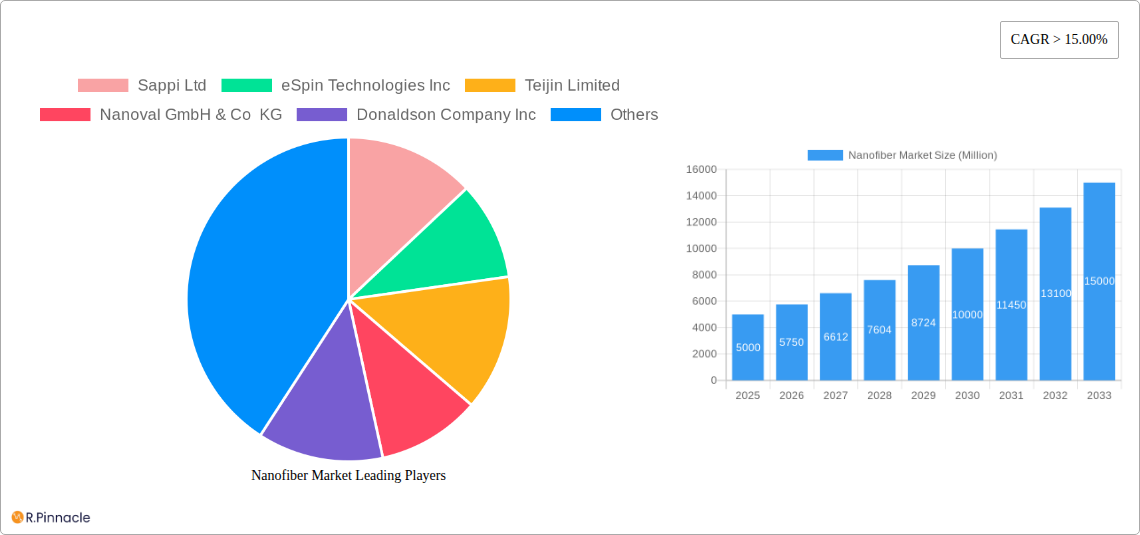
Nanofiber Market Company Market Share
Nanofiber Market Report: 2019-2033
This comprehensive report provides an in-depth analysis of the global nanofiber market, offering valuable insights for industry professionals, investors, and researchers. With a study period spanning 2019-2033, a base year of 2025, and a forecast period of 2025-2033, this report meticulously examines market dynamics, key players, and future growth opportunities. The report utilizes data from the historical period (2019-2024) to project future trends accurately. The total market size is predicted to reach xx Million by 2033.
Nanofiber Market Structure & Innovation Trends
The nanofiber market exhibits a moderately concentrated structure, with several key players holding significant market share. However, the entry of new players and continuous innovations are fostering increased competition. Market concentration is estimated at xx%, with the top five players accounting for approximately xx Million in revenue in 2025. Innovation is driven by advancements in nanofiber production techniques, material science, and application development. Regulatory frameworks vary across regions, impacting market growth and adoption. Product substitutes, such as traditional filtration materials, pose a challenge, but the unique properties of nanofibers, including high surface area and porosity, provide a competitive edge. End-user demographics are diverse, encompassing various industries.
- Market Share: Top 5 players hold xx% of the market.
- M&A Activity: The past five years have seen xx M&A deals, with a total value exceeding xx Million. Significant deals include [Insert specific deal examples if data available, otherwise, use “data unavailable”].
- Innovation Drivers: Advancements in electrospinning, melt blowing, and solution blow spinning techniques are significantly contributing to the expansion of the nanofiber market.
- Regulatory Landscape: Stringent regulations regarding the safety and environmental impact of nanomaterials are expected to influence market growth in certain regions.
Nanofiber Market Dynamics & Trends
The nanofiber market is experiencing robust growth, driven by increasing demand across diverse applications. The Compound Annual Growth Rate (CAGR) during the forecast period (2025-2033) is projected to be xx%. Technological disruptions, such as the development of new production methods and functionalized nanofibers, are accelerating market penetration. Consumer preferences are shifting towards sustainable and high-performance materials, further fueling market demand. Competitive dynamics are characterized by intense rivalry among established players and emerging companies, driving innovation and price competition. Market penetration is highest in the Water and Air Filtration segment, and is expected to increase in the Automotive and Transportation segments as well.
Dominant Regions & Segments in Nanofiber Market
The Asia Pacific region is expected to dominate the nanofiber market during the forecast period, driven by strong economic growth, increasing industrialization, and supportive government policies. Significant growth is also anticipated in North America and Europe, although at a slower rate.
Leading Product Types:
- Polymeric Nanofibers: This segment holds the largest market share due to their versatility and cost-effectiveness in various applications. Growth is driven by advancements in polymer chemistry and production techniques.
- Carbon Nanofibers: This segment is experiencing high growth due to their excellent mechanical, electrical, and thermal properties, making them suitable for high-performance applications in electronics and energy storage.
Leading Applications:
- Water and Air Filtration: This segment dominates due to the superior filtration efficiency of nanofibers. Government regulations concerning air and water quality are propelling growth in this sector.
- Medical: Growing demand for advanced wound dressings, drug delivery systems, and tissue engineering applications is driving significant growth in the medical segment.
Key Drivers (by region - Examples):
- Asia Pacific: Rapid industrialization, increasing disposable income, and supportive government policies promoting technological advancements.
- North America: Focus on environmental protection, coupled with substantial investments in R&D.
- Europe: Stringent environmental regulations and the growing adoption of sustainable materials.
Nanofiber Market Product Innovations
Recent innovations in nanofiber technology focus on improving material properties, such as strength, conductivity, and biocompatibility. These advancements have expanded applications in diverse fields, including biomedical devices, energy storage, and advanced composites. The development of functionalized nanofibers with specific properties is a significant trend, allowing for tailored solutions across various industries. The market is seeing increasing competition based on superior performance, cost-effectiveness, and ease of processing.
Report Scope & Segmentation Analysis
This report provides a comprehensive segmentation analysis of the nanofiber market across various product types and applications. Detailed market size estimations, growth projections, and competitive dynamics are provided for each segment.
Product Type: Carbon Nanofiber, Composite Nanofiber, Metal and Metal Oxide Nanofiber, Polymeric Nanofiber, Carbohydrate-based Nanofiber, Ceramic Nanofiber. Each segment shows varying growth rates based on application and material advancements. Polymeric nanofibers dominate due to their versatility.
Application: Water and Air Filtration, Automotive and Transportation, Textiles, Medical, Electronics, Energy Storage, Other Applications. The Water and Air Filtration and Medical applications are currently the largest, but the Automotive and Transportation sectors are predicted for strong growth.
Key Drivers of Nanofiber Market Growth
Technological advancements in nanofiber production, material science, and application development are key drivers. The increasing demand for high-performance materials across various industries is another major factor. Stringent environmental regulations promoting sustainable solutions are also contributing significantly. Government initiatives supporting R&D and technological innovation further accelerate market expansion. For example, the increasing demand for filtration technologies due to rising air pollution levels is creating significant opportunities.
Challenges in the Nanofiber Market Sector
High production costs and scalability challenges remain significant barriers. Inconsistencies in nanofiber quality and reproducibility pose challenges. The potential environmental and health impacts of nanomaterials necessitate thorough safety assessments and regulatory compliance. Competition from existing materials, along with price pressures, also influence market growth. For instance, the high cost of production can limit the accessibility of some nanofiber products, especially in developing countries.
Emerging Opportunities in Nanofiber Market
Emerging opportunities lie in developing novel nanofiber materials with enhanced properties and exploring new applications. The increasing integration of nanofibers in advanced composites and energy storage devices presents significant potential. The growing demand for sustainable and eco-friendly materials opens up new market avenues. Government support for research and development in nanotechnology is expected to accelerate growth.
Leading Players in the Nanofiber Market Market
- Sappi Ltd
- eSpin Technologies Inc
- Teijin Limited
- Nanoval GmbH & Co KG
- Donaldson Company Inc
- Applied Sciences Inc
- Toray Industries Inc
- Esfil Tehno AS
- IREMA-Filter GmbH
- Spur AS
- Nanofiber Solutions
- LIME
- NanoLayr Limited
- DuPont
- Merck KgAA
- Chuetsu Pulp & Paper Co Ltd
- Hollingsworth & Vose Company
- Nippon Paper Industries Co Ltd
- SNC Fibers
- US Global Nanospace Inc
- Argonide Corporation
- Pardam SRO
- Japan Vilene Company Ltd
Key Developments in Nanofiber Market Industry
- April 2021: Teijin Limited developed a new technology to mass-produce a new version of NANOFRONT nanofibers, enhancing its market competitiveness.
- January 2021: Pardam developed and started producing the world's first nanofiber FFP3 respirator, marking a significant advancement in personal protective equipment.
Future Outlook for Nanofiber Market Market
The nanofiber market is poised for continued strong growth, driven by technological advancements, increasing demand across various applications, and supportive government policies. Strategic collaborations, investments in R&D, and the development of innovative nanofiber-based products are expected to accelerate market expansion. The market is predicted to reach xx Million by 2033, offering substantial opportunities for industry players.
Nanofiber Market Segmentation
-
1. Product Type
- 1.1. Carbon Nanofiber
- 1.2. Composite Nanofiber
- 1.3. Metal and Metal Oxide Nanofiber
- 1.4. Polymeric Nanofiber
- 1.5. Carbohydrate-based Nanofiber
- 1.6. Ceramic Nanofiber
-
2. Application
- 2.1. Water and Air Filtration
- 2.2. Automotive and Transportation
- 2.3. Textiles
- 2.4. Medical
- 2.5. Electronics
- 2.6. Energy Storage
- 2.7. Other Applications
Nanofiber Market Segmentation By Geography
-
1. Asia Pacific
- 1.1. China
- 1.2. India
- 1.3. Japan
- 1.4. South Korea
- 1.5. Rest of Asia Pacific
-
2. North America
- 2.1. United States
- 2.2. Canada
- 2.3. Mexico
-
3. Europe
- 3.1. Germany
- 3.2. United Kingdom
- 3.3. France
- 3.4. Italy
- 3.5. Rest of Europe
-
4. Rest of the World
- 4.1. South America
- 4.2. Middle East and Africa
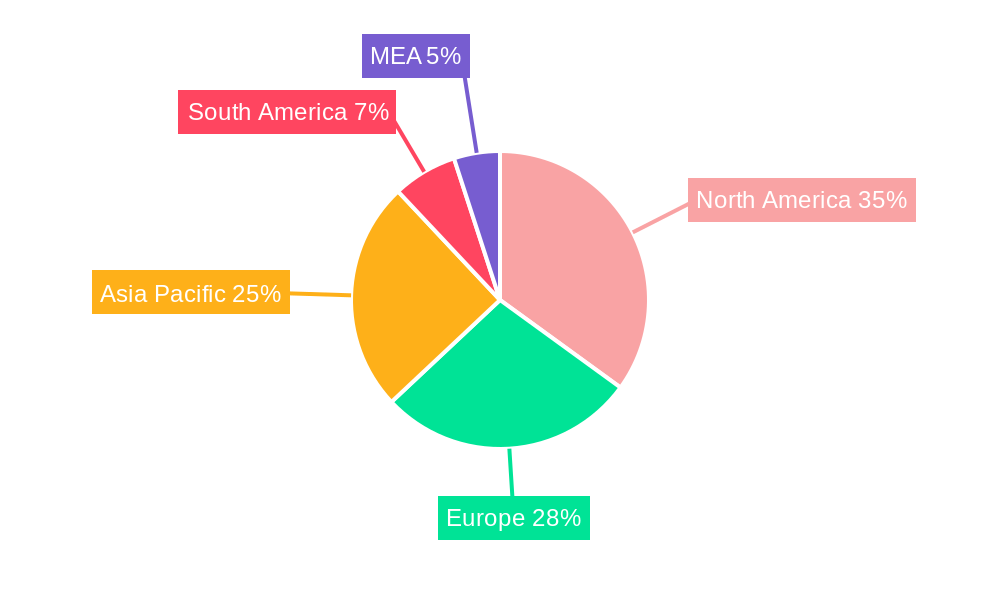
Nanofiber Market Regional Market Share
Geographic Coverage of Nanofiber Market
Nanofiber Market REPORT HIGHLIGHTS
| Aspects | Details |
|---|---|
| Study Period | 2020-2034 |
| Base Year | 2025 |
| Estimated Year | 2026 |
| Forecast Period | 2026-2034 |
| Historical Period | 2020-2025 |
| Growth Rate | CAGR of 11.1% from 2020-2034 |
| Segmentation |
|
Table of Contents
- 1. Introduction
- 1.1. Research Scope
- 1.2. Market Segmentation
- 1.3. Research Objective
- 1.4. Definitions and Assumptions
- 2. Executive Summary
- 2.1. Market Snapshot
- 3. Market Dynamics
- 3.1. Market Drivers
- 3.2. Market Restrains
- 3.3. Market Trends
- 3.4. Market Opportunities
- 4. Market Factor Analysis
- 4.1. Porters Five Forces
- 4.1.1. Bargaining Power of Suppliers
- 4.1.2. Bargaining Power of Buyers
- 4.1.3. Threat of New Entrants
- 4.1.4. Threat of Substitutes
- 4.1.5. Competitive Rivalry
- 4.2. PESTEL analysis
- 4.3. BCG Analysis
- 4.3.1. Stars (High Growth, High Market Share)
- 4.3.2. Cash Cows (Low Growth, High Market Share)
- 4.3.3. Question Mark (High Growth, Low Market Share)
- 4.3.4. Dogs (Low Growth, Low Market Share)
- 4.4. Ansoff Matrix Analysis
- 4.5. Supply Chain Analysis
- 4.6. Regulatory Landscape
- 4.7. Current Market Potential and Opportunity Assessment (TAM–SAM–SOM Framework)
- 4.8. PRI Analyst Note
- 4.1. Porters Five Forces
- 5. Market Analysis, Insights and Forecast 2021-2033
- 5.1. Market Analysis, Insights and Forecast - by Product Type
- 5.1.1. Carbon Nanofiber
- 5.1.2. Composite Nanofiber
- 5.1.3. Metal and Metal Oxide Nanofiber
- 5.1.4. Polymeric Nanofiber
- 5.1.5. Carbohydrate-based Nanofiber
- 5.1.6. Ceramic Nanofiber
- 5.2. Market Analysis, Insights and Forecast - by Application
- 5.2.1. Water and Air Filtration
- 5.2.2. Automotive and Transportation
- 5.2.3. Textiles
- 5.2.4. Medical
- 5.2.5. Electronics
- 5.2.6. Energy Storage
- 5.2.7. Other Applications
- 5.3. Market Analysis, Insights and Forecast - by Region
- 5.3.1. Asia Pacific
- 5.3.2. North America
- 5.3.3. Europe
- 5.3.4. Rest of the World
- 5.1. Market Analysis, Insights and Forecast - by Product Type
- 6. Global Nanofiber Market Analysis, Insights and Forecast, 2021-2033
- 6.1. Market Analysis, Insights and Forecast - by Product Type
- 6.1.1. Carbon Nanofiber
- 6.1.2. Composite Nanofiber
- 6.1.3. Metal and Metal Oxide Nanofiber
- 6.1.4. Polymeric Nanofiber
- 6.1.5. Carbohydrate-based Nanofiber
- 6.1.6. Ceramic Nanofiber
- 6.2. Market Analysis, Insights and Forecast - by Application
- 6.2.1. Water and Air Filtration
- 6.2.2. Automotive and Transportation
- 6.2.3. Textiles
- 6.2.4. Medical
- 6.2.5. Electronics
- 6.2.6. Energy Storage
- 6.2.7. Other Applications
- 6.1. Market Analysis, Insights and Forecast - by Product Type
- 7. Asia Pacific Nanofiber Market Analysis, Insights and Forecast, 2020-2032
- 7.1. Market Analysis, Insights and Forecast - by Product Type
- 7.1.1. Carbon Nanofiber
- 7.1.2. Composite Nanofiber
- 7.1.3. Metal and Metal Oxide Nanofiber
- 7.1.4. Polymeric Nanofiber
- 7.1.5. Carbohydrate-based Nanofiber
- 7.1.6. Ceramic Nanofiber
- 7.2. Market Analysis, Insights and Forecast - by Application
- 7.2.1. Water and Air Filtration
- 7.2.2. Automotive and Transportation
- 7.2.3. Textiles
- 7.2.4. Medical
- 7.2.5. Electronics
- 7.2.6. Energy Storage
- 7.2.7. Other Applications
- 7.1. Market Analysis, Insights and Forecast - by Product Type
- 8. North America Nanofiber Market Analysis, Insights and Forecast, 2020-2032
- 8.1. Market Analysis, Insights and Forecast - by Product Type
- 8.1.1. Carbon Nanofiber
- 8.1.2. Composite Nanofiber
- 8.1.3. Metal and Metal Oxide Nanofiber
- 8.1.4. Polymeric Nanofiber
- 8.1.5. Carbohydrate-based Nanofiber
- 8.1.6. Ceramic Nanofiber
- 8.2. Market Analysis, Insights and Forecast - by Application
- 8.2.1. Water and Air Filtration
- 8.2.2. Automotive and Transportation
- 8.2.3. Textiles
- 8.2.4. Medical
- 8.2.5. Electronics
- 8.2.6. Energy Storage
- 8.2.7. Other Applications
- 8.1. Market Analysis, Insights and Forecast - by Product Type
- 9. Europe Nanofiber Market Analysis, Insights and Forecast, 2020-2032
- 9.1. Market Analysis, Insights and Forecast - by Product Type
- 9.1.1. Carbon Nanofiber
- 9.1.2. Composite Nanofiber
- 9.1.3. Metal and Metal Oxide Nanofiber
- 9.1.4. Polymeric Nanofiber
- 9.1.5. Carbohydrate-based Nanofiber
- 9.1.6. Ceramic Nanofiber
- 9.2. Market Analysis, Insights and Forecast - by Application
- 9.2.1. Water and Air Filtration
- 9.2.2. Automotive and Transportation
- 9.2.3. Textiles
- 9.2.4. Medical
- 9.2.5. Electronics
- 9.2.6. Energy Storage
- 9.2.7. Other Applications
- 9.1. Market Analysis, Insights and Forecast - by Product Type
- 10. Rest of the World Nanofiber Market Analysis, Insights and Forecast, 2020-2032
- 10.1. Market Analysis, Insights and Forecast - by Product Type
- 10.1.1. Carbon Nanofiber
- 10.1.2. Composite Nanofiber
- 10.1.3. Metal and Metal Oxide Nanofiber
- 10.1.4. Polymeric Nanofiber
- 10.1.5. Carbohydrate-based Nanofiber
- 10.1.6. Ceramic Nanofiber
- 10.2. Market Analysis, Insights and Forecast - by Application
- 10.2.1. Water and Air Filtration
- 10.2.2. Automotive and Transportation
- 10.2.3. Textiles
- 10.2.4. Medical
- 10.2.5. Electronics
- 10.2.6. Energy Storage
- 10.2.7. Other Applications
- 10.1. Market Analysis, Insights and Forecast - by Product Type
- 11. Competitive Analysis
- 11.1. Company Profiles
- 11.1.1 Sappi Ltd
- 11.1.1.1. Company Overview
- 11.1.1.2. Products
- 11.1.1.3. Company Financials
- 11.1.1.4. SWOT Analysis
- 11.1.2 eSpin Technologies Inc
- 11.1.2.1. Company Overview
- 11.1.2.2. Products
- 11.1.2.3. Company Financials
- 11.1.2.4. SWOT Analysis
- 11.1.3 Teijin Limited
- 11.1.3.1. Company Overview
- 11.1.3.2. Products
- 11.1.3.3. Company Financials
- 11.1.3.4. SWOT Analysis
- 11.1.4 Nanoval GmbH & Co KG
- 11.1.4.1. Company Overview
- 11.1.4.2. Products
- 11.1.4.3. Company Financials
- 11.1.4.4. SWOT Analysis
- 11.1.5 Donaldson Company Inc
- 11.1.5.1. Company Overview
- 11.1.5.2. Products
- 11.1.5.3. Company Financials
- 11.1.5.4. SWOT Analysis
- 11.1.6 Applied Sciences Inc
- 11.1.6.1. Company Overview
- 11.1.6.2. Products
- 11.1.6.3. Company Financials
- 11.1.6.4. SWOT Analysis
- 11.1.7 Toray Industries Inc
- 11.1.7.1. Company Overview
- 11.1.7.2. Products
- 11.1.7.3. Company Financials
- 11.1.7.4. SWOT Analysis
- 11.1.8 Esfil Tehno AS
- 11.1.8.1. Company Overview
- 11.1.8.2. Products
- 11.1.8.3. Company Financials
- 11.1.8.4. SWOT Analysis
- 11.1.9 IREMA-Filter GmbH
- 11.1.9.1. Company Overview
- 11.1.9.2. Products
- 11.1.9.3. Company Financials
- 11.1.9.4. SWOT Analysis
- 11.1.10 Spur AS
- 11.1.10.1. Company Overview
- 11.1.10.2. Products
- 11.1.10.3. Company Financials
- 11.1.10.4. SWOT Analysis
- 11.1.11 Nanofiber Solutions
- 11.1.11.1. Company Overview
- 11.1.11.2. Products
- 11.1.11.3. Company Financials
- 11.1.11.4. SWOT Analysis
- 11.1.12 LIME
- 11.1.12.1. Company Overview
- 11.1.12.2. Products
- 11.1.12.3. Company Financials
- 11.1.12.4. SWOT Analysis
- 11.1.13 NanoLayr Limited
- 11.1.13.1. Company Overview
- 11.1.13.2. Products
- 11.1.13.3. Company Financials
- 11.1.13.4. SWOT Analysis
- 11.1.14 DuPont
- 11.1.14.1. Company Overview
- 11.1.14.2. Products
- 11.1.14.3. Company Financials
- 11.1.14.4. SWOT Analysis
- 11.1.15 Merck KgAA
- 11.1.15.1. Company Overview
- 11.1.15.2. Products
- 11.1.15.3. Company Financials
- 11.1.15.4. SWOT Analysis
- 11.1.16 Chuetsu Pulp & Paper Co Ltd
- 11.1.16.1. Company Overview
- 11.1.16.2. Products
- 11.1.16.3. Company Financials
- 11.1.16.4. SWOT Analysis
- 11.1.17 Hollingsworth & Vose Company
- 11.1.17.1. Company Overview
- 11.1.17.2. Products
- 11.1.17.3. Company Financials
- 11.1.17.4. SWOT Analysis
- 11.1.18 Nippon Paper Industries Co Ltd
- 11.1.18.1. Company Overview
- 11.1.18.2. Products
- 11.1.18.3. Company Financials
- 11.1.18.4. SWOT Analysis
- 11.1.19 SNC Fibers
- 11.1.19.1. Company Overview
- 11.1.19.2. Products
- 11.1.19.3. Company Financials
- 11.1.19.4. SWOT Analysis
- 11.1.20 US Global Nanospace Inc
- 11.1.20.1. Company Overview
- 11.1.20.2. Products
- 11.1.20.3. Company Financials
- 11.1.20.4. SWOT Analysis
- 11.1.21 Argonide Corporation
- 11.1.21.1. Company Overview
- 11.1.21.2. Products
- 11.1.21.3. Company Financials
- 11.1.21.4. SWOT Analysis
- 11.1.22 Pardam SRO
- 11.1.22.1. Company Overview
- 11.1.22.2. Products
- 11.1.22.3. Company Financials
- 11.1.22.4. SWOT Analysis
- 11.1.23 Japan Vilene Company Ltd
- 11.1.23.1. Company Overview
- 11.1.23.2. Products
- 11.1.23.3. Company Financials
- 11.1.23.4. SWOT Analysis
- 11.1.1 Sappi Ltd
- 11.2. Market Entropy
- 11.2.1 Company's Key Areas Served
- 11.2.2 Recent Developments
- 11.3. Company Market Share Analysis 2025
- 11.3.1 Top 5 Companies Market Share Analysis
- 11.3.2 Top 3 Companies Market Share Analysis
- 11.4. List of Potential Customers
- 12. Research Methodology
List of Figures
- Figure 1: Global Nanofiber Market Revenue Breakdown (billion, %) by Region 2025 & 2033
- Figure 2: Global Nanofiber Market Volume Breakdown (K Tons, %) by Region 2025 & 2033
- Figure 3: Asia Pacific Nanofiber Market Revenue (billion), by Product Type 2025 & 2033
- Figure 4: Asia Pacific Nanofiber Market Volume (K Tons), by Product Type 2025 & 2033
- Figure 5: Asia Pacific Nanofiber Market Revenue Share (%), by Product Type 2025 & 2033
- Figure 6: Asia Pacific Nanofiber Market Volume Share (%), by Product Type 2025 & 2033
- Figure 7: Asia Pacific Nanofiber Market Revenue (billion), by Application 2025 & 2033
- Figure 8: Asia Pacific Nanofiber Market Volume (K Tons), by Application 2025 & 2033
- Figure 9: Asia Pacific Nanofiber Market Revenue Share (%), by Application 2025 & 2033
- Figure 10: Asia Pacific Nanofiber Market Volume Share (%), by Application 2025 & 2033
- Figure 11: Asia Pacific Nanofiber Market Revenue (billion), by Country 2025 & 2033
- Figure 12: Asia Pacific Nanofiber Market Volume (K Tons), by Country 2025 & 2033
- Figure 13: Asia Pacific Nanofiber Market Revenue Share (%), by Country 2025 & 2033
- Figure 14: Asia Pacific Nanofiber Market Volume Share (%), by Country 2025 & 2033
- Figure 15: North America Nanofiber Market Revenue (billion), by Product Type 2025 & 2033
- Figure 16: North America Nanofiber Market Volume (K Tons), by Product Type 2025 & 2033
- Figure 17: North America Nanofiber Market Revenue Share (%), by Product Type 2025 & 2033
- Figure 18: North America Nanofiber Market Volume Share (%), by Product Type 2025 & 2033
- Figure 19: North America Nanofiber Market Revenue (billion), by Application 2025 & 2033
- Figure 20: North America Nanofiber Market Volume (K Tons), by Application 2025 & 2033
- Figure 21: North America Nanofiber Market Revenue Share (%), by Application 2025 & 2033
- Figure 22: North America Nanofiber Market Volume Share (%), by Application 2025 & 2033
- Figure 23: North America Nanofiber Market Revenue (billion), by Country 2025 & 2033
- Figure 24: North America Nanofiber Market Volume (K Tons), by Country 2025 & 2033
- Figure 25: North America Nanofiber Market Revenue Share (%), by Country 2025 & 2033
- Figure 26: North America Nanofiber Market Volume Share (%), by Country 2025 & 2033
- Figure 27: Europe Nanofiber Market Revenue (billion), by Product Type 2025 & 2033
- Figure 28: Europe Nanofiber Market Volume (K Tons), by Product Type 2025 & 2033
- Figure 29: Europe Nanofiber Market Revenue Share (%), by Product Type 2025 & 2033
- Figure 30: Europe Nanofiber Market Volume Share (%), by Product Type 2025 & 2033
- Figure 31: Europe Nanofiber Market Revenue (billion), by Application 2025 & 2033
- Figure 32: Europe Nanofiber Market Volume (K Tons), by Application 2025 & 2033
- Figure 33: Europe Nanofiber Market Revenue Share (%), by Application 2025 & 2033
- Figure 34: Europe Nanofiber Market Volume Share (%), by Application 2025 & 2033
- Figure 35: Europe Nanofiber Market Revenue (billion), by Country 2025 & 2033
- Figure 36: Europe Nanofiber Market Volume (K Tons), by Country 2025 & 2033
- Figure 37: Europe Nanofiber Market Revenue Share (%), by Country 2025 & 2033
- Figure 38: Europe Nanofiber Market Volume Share (%), by Country 2025 & 2033
- Figure 39: Rest of the World Nanofiber Market Revenue (billion), by Product Type 2025 & 2033
- Figure 40: Rest of the World Nanofiber Market Volume (K Tons), by Product Type 2025 & 2033
- Figure 41: Rest of the World Nanofiber Market Revenue Share (%), by Product Type 2025 & 2033
- Figure 42: Rest of the World Nanofiber Market Volume Share (%), by Product Type 2025 & 2033
- Figure 43: Rest of the World Nanofiber Market Revenue (billion), by Application 2025 & 2033
- Figure 44: Rest of the World Nanofiber Market Volume (K Tons), by Application 2025 & 2033
- Figure 45: Rest of the World Nanofiber Market Revenue Share (%), by Application 2025 & 2033
- Figure 46: Rest of the World Nanofiber Market Volume Share (%), by Application 2025 & 2033
- Figure 47: Rest of the World Nanofiber Market Revenue (billion), by Country 2025 & 2033
- Figure 48: Rest of the World Nanofiber Market Volume (K Tons), by Country 2025 & 2033
- Figure 49: Rest of the World Nanofiber Market Revenue Share (%), by Country 2025 & 2033
- Figure 50: Rest of the World Nanofiber Market Volume Share (%), by Country 2025 & 2033
List of Tables
- Table 1: Global Nanofiber Market Revenue billion Forecast, by Product Type 2020 & 2033
- Table 2: Global Nanofiber Market Volume K Tons Forecast, by Product Type 2020 & 2033
- Table 3: Global Nanofiber Market Revenue billion Forecast, by Application 2020 & 2033
- Table 4: Global Nanofiber Market Volume K Tons Forecast, by Application 2020 & 2033
- Table 5: Global Nanofiber Market Revenue billion Forecast, by Region 2020 & 2033
- Table 6: Global Nanofiber Market Volume K Tons Forecast, by Region 2020 & 2033
- Table 7: Global Nanofiber Market Revenue billion Forecast, by Product Type 2020 & 2033
- Table 8: Global Nanofiber Market Volume K Tons Forecast, by Product Type 2020 & 2033
- Table 9: Global Nanofiber Market Revenue billion Forecast, by Application 2020 & 2033
- Table 10: Global Nanofiber Market Volume K Tons Forecast, by Application 2020 & 2033
- Table 11: Global Nanofiber Market Revenue billion Forecast, by Country 2020 & 2033
- Table 12: Global Nanofiber Market Volume K Tons Forecast, by Country 2020 & 2033
- Table 13: China Nanofiber Market Revenue (billion) Forecast, by Application 2020 & 2033
- Table 14: China Nanofiber Market Volume (K Tons) Forecast, by Application 2020 & 2033
- Table 15: India Nanofiber Market Revenue (billion) Forecast, by Application 2020 & 2033
- Table 16: India Nanofiber Market Volume (K Tons) Forecast, by Application 2020 & 2033
- Table 17: Japan Nanofiber Market Revenue (billion) Forecast, by Application 2020 & 2033
- Table 18: Japan Nanofiber Market Volume (K Tons) Forecast, by Application 2020 & 2033
- Table 19: South Korea Nanofiber Market Revenue (billion) Forecast, by Application 2020 & 2033
- Table 20: South Korea Nanofiber Market Volume (K Tons) Forecast, by Application 2020 & 2033
- Table 21: Rest of Asia Pacific Nanofiber Market Revenue (billion) Forecast, by Application 2020 & 2033
- Table 22: Rest of Asia Pacific Nanofiber Market Volume (K Tons) Forecast, by Application 2020 & 2033
- Table 23: Global Nanofiber Market Revenue billion Forecast, by Product Type 2020 & 2033
- Table 24: Global Nanofiber Market Volume K Tons Forecast, by Product Type 2020 & 2033
- Table 25: Global Nanofiber Market Revenue billion Forecast, by Application 2020 & 2033
- Table 26: Global Nanofiber Market Volume K Tons Forecast, by Application 2020 & 2033
- Table 27: Global Nanofiber Market Revenue billion Forecast, by Country 2020 & 2033
- Table 28: Global Nanofiber Market Volume K Tons Forecast, by Country 2020 & 2033
- Table 29: United States Nanofiber Market Revenue (billion) Forecast, by Application 2020 & 2033
- Table 30: United States Nanofiber Market Volume (K Tons) Forecast, by Application 2020 & 2033
- Table 31: Canada Nanofiber Market Revenue (billion) Forecast, by Application 2020 & 2033
- Table 32: Canada Nanofiber Market Volume (K Tons) Forecast, by Application 2020 & 2033
- Table 33: Mexico Nanofiber Market Revenue (billion) Forecast, by Application 2020 & 2033
- Table 34: Mexico Nanofiber Market Volume (K Tons) Forecast, by Application 2020 & 2033
- Table 35: Global Nanofiber Market Revenue billion Forecast, by Product Type 2020 & 2033
- Table 36: Global Nanofiber Market Volume K Tons Forecast, by Product Type 2020 & 2033
- Table 37: Global Nanofiber Market Revenue billion Forecast, by Application 2020 & 2033
- Table 38: Global Nanofiber Market Volume K Tons Forecast, by Application 2020 & 2033
- Table 39: Global Nanofiber Market Revenue billion Forecast, by Country 2020 & 2033
- Table 40: Global Nanofiber Market Volume K Tons Forecast, by Country 2020 & 2033
- Table 41: Germany Nanofiber Market Revenue (billion) Forecast, by Application 2020 & 2033
- Table 42: Germany Nanofiber Market Volume (K Tons) Forecast, by Application 2020 & 2033
- Table 43: United Kingdom Nanofiber Market Revenue (billion) Forecast, by Application 2020 & 2033
- Table 44: United Kingdom Nanofiber Market Volume (K Tons) Forecast, by Application 2020 & 2033
- Table 45: France Nanofiber Market Revenue (billion) Forecast, by Application 2020 & 2033
- Table 46: France Nanofiber Market Volume (K Tons) Forecast, by Application 2020 & 2033
- Table 47: Italy Nanofiber Market Revenue (billion) Forecast, by Application 2020 & 2033
- Table 48: Italy Nanofiber Market Volume (K Tons) Forecast, by Application 2020 & 2033
- Table 49: Rest of Europe Nanofiber Market Revenue (billion) Forecast, by Application 2020 & 2033
- Table 50: Rest of Europe Nanofiber Market Volume (K Tons) Forecast, by Application 2020 & 2033
- Table 51: Global Nanofiber Market Revenue billion Forecast, by Product Type 2020 & 2033
- Table 52: Global Nanofiber Market Volume K Tons Forecast, by Product Type 2020 & 2033
- Table 53: Global Nanofiber Market Revenue billion Forecast, by Application 2020 & 2033
- Table 54: Global Nanofiber Market Volume K Tons Forecast, by Application 2020 & 2033
- Table 55: Global Nanofiber Market Revenue billion Forecast, by Country 2020 & 2033
- Table 56: Global Nanofiber Market Volume K Tons Forecast, by Country 2020 & 2033
- Table 57: South America Nanofiber Market Revenue (billion) Forecast, by Application 2020 & 2033
- Table 58: South America Nanofiber Market Volume (K Tons) Forecast, by Application 2020 & 2033
- Table 59: Middle East and Africa Nanofiber Market Revenue (billion) Forecast, by Application 2020 & 2033
- Table 60: Middle East and Africa Nanofiber Market Volume (K Tons) Forecast, by Application 2020 & 2033
Frequently Asked Questions
1. What is the projected Compound Annual Growth Rate (CAGR) of the Nanofiber Market?
The projected CAGR is approximately 11.1%.
2. Which companies are prominent players in the Nanofiber Market?
Key companies in the market include Sappi Ltd, eSpin Technologies Inc, Teijin Limited, Nanoval GmbH & Co KG, Donaldson Company Inc, Applied Sciences Inc, Toray Industries Inc, Esfil Tehno AS, IREMA-Filter GmbH, Spur AS, Nanofiber Solutions, LIME, NanoLayr Limited, DuPont, Merck KgAA, Chuetsu Pulp & Paper Co Ltd, Hollingsworth & Vose Company, Nippon Paper Industries Co Ltd, SNC Fibers, US Global Nanospace Inc , Argonide Corporation, Pardam SRO, Japan Vilene Company Ltd.
3. What are the main segments of the Nanofiber Market?
The market segments include Product Type, Application.
4. Can you provide details about the market size?
The market size is estimated to be USD 2.21 billion as of 2022.
5. What are some drivers contributing to market growth?
Increasing Demand from the Medical and Pharmaceutical Industries; Positive Impact in Demand for Face Masks and PPE Kits due to COVID-19.
6. What are the notable trends driving market growth?
Water and Filtration Segment to Dominate the Market Demand.
7. Are there any restraints impacting market growth?
Difficulty in Shift of Carbon Nanofibers from Lab Scale to Plant Scale due to Small Size and Complexity; Other Restraints.
8. Can you provide examples of recent developments in the market?
In April 2021, Teijin Limited developed a new technology to mass produce a new version of NANOFRONT nanofibers.
9. What pricing options are available for accessing the report?
Pricing options include single-user, multi-user, and enterprise licenses priced at USD 4750, USD 5250, and USD 8750 respectively.
10. Is the market size provided in terms of value or volume?
The market size is provided in terms of value, measured in billion and volume, measured in K Tons.
11. Are there any specific market keywords associated with the report?
Yes, the market keyword associated with the report is "Nanofiber Market," which aids in identifying and referencing the specific market segment covered.
12. How do I determine which pricing option suits my needs best?
The pricing options vary based on user requirements and access needs. Individual users may opt for single-user licenses, while businesses requiring broader access may choose multi-user or enterprise licenses for cost-effective access to the report.
13. Are there any additional resources or data provided in the Nanofiber Market report?
While the report offers comprehensive insights, it's advisable to review the specific contents or supplementary materials provided to ascertain if additional resources or data are available.
14. How can I stay updated on further developments or reports in the Nanofiber Market?
To stay informed about further developments, trends, and reports in the Nanofiber Market, consider subscribing to industry newsletters, following relevant companies and organizations, or regularly checking reputable industry news sources and publications.
Methodology
Step 1 - Identification of Relevant Samples Size from Population Database


Step 2 - Approaches for Defining Global Market Size (Value, Volume* & Price*)

Note*: In applicable scenarios
Step 3 - Data Sources
Primary Research
- Web Analytics
- Survey Reports
- Research Institute
- Latest Research Reports
- Opinion Leaders
Secondary Research
- Annual Reports
- White Paper
- Latest Press Release
- Industry Association
- Paid Database
- Investor Presentations

Step 4 - Data Triangulation
Involves using different sources of information in order to increase the validity of a study
These sources are likely to be stakeholders in a program - participants, other researchers, program staff, other community members, and so on.
Then we put all data in single framework & apply various statistical tools to find out the dynamic on the market.
During the analysis stage, feedback from the stakeholder groups would be compared to determine areas of agreement as well as areas of divergence