

Key Insights
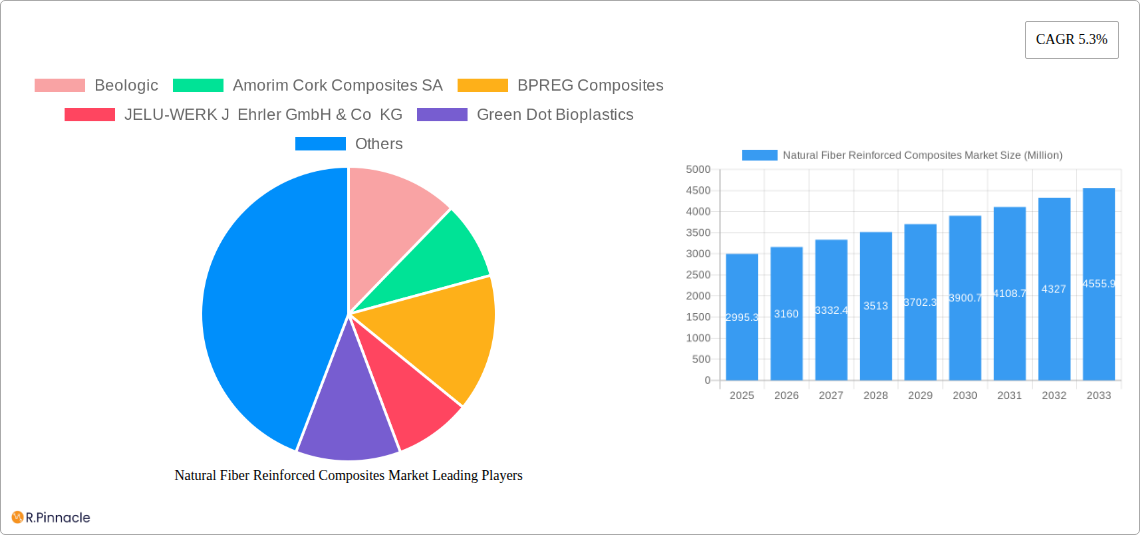
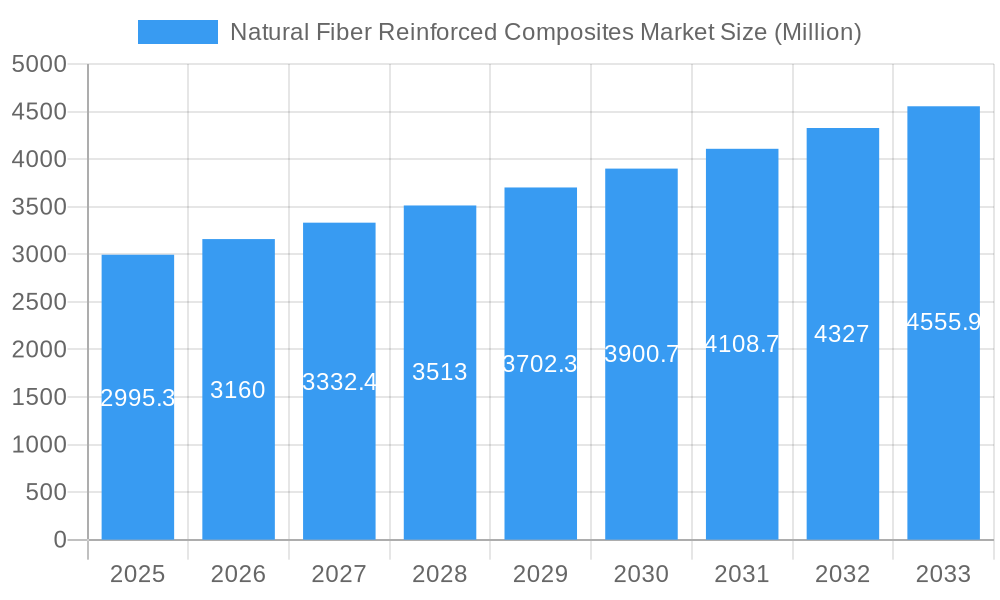
The global Natural Fiber Reinforced Composites (NFRC) market, valued at $2,995.3 million in 2025, is projected to experience robust growth, driven by a Compound Annual Growth Rate (CAGR) of 5.3% from 2025 to 2033. This expansion is fueled by several key factors. The increasing demand for sustainable and eco-friendly materials across various industries, particularly automotive, building & construction, and aerospace, is a primary driver. These composites offer a compelling alternative to traditional materials, boasting superior strength-to-weight ratios, reduced manufacturing costs, and excellent biodegradability. Furthermore, ongoing advancements in fiber processing techniques and resin systems are enhancing the performance and versatility of NFRCs, expanding their applicability in high-performance applications. Government regulations promoting sustainable practices and initiatives supporting the adoption of bio-based materials also contribute significantly to market growth. The market segmentation reveals strong performance across various fiber types (wood and non-wood) and polymer matrices (thermosets and thermoplastics), with the building and construction sector expected to remain a dominant end-user. However, challenges remain, including the potential for inconsistent fiber quality and the need for continuous research and development to improve the durability and moisture resistance of certain NFRC types. Nevertheless, the long-term outlook for the NFRC market remains highly positive, indicating significant growth potential across various geographical regions.
Natural Fiber Reinforced Composites Market Market Size (In Billion)
The Asia-Pacific region is expected to lead the market, fueled by rapid industrialization and the increasing adoption of sustainable materials in developing economies such as China and India. North America and Europe will also contribute significantly to market growth due to the increasing focus on sustainable manufacturing and stringent environmental regulations. Competition in the NFRC market is intense, with established players and emerging companies vying for market share. Key players are actively investing in research and development to enhance product offerings and expand their market reach. Strategic partnerships and collaborations are also common strategies for growth and innovation. The long-term success of NFRC companies will depend on their ability to innovate, offer competitive pricing, and effectively meet the diverse needs of different end-user industries, along with their ability to successfully navigate any potential supply chain challenges associated with raw material sourcing and sustainability.
Natural Fiber Reinforced Composites Market Company Market Share
Natural Fiber Reinforced Composites Market Report: A Comprehensive Analysis (2019-2033)
This in-depth report provides a comprehensive analysis of the Natural Fiber Reinforced Composites market, offering invaluable insights for industry professionals, investors, and strategic decision-makers. The study covers the period 2019-2033, with a focus on the forecast period 2025-2033 and a base year of 2025. The report delves into market dynamics, segmentation, leading players, and future trends, providing a clear picture of this rapidly evolving sector. Expect detailed data and analysis on market size (in Millions), CAGR, and key market drivers.
Natural Fiber Reinforced Composites Market Market Structure & Innovation Trends
This section analyzes the competitive landscape of the Natural Fiber Reinforced Composites market, exploring market concentration, innovation drivers, regulatory frameworks, and M&A activities. We examine the market share held by key players such as Beologic, Amorim Cork Composites SA, BPREG Composites, JELU-WERK J Ehrler GmbH & Co KG, Green Dot Bioplastics, TECNARO GmbH, Trex Company Inc, Fiberon, UPM, GreenGran BN, Wuhu Haoxuan Wood Plastic Composite Co Ltd, FKuR, Flexform Technologies, UFP Technologies Inc, Oldcastle APG, and The AZEK Company Inc. The report also assesses the impact of recent mergers and acquisitions, providing insights into deal values and their influence on market dynamics. We analyze the influence of factors such as:
- Market Concentration: Analysis of market share distribution among key players. (e.g., Top 3 players hold xx% market share)
- Innovation Drivers: Identification of key technological advancements driving market growth. (e.g., advancements in bio-based polymers)
- Regulatory Frameworks: Evaluation of the impact of environmental regulations and industry standards. (e.g., impact of EU REACH regulations)
- Product Substitutes: Assessment of the threat posed by alternative materials. (e.g., competition from traditional materials)
- End-User Demographics: Analysis of the diverse end-user industries driving demand. (e.g., growth in building and construction sector)
- M&A Activities: Review of recent mergers and acquisitions, including deal values and their implications for market consolidation. (e.g., xx Million in M&A activity in the last 5 years)
Natural Fiber Reinforced Composites Market Market Dynamics & Trends
This section explores the key factors influencing market growth, including technological disruptions, consumer preferences, and competitive dynamics. We will examine the Compound Annual Growth Rate (CAGR) and market penetration rates for different segments. The analysis will cover aspects such as:
- Market growth drivers such as increasing demand for sustainable materials and rising awareness of environmental concerns.
- Technological advancements that improve the performance and cost-effectiveness of natural fiber composites.
- Changing consumer preferences, including demand for lightweight, durable, and eco-friendly products.
- The competitive landscape, including strategies employed by leading players to gain market share. (e.g., xx% market penetration in the building and construction segment)
Dominant Regions & Segments in Natural Fiber Reinforced Composites Market
This section identifies the leading regions, countries, and segments within the Natural Fiber Reinforced Composites market. Detailed analysis will be provided for each segment – Fiber (Wood Fiber Composites, Non-wood Fiber Composites), Polymer (Thermosets, Thermoplastics), and End-user Industry (Aerospace, Automotive, Marine, Building and Construction, Electrical and Electronics, Sports, Other End-user Industries). Key drivers of dominance will be highlighted using bullet points.
Key Drivers (Examples):
- Building and Construction: Strong growth driven by increasing demand for sustainable building materials and government incentives for green building projects.
- Automotive: Adoption driven by the need for lightweight vehicles to improve fuel efficiency.
- Specific Region (e.g., North America): Strong market growth driven by favorable government policies and a robust construction sector.
Natural Fiber Reinforced Composites Market Product Innovations
This section summarizes recent product developments, highlighting key technological trends and their market fit. It will showcase new applications and competitive advantages offered by innovative products. (e.g., Development of new bio-based resins enhancing the performance and durability of natural fiber composites, leading to wider applications across various industries)
Report Scope & Segmentation Analysis
This report segments the Natural Fiber Reinforced Composites market across multiple parameters:
- Fiber Type: Wood Fiber Composites, Non-wood Fiber Composites (growth projections, market size, and competitive dynamics for each)
- Polymer Type: Thermosets, Thermoplastics (growth projections, market size, and competitive dynamics for each)
- End-user Industry: Aerospace, Automotive, Marine, Building and Construction, Electrical and Electronics, Sports, Other End-user Industries (Power Industry (Wind Turbines), Medical, etc.) (growth projections, market size, and competitive dynamics for each)
Key Drivers of Natural Fiber Reinforced Composites Market Growth
Key growth drivers include:
- Increasing demand for sustainable and eco-friendly materials.
- The rising cost of traditional materials and the need for cost-effective alternatives.
- Government regulations promoting the use of sustainable materials in various industries.
- Technological advancements leading to improved performance characteristics of natural fiber composites.
Challenges in the Natural Fiber Reinforced Composites Market Sector
Challenges include:
- Fluctuations in raw material prices and supply chain disruptions.
- The need for consistent quality control and standardization.
- Competition from established synthetic materials with superior performance in certain applications.
- Regulatory hurdles related to the use of specific natural fibers in different industries.
Emerging Opportunities in Natural Fiber Reinforced Composites Market
Emerging opportunities include:
- Expanding applications in high-growth sectors such as renewable energy and medical devices.
- Development of new composite materials with enhanced performance and durability.
- Increased investment in research and development to improve the properties of natural fibers and bio-based polymers.
- Growing demand for lightweight and high-strength composites in the transportation industry.
Leading Players in the Natural Fiber Reinforced Composites Market Market
- Beologic
- Amorim Cork Composites SA
- BPREG Composites
- JELU-WERK J Ehrler GmbH & Co KG
- Green Dot Bioplastics
- TECNARO GmbH
- Trex Company Inc
- Fiberon
- UPM
- GreenGran BN
- Wuhu Haoxuan Wood Plastic Composite Co Ltd
- FKuR
- Flexform Technologies
- UFP Technologies Inc
- Oldcastle APG
- The AZEK Company Inc
Key Developments in Natural Fiber Reinforced Composites Market Industry
- June 2023: Trex Company introduced Trex Select T-Rail, a wood composite railing system expanding market reach.
- February 2023: Trex Company launched Trex Signature Decking, a premium wood composite line enhancing its product portfolio.
Future Outlook for Natural Fiber Reinforced Composites Market Market
The future of the Natural Fiber Reinforced Composites market looks promising, driven by strong growth in key end-use sectors. Technological advancements, increasing environmental awareness, and supportive government policies will continue to fuel market expansion. Strategic partnerships and investments in research and development will be critical for companies to maintain a competitive edge. The market is expected to witness significant growth over the forecast period, presenting lucrative opportunities for businesses involved in the production and utilization of natural fiber reinforced composites.
Natural Fiber Reinforced Composites Market Segmentation
-
1. Fiber
- 1.1. Wood Fiber Composites
-
1.2. Non-wood Fiber Composites
- 1.2.1. Cotton
- 1.2.2. Flax
- 1.2.3. Kenaf
- 1.2.4. Hemp
- 1.2.5. Other No
-
2. Polymer
- 2.1. Thermosets
-
2.2. Thermoplastics
- 2.2.1. Polyethylene
- 2.2.2. Polypropylene
- 2.2.3. Poly Vinyl Chloride
- 2.2.4. Other Th
-
3. End-user Industry
- 3.1. Aerospace
- 3.2. Automotive
- 3.3. Marine
- 3.4. Building and Construction
- 3.5. Electrical and Electronics
- 3.6. Sports
- 3.7. Other En
Natural Fiber Reinforced Composites Market Segmentation By Geography
-
1. Asia Pacific
- 1.1. China
- 1.2. India
- 1.3. Japan
- 1.4. South Korea
- 1.5. Malaysia
- 1.6. Thailand
- 1.7. Indonesia
- 1.8. Vietnam
- 1.9. Rest of Asia Pacific
-
2. North America
- 2.1. United States
- 2.2. Canada
- 2.3. Mexico
-
3. Europe
- 3.1. Germany
- 3.2. United Kingdom
- 3.3. France
- 3.4. Italy
- 3.5. Spain
- 3.6. Nordic Countries
- 3.7. Turkey
- 3.8. Russia
- 3.9. Rest of Europe
-
4. South America
- 4.1. Brazil
- 4.2. Argentina
- 4.3. Colombia
- 4.4. Rest of South America
-
5. Middle East and Africa
- 5.1. Saudi Arabia
- 5.2. Qatar
- 5.3. United Arab Emirates
- 5.4. Nigeria
- 5.5. Egypt
- 5.6. South Africa
- 5.7. Rest of Middle East and Africa
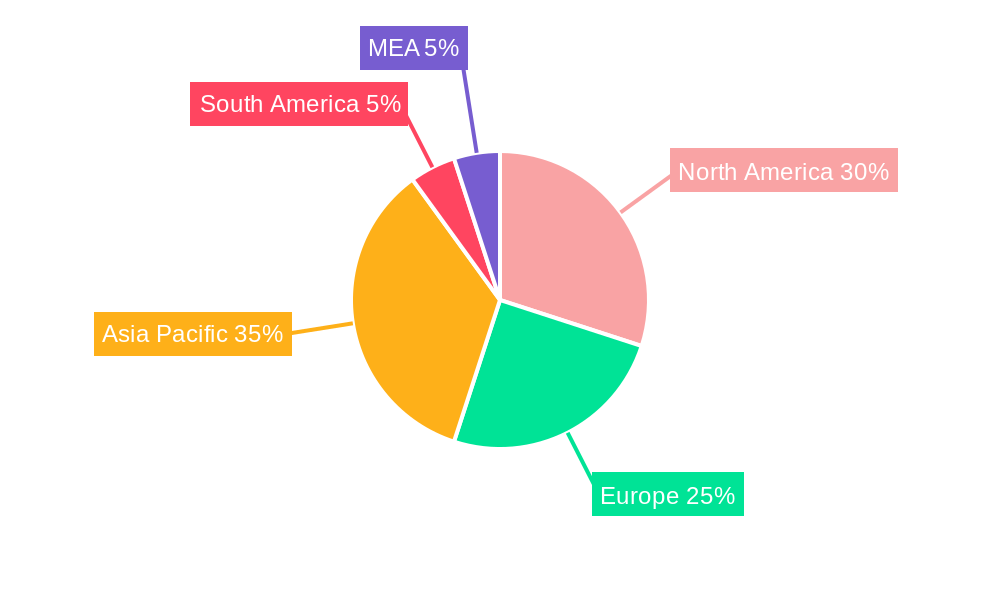
Natural Fiber Reinforced Composites Market Regional Market Share
Geographic Coverage of Natural Fiber Reinforced Composites Market
Natural Fiber Reinforced Composites Market REPORT HIGHLIGHTS
| Aspects | Details |
|---|---|
| Study Period | 2020-2034 |
| Base Year | 2025 |
| Estimated Year | 2026 |
| Forecast Period | 2026-2034 |
| Historical Period | 2020-2025 |
| Growth Rate | CAGR of 5.3% from 2020-2034 |
| Segmentation |
|
Table of Contents
- 1. Introduction
- 1.1. Research Scope
- 1.2. Market Segmentation
- 1.3. Research Objective
- 1.4. Definitions and Assumptions
- 2. Executive Summary
- 2.1. Market Snapshot
- 3. Market Dynamics
- 3.1. Market Drivers
- 3.2. Market Restrains
- 3.3. Market Trends
- 3.4. Market Opportunities
- 4. Market Factor Analysis
- 4.1. Porters Five Forces
- 4.1.1. Bargaining Power of Suppliers
- 4.1.2. Bargaining Power of Buyers
- 4.1.3. Threat of New Entrants
- 4.1.4. Threat of Substitutes
- 4.1.5. Competitive Rivalry
- 4.2. PESTEL analysis
- 4.3. BCG Analysis
- 4.3.1. Stars (High Growth, High Market Share)
- 4.3.2. Cash Cows (Low Growth, High Market Share)
- 4.3.3. Question Mark (High Growth, Low Market Share)
- 4.3.4. Dogs (Low Growth, Low Market Share)
- 4.4. Ansoff Matrix Analysis
- 4.5. Supply Chain Analysis
- 4.6. Regulatory Landscape
- 4.7. Current Market Potential and Opportunity Assessment (TAM–SAM–SOM Framework)
- 4.8. PRI Analyst Note
- 4.1. Porters Five Forces
- 5. Market Analysis, Insights and Forecast 2021-2033
- 5.1. Market Analysis, Insights and Forecast - by Fiber
- 5.1.1. Wood Fiber Composites
- 5.1.2. Non-wood Fiber Composites
- 5.1.2.1. Cotton
- 5.1.2.2. Flax
- 5.1.2.3. Kenaf
- 5.1.2.4. Hemp
- 5.1.2.5. Other No
- 5.2. Market Analysis, Insights and Forecast - by Polymer
- 5.2.1. Thermosets
- 5.2.2. Thermoplastics
- 5.2.2.1. Polyethylene
- 5.2.2.2. Polypropylene
- 5.2.2.3. Poly Vinyl Chloride
- 5.2.2.4. Other Th
- 5.3. Market Analysis, Insights and Forecast - by End-user Industry
- 5.3.1. Aerospace
- 5.3.2. Automotive
- 5.3.3. Marine
- 5.3.4. Building and Construction
- 5.3.5. Electrical and Electronics
- 5.3.6. Sports
- 5.3.7. Other En
- 5.4. Market Analysis, Insights and Forecast - by Region
- 5.4.1. Asia Pacific
- 5.4.2. North America
- 5.4.3. Europe
- 5.4.4. South America
- 5.4.5. Middle East and Africa
- 5.1. Market Analysis, Insights and Forecast - by Fiber
- 6. Global Natural Fiber Reinforced Composites Market Analysis, Insights and Forecast, 2021-2033
- 6.1. Market Analysis, Insights and Forecast - by Fiber
- 6.1.1. Wood Fiber Composites
- 6.1.2. Non-wood Fiber Composites
- 6.1.2.1. Cotton
- 6.1.2.2. Flax
- 6.1.2.3. Kenaf
- 6.1.2.4. Hemp
- 6.1.2.5. Other No
- 6.2. Market Analysis, Insights and Forecast - by Polymer
- 6.2.1. Thermosets
- 6.2.2. Thermoplastics
- 6.2.2.1. Polyethylene
- 6.2.2.2. Polypropylene
- 6.2.2.3. Poly Vinyl Chloride
- 6.2.2.4. Other Th
- 6.3. Market Analysis, Insights and Forecast - by End-user Industry
- 6.3.1. Aerospace
- 6.3.2. Automotive
- 6.3.3. Marine
- 6.3.4. Building and Construction
- 6.3.5. Electrical and Electronics
- 6.3.6. Sports
- 6.3.7. Other En
- 6.1. Market Analysis, Insights and Forecast - by Fiber
- 7. Asia Pacific Natural Fiber Reinforced Composites Market Analysis, Insights and Forecast, 2020-2032
- 7.1. Market Analysis, Insights and Forecast - by Fiber
- 7.1.1. Wood Fiber Composites
- 7.1.2. Non-wood Fiber Composites
- 7.1.2.1. Cotton
- 7.1.2.2. Flax
- 7.1.2.3. Kenaf
- 7.1.2.4. Hemp
- 7.1.2.5. Other No
- 7.2. Market Analysis, Insights and Forecast - by Polymer
- 7.2.1. Thermosets
- 7.2.2. Thermoplastics
- 7.2.2.1. Polyethylene
- 7.2.2.2. Polypropylene
- 7.2.2.3. Poly Vinyl Chloride
- 7.2.2.4. Other Th
- 7.3. Market Analysis, Insights and Forecast - by End-user Industry
- 7.3.1. Aerospace
- 7.3.2. Automotive
- 7.3.3. Marine
- 7.3.4. Building and Construction
- 7.3.5. Electrical and Electronics
- 7.3.6. Sports
- 7.3.7. Other En
- 7.1. Market Analysis, Insights and Forecast - by Fiber
- 8. North America Natural Fiber Reinforced Composites Market Analysis, Insights and Forecast, 2020-2032
- 8.1. Market Analysis, Insights and Forecast - by Fiber
- 8.1.1. Wood Fiber Composites
- 8.1.2. Non-wood Fiber Composites
- 8.1.2.1. Cotton
- 8.1.2.2. Flax
- 8.1.2.3. Kenaf
- 8.1.2.4. Hemp
- 8.1.2.5. Other No
- 8.2. Market Analysis, Insights and Forecast - by Polymer
- 8.2.1. Thermosets
- 8.2.2. Thermoplastics
- 8.2.2.1. Polyethylene
- 8.2.2.2. Polypropylene
- 8.2.2.3. Poly Vinyl Chloride
- 8.2.2.4. Other Th
- 8.3. Market Analysis, Insights and Forecast - by End-user Industry
- 8.3.1. Aerospace
- 8.3.2. Automotive
- 8.3.3. Marine
- 8.3.4. Building and Construction
- 8.3.5. Electrical and Electronics
- 8.3.6. Sports
- 8.3.7. Other En
- 8.1. Market Analysis, Insights and Forecast - by Fiber
- 9. Europe Natural Fiber Reinforced Composites Market Analysis, Insights and Forecast, 2020-2032
- 9.1. Market Analysis, Insights and Forecast - by Fiber
- 9.1.1. Wood Fiber Composites
- 9.1.2. Non-wood Fiber Composites
- 9.1.2.1. Cotton
- 9.1.2.2. Flax
- 9.1.2.3. Kenaf
- 9.1.2.4. Hemp
- 9.1.2.5. Other No
- 9.2. Market Analysis, Insights and Forecast - by Polymer
- 9.2.1. Thermosets
- 9.2.2. Thermoplastics
- 9.2.2.1. Polyethylene
- 9.2.2.2. Polypropylene
- 9.2.2.3. Poly Vinyl Chloride
- 9.2.2.4. Other Th
- 9.3. Market Analysis, Insights and Forecast - by End-user Industry
- 9.3.1. Aerospace
- 9.3.2. Automotive
- 9.3.3. Marine
- 9.3.4. Building and Construction
- 9.3.5. Electrical and Electronics
- 9.3.6. Sports
- 9.3.7. Other En
- 9.1. Market Analysis, Insights and Forecast - by Fiber
- 10. South America Natural Fiber Reinforced Composites Market Analysis, Insights and Forecast, 2020-2032
- 10.1. Market Analysis, Insights and Forecast - by Fiber
- 10.1.1. Wood Fiber Composites
- 10.1.2. Non-wood Fiber Composites
- 10.1.2.1. Cotton
- 10.1.2.2. Flax
- 10.1.2.3. Kenaf
- 10.1.2.4. Hemp
- 10.1.2.5. Other No
- 10.2. Market Analysis, Insights and Forecast - by Polymer
- 10.2.1. Thermosets
- 10.2.2. Thermoplastics
- 10.2.2.1. Polyethylene
- 10.2.2.2. Polypropylene
- 10.2.2.3. Poly Vinyl Chloride
- 10.2.2.4. Other Th
- 10.3. Market Analysis, Insights and Forecast - by End-user Industry
- 10.3.1. Aerospace
- 10.3.2. Automotive
- 10.3.3. Marine
- 10.3.4. Building and Construction
- 10.3.5. Electrical and Electronics
- 10.3.6. Sports
- 10.3.7. Other En
- 10.1. Market Analysis, Insights and Forecast - by Fiber
- 11. Middle East and Africa Natural Fiber Reinforced Composites Market Analysis, Insights and Forecast, 2020-2032
- 11.1. Market Analysis, Insights and Forecast - by Fiber
- 11.1.1. Wood Fiber Composites
- 11.1.2. Non-wood Fiber Composites
- 11.1.2.1. Cotton
- 11.1.2.2. Flax
- 11.1.2.3. Kenaf
- 11.1.2.4. Hemp
- 11.1.2.5. Other No
- 11.2. Market Analysis, Insights and Forecast - by Polymer
- 11.2.1. Thermosets
- 11.2.2. Thermoplastics
- 11.2.2.1. Polyethylene
- 11.2.2.2. Polypropylene
- 11.2.2.3. Poly Vinyl Chloride
- 11.2.2.4. Other Th
- 11.3. Market Analysis, Insights and Forecast - by End-user Industry
- 11.3.1. Aerospace
- 11.3.2. Automotive
- 11.3.3. Marine
- 11.3.4. Building and Construction
- 11.3.5. Electrical and Electronics
- 11.3.6. Sports
- 11.3.7. Other En
- 11.1. Market Analysis, Insights and Forecast - by Fiber
- 12. Competitive Analysis
- 12.1. Company Profiles
- 12.1.1 Beologic
- 12.1.1.1. Company Overview
- 12.1.1.2. Products
- 12.1.1.3. Company Financials
- 12.1.1.4. SWOT Analysis
- 12.1.2 Amorim Cork Composites SA
- 12.1.2.1. Company Overview
- 12.1.2.2. Products
- 12.1.2.3. Company Financials
- 12.1.2.4. SWOT Analysis
- 12.1.3 BPREG Composites
- 12.1.3.1. Company Overview
- 12.1.3.2. Products
- 12.1.3.3. Company Financials
- 12.1.3.4. SWOT Analysis
- 12.1.4 JELU-WERK J Ehrler GmbH & Co KG
- 12.1.4.1. Company Overview
- 12.1.4.2. Products
- 12.1.4.3. Company Financials
- 12.1.4.4. SWOT Analysis
- 12.1.5 Green Dot Bioplastics
- 12.1.5.1. Company Overview
- 12.1.5.2. Products
- 12.1.5.3. Company Financials
- 12.1.5.4. SWOT Analysis
- 12.1.6 TECNARO GmbH
- 12.1.6.1. Company Overview
- 12.1.6.2. Products
- 12.1.6.3. Company Financials
- 12.1.6.4. SWOT Analysis
- 12.1.7 Trex Company Inc
- 12.1.7.1. Company Overview
- 12.1.7.2. Products
- 12.1.7.3. Company Financials
- 12.1.7.4. SWOT Analysis
- 12.1.8 Fiberon
- 12.1.8.1. Company Overview
- 12.1.8.2. Products
- 12.1.8.3. Company Financials
- 12.1.8.4. SWOT Analysis
- 12.1.9 UPM
- 12.1.9.1. Company Overview
- 12.1.9.2. Products
- 12.1.9.3. Company Financials
- 12.1.9.4. SWOT Analysis
- 12.1.10 GreenGran BN
- 12.1.10.1. Company Overview
- 12.1.10.2. Products
- 12.1.10.3. Company Financials
- 12.1.10.4. SWOT Analysis
- 12.1.11 Wuhu Haoxuan Wood Plastic Composite Co Ltd
- 12.1.11.1. Company Overview
- 12.1.11.2. Products
- 12.1.11.3. Company Financials
- 12.1.11.4. SWOT Analysis
- 12.1.12 FKuR
- 12.1.12.1. Company Overview
- 12.1.12.2. Products
- 12.1.12.3. Company Financials
- 12.1.12.4. SWOT Analysis
- 12.1.13 Flexform Technologies
- 12.1.13.1. Company Overview
- 12.1.13.2. Products
- 12.1.13.3. Company Financials
- 12.1.13.4. SWOT Analysis
- 12.1.14 UFP Technologies Inc
- 12.1.14.1. Company Overview
- 12.1.14.2. Products
- 12.1.14.3. Company Financials
- 12.1.14.4. SWOT Analysis
- 12.1.15 Oldcastle APG
- 12.1.15.1. Company Overview
- 12.1.15.2. Products
- 12.1.15.3. Company Financials
- 12.1.15.4. SWOT Analysis
- 12.1.16 The AZEK Company Inc
- 12.1.16.1. Company Overview
- 12.1.16.2. Products
- 12.1.16.3. Company Financials
- 12.1.16.4. SWOT Analysis
- 12.1.1 Beologic
- 12.2. Market Entropy
- 12.2.1 Company's Key Areas Served
- 12.2.2 Recent Developments
- 12.3. Company Market Share Analysis 2025
- 12.3.1 Top 5 Companies Market Share Analysis
- 12.3.2 Top 3 Companies Market Share Analysis
- 12.4. List of Potential Customers
- 13. Research Methodology
List of Figures
- Figure 1: Global Natural Fiber Reinforced Composites Market Revenue Breakdown (Million, %) by Region 2025 & 2033
- Figure 2: Global Natural Fiber Reinforced Composites Market Volume Breakdown (K Tons, %) by Region 2025 & 2033
- Figure 3: Asia Pacific Natural Fiber Reinforced Composites Market Revenue (Million), by Fiber 2025 & 2033
- Figure 4: Asia Pacific Natural Fiber Reinforced Composites Market Volume (K Tons), by Fiber 2025 & 2033
- Figure 5: Asia Pacific Natural Fiber Reinforced Composites Market Revenue Share (%), by Fiber 2025 & 2033
- Figure 6: Asia Pacific Natural Fiber Reinforced Composites Market Volume Share (%), by Fiber 2025 & 2033
- Figure 7: Asia Pacific Natural Fiber Reinforced Composites Market Revenue (Million), by Polymer 2025 & 2033
- Figure 8: Asia Pacific Natural Fiber Reinforced Composites Market Volume (K Tons), by Polymer 2025 & 2033
- Figure 9: Asia Pacific Natural Fiber Reinforced Composites Market Revenue Share (%), by Polymer 2025 & 2033
- Figure 10: Asia Pacific Natural Fiber Reinforced Composites Market Volume Share (%), by Polymer 2025 & 2033
- Figure 11: Asia Pacific Natural Fiber Reinforced Composites Market Revenue (Million), by End-user Industry 2025 & 2033
- Figure 12: Asia Pacific Natural Fiber Reinforced Composites Market Volume (K Tons), by End-user Industry 2025 & 2033
- Figure 13: Asia Pacific Natural Fiber Reinforced Composites Market Revenue Share (%), by End-user Industry 2025 & 2033
- Figure 14: Asia Pacific Natural Fiber Reinforced Composites Market Volume Share (%), by End-user Industry 2025 & 2033
- Figure 15: Asia Pacific Natural Fiber Reinforced Composites Market Revenue (Million), by Country 2025 & 2033
- Figure 16: Asia Pacific Natural Fiber Reinforced Composites Market Volume (K Tons), by Country 2025 & 2033
- Figure 17: Asia Pacific Natural Fiber Reinforced Composites Market Revenue Share (%), by Country 2025 & 2033
- Figure 18: Asia Pacific Natural Fiber Reinforced Composites Market Volume Share (%), by Country 2025 & 2033
- Figure 19: North America Natural Fiber Reinforced Composites Market Revenue (Million), by Fiber 2025 & 2033
- Figure 20: North America Natural Fiber Reinforced Composites Market Volume (K Tons), by Fiber 2025 & 2033
- Figure 21: North America Natural Fiber Reinforced Composites Market Revenue Share (%), by Fiber 2025 & 2033
- Figure 22: North America Natural Fiber Reinforced Composites Market Volume Share (%), by Fiber 2025 & 2033
- Figure 23: North America Natural Fiber Reinforced Composites Market Revenue (Million), by Polymer 2025 & 2033
- Figure 24: North America Natural Fiber Reinforced Composites Market Volume (K Tons), by Polymer 2025 & 2033
- Figure 25: North America Natural Fiber Reinforced Composites Market Revenue Share (%), by Polymer 2025 & 2033
- Figure 26: North America Natural Fiber Reinforced Composites Market Volume Share (%), by Polymer 2025 & 2033
- Figure 27: North America Natural Fiber Reinforced Composites Market Revenue (Million), by End-user Industry 2025 & 2033
- Figure 28: North America Natural Fiber Reinforced Composites Market Volume (K Tons), by End-user Industry 2025 & 2033
- Figure 29: North America Natural Fiber Reinforced Composites Market Revenue Share (%), by End-user Industry 2025 & 2033
- Figure 30: North America Natural Fiber Reinforced Composites Market Volume Share (%), by End-user Industry 2025 & 2033
- Figure 31: North America Natural Fiber Reinforced Composites Market Revenue (Million), by Country 2025 & 2033
- Figure 32: North America Natural Fiber Reinforced Composites Market Volume (K Tons), by Country 2025 & 2033
- Figure 33: North America Natural Fiber Reinforced Composites Market Revenue Share (%), by Country 2025 & 2033
- Figure 34: North America Natural Fiber Reinforced Composites Market Volume Share (%), by Country 2025 & 2033
- Figure 35: Europe Natural Fiber Reinforced Composites Market Revenue (Million), by Fiber 2025 & 2033
- Figure 36: Europe Natural Fiber Reinforced Composites Market Volume (K Tons), by Fiber 2025 & 2033
- Figure 37: Europe Natural Fiber Reinforced Composites Market Revenue Share (%), by Fiber 2025 & 2033
- Figure 38: Europe Natural Fiber Reinforced Composites Market Volume Share (%), by Fiber 2025 & 2033
- Figure 39: Europe Natural Fiber Reinforced Composites Market Revenue (Million), by Polymer 2025 & 2033
- Figure 40: Europe Natural Fiber Reinforced Composites Market Volume (K Tons), by Polymer 2025 & 2033
- Figure 41: Europe Natural Fiber Reinforced Composites Market Revenue Share (%), by Polymer 2025 & 2033
- Figure 42: Europe Natural Fiber Reinforced Composites Market Volume Share (%), by Polymer 2025 & 2033
- Figure 43: Europe Natural Fiber Reinforced Composites Market Revenue (Million), by End-user Industry 2025 & 2033
- Figure 44: Europe Natural Fiber Reinforced Composites Market Volume (K Tons), by End-user Industry 2025 & 2033
- Figure 45: Europe Natural Fiber Reinforced Composites Market Revenue Share (%), by End-user Industry 2025 & 2033
- Figure 46: Europe Natural Fiber Reinforced Composites Market Volume Share (%), by End-user Industry 2025 & 2033
- Figure 47: Europe Natural Fiber Reinforced Composites Market Revenue (Million), by Country 2025 & 2033
- Figure 48: Europe Natural Fiber Reinforced Composites Market Volume (K Tons), by Country 2025 & 2033
- Figure 49: Europe Natural Fiber Reinforced Composites Market Revenue Share (%), by Country 2025 & 2033
- Figure 50: Europe Natural Fiber Reinforced Composites Market Volume Share (%), by Country 2025 & 2033
- Figure 51: South America Natural Fiber Reinforced Composites Market Revenue (Million), by Fiber 2025 & 2033
- Figure 52: South America Natural Fiber Reinforced Composites Market Volume (K Tons), by Fiber 2025 & 2033
- Figure 53: South America Natural Fiber Reinforced Composites Market Revenue Share (%), by Fiber 2025 & 2033
- Figure 54: South America Natural Fiber Reinforced Composites Market Volume Share (%), by Fiber 2025 & 2033
- Figure 55: South America Natural Fiber Reinforced Composites Market Revenue (Million), by Polymer 2025 & 2033
- Figure 56: South America Natural Fiber Reinforced Composites Market Volume (K Tons), by Polymer 2025 & 2033
- Figure 57: South America Natural Fiber Reinforced Composites Market Revenue Share (%), by Polymer 2025 & 2033
- Figure 58: South America Natural Fiber Reinforced Composites Market Volume Share (%), by Polymer 2025 & 2033
- Figure 59: South America Natural Fiber Reinforced Composites Market Revenue (Million), by End-user Industry 2025 & 2033
- Figure 60: South America Natural Fiber Reinforced Composites Market Volume (K Tons), by End-user Industry 2025 & 2033
- Figure 61: South America Natural Fiber Reinforced Composites Market Revenue Share (%), by End-user Industry 2025 & 2033
- Figure 62: South America Natural Fiber Reinforced Composites Market Volume Share (%), by End-user Industry 2025 & 2033
- Figure 63: South America Natural Fiber Reinforced Composites Market Revenue (Million), by Country 2025 & 2033
- Figure 64: South America Natural Fiber Reinforced Composites Market Volume (K Tons), by Country 2025 & 2033
- Figure 65: South America Natural Fiber Reinforced Composites Market Revenue Share (%), by Country 2025 & 2033
- Figure 66: South America Natural Fiber Reinforced Composites Market Volume Share (%), by Country 2025 & 2033
- Figure 67: Middle East and Africa Natural Fiber Reinforced Composites Market Revenue (Million), by Fiber 2025 & 2033
- Figure 68: Middle East and Africa Natural Fiber Reinforced Composites Market Volume (K Tons), by Fiber 2025 & 2033
- Figure 69: Middle East and Africa Natural Fiber Reinforced Composites Market Revenue Share (%), by Fiber 2025 & 2033
- Figure 70: Middle East and Africa Natural Fiber Reinforced Composites Market Volume Share (%), by Fiber 2025 & 2033
- Figure 71: Middle East and Africa Natural Fiber Reinforced Composites Market Revenue (Million), by Polymer 2025 & 2033
- Figure 72: Middle East and Africa Natural Fiber Reinforced Composites Market Volume (K Tons), by Polymer 2025 & 2033
- Figure 73: Middle East and Africa Natural Fiber Reinforced Composites Market Revenue Share (%), by Polymer 2025 & 2033
- Figure 74: Middle East and Africa Natural Fiber Reinforced Composites Market Volume Share (%), by Polymer 2025 & 2033
- Figure 75: Middle East and Africa Natural Fiber Reinforced Composites Market Revenue (Million), by End-user Industry 2025 & 2033
- Figure 76: Middle East and Africa Natural Fiber Reinforced Composites Market Volume (K Tons), by End-user Industry 2025 & 2033
- Figure 77: Middle East and Africa Natural Fiber Reinforced Composites Market Revenue Share (%), by End-user Industry 2025 & 2033
- Figure 78: Middle East and Africa Natural Fiber Reinforced Composites Market Volume Share (%), by End-user Industry 2025 & 2033
- Figure 79: Middle East and Africa Natural Fiber Reinforced Composites Market Revenue (Million), by Country 2025 & 2033
- Figure 80: Middle East and Africa Natural Fiber Reinforced Composites Market Volume (K Tons), by Country 2025 & 2033
- Figure 81: Middle East and Africa Natural Fiber Reinforced Composites Market Revenue Share (%), by Country 2025 & 2033
- Figure 82: Middle East and Africa Natural Fiber Reinforced Composites Market Volume Share (%), by Country 2025 & 2033
List of Tables
- Table 1: Global Natural Fiber Reinforced Composites Market Revenue Million Forecast, by Fiber 2020 & 2033
- Table 2: Global Natural Fiber Reinforced Composites Market Volume K Tons Forecast, by Fiber 2020 & 2033
- Table 3: Global Natural Fiber Reinforced Composites Market Revenue Million Forecast, by Polymer 2020 & 2033
- Table 4: Global Natural Fiber Reinforced Composites Market Volume K Tons Forecast, by Polymer 2020 & 2033
- Table 5: Global Natural Fiber Reinforced Composites Market Revenue Million Forecast, by End-user Industry 2020 & 2033
- Table 6: Global Natural Fiber Reinforced Composites Market Volume K Tons Forecast, by End-user Industry 2020 & 2033
- Table 7: Global Natural Fiber Reinforced Composites Market Revenue Million Forecast, by Region 2020 & 2033
- Table 8: Global Natural Fiber Reinforced Composites Market Volume K Tons Forecast, by Region 2020 & 2033
- Table 9: Global Natural Fiber Reinforced Composites Market Revenue Million Forecast, by Fiber 2020 & 2033
- Table 10: Global Natural Fiber Reinforced Composites Market Volume K Tons Forecast, by Fiber 2020 & 2033
- Table 11: Global Natural Fiber Reinforced Composites Market Revenue Million Forecast, by Polymer 2020 & 2033
- Table 12: Global Natural Fiber Reinforced Composites Market Volume K Tons Forecast, by Polymer 2020 & 2033
- Table 13: Global Natural Fiber Reinforced Composites Market Revenue Million Forecast, by End-user Industry 2020 & 2033
- Table 14: Global Natural Fiber Reinforced Composites Market Volume K Tons Forecast, by End-user Industry 2020 & 2033
- Table 15: Global Natural Fiber Reinforced Composites Market Revenue Million Forecast, by Country 2020 & 2033
- Table 16: Global Natural Fiber Reinforced Composites Market Volume K Tons Forecast, by Country 2020 & 2033
- Table 17: China Natural Fiber Reinforced Composites Market Revenue (Million) Forecast, by Application 2020 & 2033
- Table 18: China Natural Fiber Reinforced Composites Market Volume (K Tons) Forecast, by Application 2020 & 2033
- Table 19: India Natural Fiber Reinforced Composites Market Revenue (Million) Forecast, by Application 2020 & 2033
- Table 20: India Natural Fiber Reinforced Composites Market Volume (K Tons) Forecast, by Application 2020 & 2033
- Table 21: Japan Natural Fiber Reinforced Composites Market Revenue (Million) Forecast, by Application 2020 & 2033
- Table 22: Japan Natural Fiber Reinforced Composites Market Volume (K Tons) Forecast, by Application 2020 & 2033
- Table 23: South Korea Natural Fiber Reinforced Composites Market Revenue (Million) Forecast, by Application 2020 & 2033
- Table 24: South Korea Natural Fiber Reinforced Composites Market Volume (K Tons) Forecast, by Application 2020 & 2033
- Table 25: Malaysia Natural Fiber Reinforced Composites Market Revenue (Million) Forecast, by Application 2020 & 2033
- Table 26: Malaysia Natural Fiber Reinforced Composites Market Volume (K Tons) Forecast, by Application 2020 & 2033
- Table 27: Thailand Natural Fiber Reinforced Composites Market Revenue (Million) Forecast, by Application 2020 & 2033
- Table 28: Thailand Natural Fiber Reinforced Composites Market Volume (K Tons) Forecast, by Application 2020 & 2033
- Table 29: Indonesia Natural Fiber Reinforced Composites Market Revenue (Million) Forecast, by Application 2020 & 2033
- Table 30: Indonesia Natural Fiber Reinforced Composites Market Volume (K Tons) Forecast, by Application 2020 & 2033
- Table 31: Vietnam Natural Fiber Reinforced Composites Market Revenue (Million) Forecast, by Application 2020 & 2033
- Table 32: Vietnam Natural Fiber Reinforced Composites Market Volume (K Tons) Forecast, by Application 2020 & 2033
- Table 33: Rest of Asia Pacific Natural Fiber Reinforced Composites Market Revenue (Million) Forecast, by Application 2020 & 2033
- Table 34: Rest of Asia Pacific Natural Fiber Reinforced Composites Market Volume (K Tons) Forecast, by Application 2020 & 2033
- Table 35: Global Natural Fiber Reinforced Composites Market Revenue Million Forecast, by Fiber 2020 & 2033
- Table 36: Global Natural Fiber Reinforced Composites Market Volume K Tons Forecast, by Fiber 2020 & 2033
- Table 37: Global Natural Fiber Reinforced Composites Market Revenue Million Forecast, by Polymer 2020 & 2033
- Table 38: Global Natural Fiber Reinforced Composites Market Volume K Tons Forecast, by Polymer 2020 & 2033
- Table 39: Global Natural Fiber Reinforced Composites Market Revenue Million Forecast, by End-user Industry 2020 & 2033
- Table 40: Global Natural Fiber Reinforced Composites Market Volume K Tons Forecast, by End-user Industry 2020 & 2033
- Table 41: Global Natural Fiber Reinforced Composites Market Revenue Million Forecast, by Country 2020 & 2033
- Table 42: Global Natural Fiber Reinforced Composites Market Volume K Tons Forecast, by Country 2020 & 2033
- Table 43: United States Natural Fiber Reinforced Composites Market Revenue (Million) Forecast, by Application 2020 & 2033
- Table 44: United States Natural Fiber Reinforced Composites Market Volume (K Tons) Forecast, by Application 2020 & 2033
- Table 45: Canada Natural Fiber Reinforced Composites Market Revenue (Million) Forecast, by Application 2020 & 2033
- Table 46: Canada Natural Fiber Reinforced Composites Market Volume (K Tons) Forecast, by Application 2020 & 2033
- Table 47: Mexico Natural Fiber Reinforced Composites Market Revenue (Million) Forecast, by Application 2020 & 2033
- Table 48: Mexico Natural Fiber Reinforced Composites Market Volume (K Tons) Forecast, by Application 2020 & 2033
- Table 49: Global Natural Fiber Reinforced Composites Market Revenue Million Forecast, by Fiber 2020 & 2033
- Table 50: Global Natural Fiber Reinforced Composites Market Volume K Tons Forecast, by Fiber 2020 & 2033
- Table 51: Global Natural Fiber Reinforced Composites Market Revenue Million Forecast, by Polymer 2020 & 2033
- Table 52: Global Natural Fiber Reinforced Composites Market Volume K Tons Forecast, by Polymer 2020 & 2033
- Table 53: Global Natural Fiber Reinforced Composites Market Revenue Million Forecast, by End-user Industry 2020 & 2033
- Table 54: Global Natural Fiber Reinforced Composites Market Volume K Tons Forecast, by End-user Industry 2020 & 2033
- Table 55: Global Natural Fiber Reinforced Composites Market Revenue Million Forecast, by Country 2020 & 2033
- Table 56: Global Natural Fiber Reinforced Composites Market Volume K Tons Forecast, by Country 2020 & 2033
- Table 57: Germany Natural Fiber Reinforced Composites Market Revenue (Million) Forecast, by Application 2020 & 2033
- Table 58: Germany Natural Fiber Reinforced Composites Market Volume (K Tons) Forecast, by Application 2020 & 2033
- Table 59: United Kingdom Natural Fiber Reinforced Composites Market Revenue (Million) Forecast, by Application 2020 & 2033
- Table 60: United Kingdom Natural Fiber Reinforced Composites Market Volume (K Tons) Forecast, by Application 2020 & 2033
- Table 61: France Natural Fiber Reinforced Composites Market Revenue (Million) Forecast, by Application 2020 & 2033
- Table 62: France Natural Fiber Reinforced Composites Market Volume (K Tons) Forecast, by Application 2020 & 2033
- Table 63: Italy Natural Fiber Reinforced Composites Market Revenue (Million) Forecast, by Application 2020 & 2033
- Table 64: Italy Natural Fiber Reinforced Composites Market Volume (K Tons) Forecast, by Application 2020 & 2033
- Table 65: Spain Natural Fiber Reinforced Composites Market Revenue (Million) Forecast, by Application 2020 & 2033
- Table 66: Spain Natural Fiber Reinforced Composites Market Volume (K Tons) Forecast, by Application 2020 & 2033
- Table 67: Nordic Countries Natural Fiber Reinforced Composites Market Revenue (Million) Forecast, by Application 2020 & 2033
- Table 68: Nordic Countries Natural Fiber Reinforced Composites Market Volume (K Tons) Forecast, by Application 2020 & 2033
- Table 69: Turkey Natural Fiber Reinforced Composites Market Revenue (Million) Forecast, by Application 2020 & 2033
- Table 70: Turkey Natural Fiber Reinforced Composites Market Volume (K Tons) Forecast, by Application 2020 & 2033
- Table 71: Russia Natural Fiber Reinforced Composites Market Revenue (Million) Forecast, by Application 2020 & 2033
- Table 72: Russia Natural Fiber Reinforced Composites Market Volume (K Tons) Forecast, by Application 2020 & 2033
- Table 73: Rest of Europe Natural Fiber Reinforced Composites Market Revenue (Million) Forecast, by Application 2020 & 2033
- Table 74: Rest of Europe Natural Fiber Reinforced Composites Market Volume (K Tons) Forecast, by Application 2020 & 2033
- Table 75: Global Natural Fiber Reinforced Composites Market Revenue Million Forecast, by Fiber 2020 & 2033
- Table 76: Global Natural Fiber Reinforced Composites Market Volume K Tons Forecast, by Fiber 2020 & 2033
- Table 77: Global Natural Fiber Reinforced Composites Market Revenue Million Forecast, by Polymer 2020 & 2033
- Table 78: Global Natural Fiber Reinforced Composites Market Volume K Tons Forecast, by Polymer 2020 & 2033
- Table 79: Global Natural Fiber Reinforced Composites Market Revenue Million Forecast, by End-user Industry 2020 & 2033
- Table 80: Global Natural Fiber Reinforced Composites Market Volume K Tons Forecast, by End-user Industry 2020 & 2033
- Table 81: Global Natural Fiber Reinforced Composites Market Revenue Million Forecast, by Country 2020 & 2033
- Table 82: Global Natural Fiber Reinforced Composites Market Volume K Tons Forecast, by Country 2020 & 2033
- Table 83: Brazil Natural Fiber Reinforced Composites Market Revenue (Million) Forecast, by Application 2020 & 2033
- Table 84: Brazil Natural Fiber Reinforced Composites Market Volume (K Tons) Forecast, by Application 2020 & 2033
- Table 85: Argentina Natural Fiber Reinforced Composites Market Revenue (Million) Forecast, by Application 2020 & 2033
- Table 86: Argentina Natural Fiber Reinforced Composites Market Volume (K Tons) Forecast, by Application 2020 & 2033
- Table 87: Colombia Natural Fiber Reinforced Composites Market Revenue (Million) Forecast, by Application 2020 & 2033
- Table 88: Colombia Natural Fiber Reinforced Composites Market Volume (K Tons) Forecast, by Application 2020 & 2033
- Table 89: Rest of South America Natural Fiber Reinforced Composites Market Revenue (Million) Forecast, by Application 2020 & 2033
- Table 90: Rest of South America Natural Fiber Reinforced Composites Market Volume (K Tons) Forecast, by Application 2020 & 2033
- Table 91: Global Natural Fiber Reinforced Composites Market Revenue Million Forecast, by Fiber 2020 & 2033
- Table 92: Global Natural Fiber Reinforced Composites Market Volume K Tons Forecast, by Fiber 2020 & 2033
- Table 93: Global Natural Fiber Reinforced Composites Market Revenue Million Forecast, by Polymer 2020 & 2033
- Table 94: Global Natural Fiber Reinforced Composites Market Volume K Tons Forecast, by Polymer 2020 & 2033
- Table 95: Global Natural Fiber Reinforced Composites Market Revenue Million Forecast, by End-user Industry 2020 & 2033
- Table 96: Global Natural Fiber Reinforced Composites Market Volume K Tons Forecast, by End-user Industry 2020 & 2033
- Table 97: Global Natural Fiber Reinforced Composites Market Revenue Million Forecast, by Country 2020 & 2033
- Table 98: Global Natural Fiber Reinforced Composites Market Volume K Tons Forecast, by Country 2020 & 2033
- Table 99: Saudi Arabia Natural Fiber Reinforced Composites Market Revenue (Million) Forecast, by Application 2020 & 2033
- Table 100: Saudi Arabia Natural Fiber Reinforced Composites Market Volume (K Tons) Forecast, by Application 2020 & 2033
- Table 101: Qatar Natural Fiber Reinforced Composites Market Revenue (Million) Forecast, by Application 2020 & 2033
- Table 102: Qatar Natural Fiber Reinforced Composites Market Volume (K Tons) Forecast, by Application 2020 & 2033
- Table 103: United Arab Emirates Natural Fiber Reinforced Composites Market Revenue (Million) Forecast, by Application 2020 & 2033
- Table 104: United Arab Emirates Natural Fiber Reinforced Composites Market Volume (K Tons) Forecast, by Application 2020 & 2033
- Table 105: Nigeria Natural Fiber Reinforced Composites Market Revenue (Million) Forecast, by Application 2020 & 2033
- Table 106: Nigeria Natural Fiber Reinforced Composites Market Volume (K Tons) Forecast, by Application 2020 & 2033
- Table 107: Egypt Natural Fiber Reinforced Composites Market Revenue (Million) Forecast, by Application 2020 & 2033
- Table 108: Egypt Natural Fiber Reinforced Composites Market Volume (K Tons) Forecast, by Application 2020 & 2033
- Table 109: South Africa Natural Fiber Reinforced Composites Market Revenue (Million) Forecast, by Application 2020 & 2033
- Table 110: South Africa Natural Fiber Reinforced Composites Market Volume (K Tons) Forecast, by Application 2020 & 2033
- Table 111: Rest of Middle East and Africa Natural Fiber Reinforced Composites Market Revenue (Million) Forecast, by Application 2020 & 2033
- Table 112: Rest of Middle East and Africa Natural Fiber Reinforced Composites Market Volume (K Tons) Forecast, by Application 2020 & 2033
Frequently Asked Questions
1. What is the projected Compound Annual Growth Rate (CAGR) of the Natural Fiber Reinforced Composites Market?
The projected CAGR is approximately 5.3%.
2. Which companies are prominent players in the Natural Fiber Reinforced Composites Market?
Key companies in the market include Beologic, Amorim Cork Composites SA, BPREG Composites, JELU-WERK J Ehrler GmbH & Co KG, Green Dot Bioplastics, TECNARO GmbH, Trex Company Inc, Fiberon, UPM, GreenGran BN, Wuhu Haoxuan Wood Plastic Composite Co Ltd, FKuR, Flexform Technologies, UFP Technologies Inc, Oldcastle APG, The AZEK Company Inc.
3. What are the main segments of the Natural Fiber Reinforced Composites Market?
The market segments include Fiber, Polymer, End-user Industry.
4. Can you provide details about the market size?
The market size is estimated to be USD 2,995.3 Million as of 2022.
5. What are some drivers contributing to market growth?
Increasing Demand for Bio-based Composites; Growth in the Automotive Industry Worldwide.
6. What are the notable trends driving market growth?
The Construction Industry is Expected to Dominate the Market.
7. Are there any restraints impacting market growth?
Moisture Adsorption. Restricted Processing Temperature. and Incompatibility with Most of the Polymer Matrices; Degradation Issue Due to Exposure to the External Environment.
8. Can you provide examples of recent developments in the market?
June 2023: Trex Company introduced Trex Select T-Rail. The wood composite railing system, which includes a popular T-shaped top rail, is intended to make the beauty and convenience of Trex's high-performance wood composite railing available to a wider audience at prices that compete head-to-head with PVC vinyl railing.
9. What pricing options are available for accessing the report?
Pricing options include single-user, multi-user, and enterprise licenses priced at USD 4750, USD 5250, and USD 8750 respectively.
10. Is the market size provided in terms of value or volume?
The market size is provided in terms of value, measured in Million and volume, measured in K Tons.
11. Are there any specific market keywords associated with the report?
Yes, the market keyword associated with the report is "Natural Fiber Reinforced Composites Market," which aids in identifying and referencing the specific market segment covered.
12. How do I determine which pricing option suits my needs best?
The pricing options vary based on user requirements and access needs. Individual users may opt for single-user licenses, while businesses requiring broader access may choose multi-user or enterprise licenses for cost-effective access to the report.
13. Are there any additional resources or data provided in the Natural Fiber Reinforced Composites Market report?
While the report offers comprehensive insights, it's advisable to review the specific contents or supplementary materials provided to ascertain if additional resources or data are available.
14. How can I stay updated on further developments or reports in the Natural Fiber Reinforced Composites Market?
To stay informed about further developments, trends, and reports in the Natural Fiber Reinforced Composites Market, consider subscribing to industry newsletters, following relevant companies and organizations, or regularly checking reputable industry news sources and publications.
Methodology
Step 1 - Identification of Relevant Samples Size from Population Database


Step 2 - Approaches for Defining Global Market Size (Value, Volume* & Price*)

Note*: In applicable scenarios
Step 3 - Data Sources
Primary Research
- Web Analytics
- Survey Reports
- Research Institute
- Latest Research Reports
- Opinion Leaders
Secondary Research
- Annual Reports
- White Paper
- Latest Press Release
- Industry Association
- Paid Database
- Investor Presentations

Step 4 - Data Triangulation
Involves using different sources of information in order to increase the validity of a study
These sources are likely to be stakeholders in a program - participants, other researchers, program staff, other community members, and so on.
Then we put all data in single framework & apply various statistical tools to find out the dynamic on the market.
During the analysis stage, feedback from the stakeholder groups would be compared to determine areas of agreement as well as areas of divergence