

Key Insights
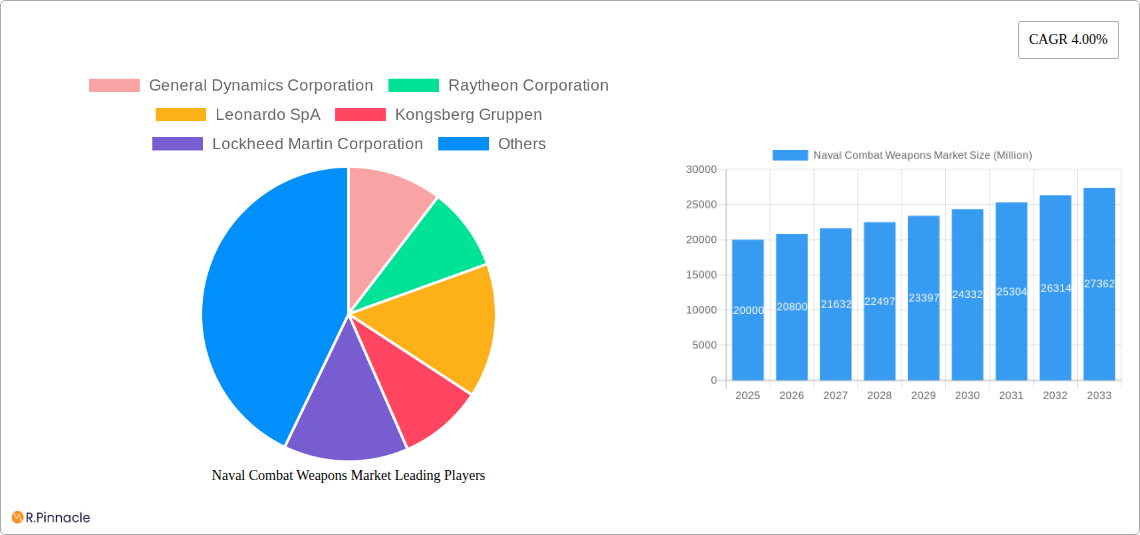
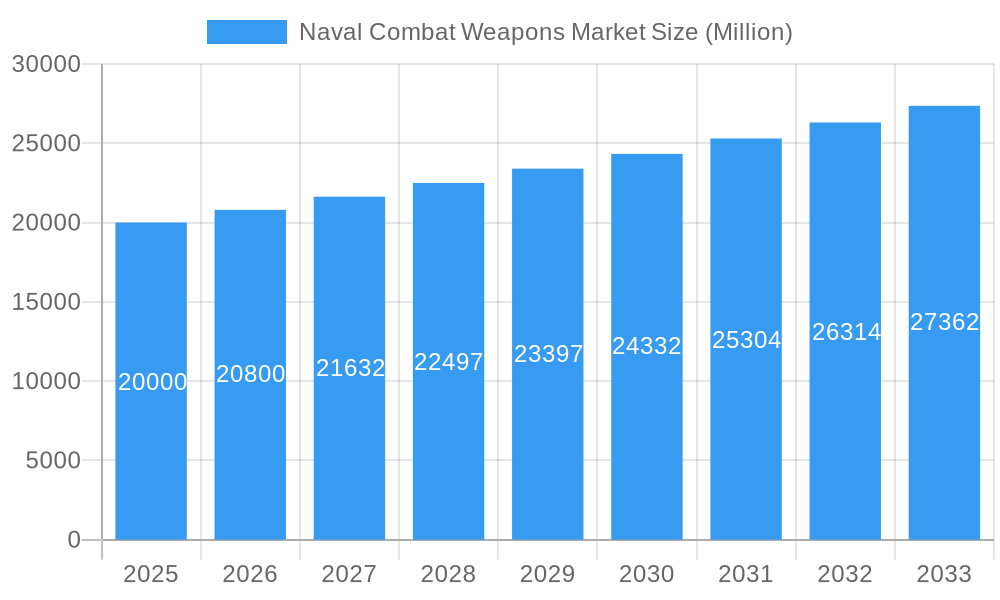
The Naval Combat Weapons market, valued at an estimated 10.38 billion in 2025, is projected for significant expansion, forecasting a compound annual growth rate (CAGR) of 7.52% from 2025 to 2033. This growth is propelled by escalating geopolitical instability and increasing global defense expenditures, driving demand for sophisticated naval armament. Technological innovations, including precision-guided munitions, hypersonic weaponry, and autonomous systems, are substantially augmenting the efficacy and lethality of naval combat platforms. Moreover, the ongoing modernization and expansion of naval fleets worldwide, particularly in the Asia-Pacific and Middle East regions, are generating considerable market opportunities. The market is segmented by platform (Underwater-Based, Surface-Based) and application (Small Patrol Boats, Large Aircraft Carriers, Submarines), reflecting diverse deployment scenarios. Key industry participants, including General Dynamics, Raytheon, Lockheed Martin, and Thales, are competing through innovation, strategic alliances, and government contracts.
Naval Combat Weapons Market Market Size (In Billion)
Market growth is tempered by challenges such as high research and development costs for advanced systems, which can impede market entry for smaller enterprises. Stringent regulatory frameworks and export controls on military equipment also present significant restraints. Despite these hurdles, the long-term outlook for the Naval Combat Weapons market remains favorable, supported by continuous investment in naval modernization and sustained demand for superior defense capabilities. Regional growth variations are anticipated, with Asia-Pacific and North America expected to lead market share due to substantial defense budgets and geopolitical importance. Future expansion will likely depend on the adoption of advanced technologies, the development of effective countermeasures, and strategic collaborations between defense contractors and government entities.
Naval Combat Weapons Market Company Market Share
Naval Combat Weapons Market: A Comprehensive Report (2019-2033)
This in-depth report provides a comprehensive analysis of the Naval Combat Weapons Market, offering invaluable insights for industry professionals, investors, and strategic decision-makers. With a study period spanning 2019-2033, a base year of 2025, and a forecast period of 2025-2033, this report delivers actionable intelligence to navigate the evolving landscape of naval warfare technology. The market is segmented by platform type (Underwater-Based Naval Combat Weapons, Surface-Based Combat Weapons) and application (Small Patrol Boats, Large Aircraft Carriers, Submarines). The report's value surpasses $xx Million in 2025 and is projected to reach $xx Million by 2033, exhibiting a CAGR of xx%.
Naval Combat Weapons Market Structure & Innovation Trends
The Naval Combat Weapons market demonstrates a moderately concentrated structure, with key players holding significant market share. General Dynamics Corporation, Raytheon Corporation, and Lockheed Martin Corporation collectively account for approximately xx% of the market share in 2025. Innovation is driven by the need for enhanced accuracy, range, and lethality, fueled by geopolitical instability and technological advancements. Stringent regulatory frameworks govern the development, production, and export of naval weaponry, impacting market dynamics. Product substitution is limited due to the specialized nature of these weapons, although advancements in directed energy weapons could pose a potential long-term threat. End-users primarily comprise government defense agencies and navies worldwide. M&A activity has been significant in recent years, with deal values exceeding $xx Million in the last five years, primarily focused on acquiring specialized technologies and expanding market reach.
- Market Concentration: Moderately concentrated, with top three players holding xx% market share (2025).
- Innovation Drivers: Enhanced accuracy, range, lethality, and technological advancements.
- Regulatory Frameworks: Stringent controls on development, production, and export.
- Product Substitutes: Limited, but directed energy weapons pose a potential future threat.
- M&A Activity: Significant, with deal values exceeding $xx Million in the last five years.
Naval Combat Weapons Market Dynamics & Trends
The Naval Combat Weapons market is experiencing robust growth, driven by escalating geopolitical tensions, rising defense budgets globally, and the modernization of naval fleets. Technological disruptions, such as the integration of AI and autonomous systems, are reshaping the market landscape. Consumer preferences (i.e., navies) are shifting towards more advanced, precise, and adaptable weaponry. Competitive dynamics are intense, with established players investing heavily in R&D and emerging companies challenging the status quo with innovative solutions. The market penetration of advanced technologies, such as hypersonic weapons, is still relatively low but expected to increase significantly during the forecast period.
Dominant Regions & Segments in Naval Combat Weapons Market
The Asia-Pacific region is projected to dominate the Naval Combat Weapons market during the forecast period, driven by substantial investments in naval modernization by countries like China and India. Within platform types, Surface-Based Combat Weapons currently hold a larger market share compared to Underwater-Based Naval Combat Weapons, but the latter segment is anticipated to see faster growth. Among applications, Large Aircraft Carriers and Submarines represent the largest market segments due to their strategic importance and high weapon integration needs.
Key Drivers for Asia-Pacific Dominance:
- Substantial investments in naval modernization.
- Increasing geopolitical tensions in the region.
- Growing defense budgets.
Surface-Based Combat Weapons: Larger current market share, driven by widespread adoption across various naval vessels.
Underwater-Based Naval Combat Weapons: Faster growth potential due to technological advancements and strategic importance of submarine warfare.
Large Aircraft Carriers & Submarines: Largest application segments due to high weapon integration needs and strategic importance.
Naval Combat Weapons Market Product Innovations
Recent product innovations focus on improved precision-guided munitions, advanced sensor technologies, and the integration of AI for autonomous targeting. These developments enhance the effectiveness and survivability of naval combat weapons, while also reducing collateral damage. The market is witnessing a growing trend toward modular and adaptable weapon systems, allowing for easier upgrades and integration into diverse platforms. This modularity improves cost-effectiveness and reduces lifecycle costs, making it attractive to navies with varying budgetary constraints.
Report Scope & Segmentation Analysis
This report comprehensively analyzes the Naval Combat Weapons market, segmented by platform type (Underwater-Based and Surface-Based) and application (Small Patrol Boats, Large Aircraft Carriers, Submarines). Each segment's growth projection, market size, and competitive dynamics are thoroughly examined. The Underwater-Based segment is expected to witness significant growth driven by advancements in underwater technologies. The Surface-Based segment is currently larger but will see stable growth. The Large Aircraft Carriers and Submarine applications are the most lucrative, driving a significant portion of market revenue.
Key Drivers of Naval Combat Weapons Market Growth
The Naval Combat Weapons market is driven by several key factors: increasing geopolitical instability, rising global defense spending, technological advancements such as AI and hypersonic weapons, and a growing need for modernized naval fleets to counter evolving threats. Government initiatives promoting defense modernization and technological advancements also play a crucial role.
Challenges in the Naval Combat Weapons Market Sector
Challenges include stringent export controls, the high cost of R&D and production, potential supply chain disruptions, and intense competition among major players. These factors can impact profitability and market entry for new entrants. Furthermore, the evolving technological landscape necessitates continuous investments in R&D to maintain a competitive edge.
Emerging Opportunities in Naval Combat Weapons Market
Emerging opportunities include the development of directed energy weapons, unmanned underwater vehicles (UUVs) carrying advanced weaponry, and the integration of cyber warfare capabilities into naval combat systems. The market also presents opportunities for companies specializing in developing sustainable and environmentally friendly weapon systems.
Leading Players in the Naval Combat Weapons Market
- General Dynamics Corporation
- Raytheon Corporation
- Leonardo SpA
- Kongsberg Gruppen
- Lockheed Martin Corporation
- Terma
- QinetiQ Group
- Elbit Systems
- Thales Corporation
- L3 Harris Corporation
- BAE Systems Plc
- SAAB AB
Key Developments in Naval Combat Weapons Market Industry
- January 2023: Raytheon successfully tested a new hypersonic missile system.
- March 2022: Lockheed Martin secured a contract for the upgrade of naval combat systems.
- June 2021: General Dynamics announced a new partnership for the development of advanced torpedoes.
- (Add more recent developments as available)
Future Outlook for Naval Combat Weapons Market
The Naval Combat Weapons market is poised for continued growth, driven by persistent geopolitical uncertainty, technological advancements, and increased defense spending. Strategic partnerships, innovation in autonomous systems, and the focus on enhancing precision strike capabilities will shape the future market landscape. Companies that successfully adapt to these trends and invest in R&D are likely to gain a significant competitive advantage.
Naval Combat Weapons Market Segmentation
- 1. Production Analysis
- 2. Consumption Analysis
- 3. Import Market Analysis (Value & Volume)
- 4. Export Market Analysis (Value & Volume)
- 5. Price Trend Analysis
Naval Combat Weapons Market Segmentation By Geography
-
1. North America
- 1.1. United States
- 1.2. Canada
- 1.3. Mexico
-
2. South America
- 2.1. Brazil
- 2.2. Argentina
- 2.3. Rest of South America
-
3. Europe
- 3.1. United Kingdom
- 3.2. Germany
- 3.3. France
- 3.4. Italy
- 3.5. Spain
- 3.6. Russia
- 3.7. Benelux
- 3.8. Nordics
- 3.9. Rest of Europe
-
4. Middle East & Africa
- 4.1. Turkey
- 4.2. Israel
- 4.3. GCC
- 4.4. North Africa
- 4.5. South Africa
- 4.6. Rest of Middle East & Africa
-
5. Asia Pacific
- 5.1. China
- 5.2. India
- 5.3. Japan
- 5.4. South Korea
- 5.5. ASEAN
- 5.6. Oceania
- 5.7. Rest of Asia Pacific
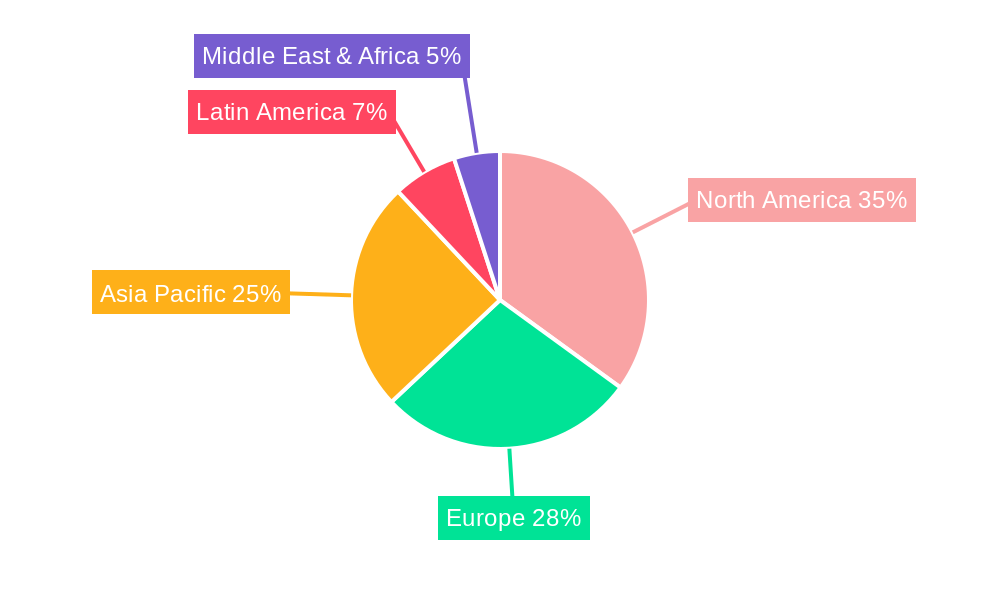
Naval Combat Weapons Market Regional Market Share
Geographic Coverage of Naval Combat Weapons Market
Naval Combat Weapons Market REPORT HIGHLIGHTS
| Aspects | Details |
|---|---|
| Study Period | 2020-2034 |
| Base Year | 2025 |
| Estimated Year | 2026 |
| Forecast Period | 2026-2034 |
| Historical Period | 2020-2025 |
| Growth Rate | CAGR of 7.52% from 2020-2034 |
| Segmentation |
|
Table of Contents
- 1. Introduction
- 1.1. Research Scope
- 1.2. Market Segmentation
- 1.3. Research Objective
- 1.4. Definitions and Assumptions
- 2. Executive Summary
- 2.1. Market Snapshot
- 3. Market Dynamics
- 3.1. Market Drivers
- 3.2. Market Restrains
- 3.3. Market Trends
- 3.4. Market Opportunities
- 4. Market Factor Analysis
- 4.1. Porters Five Forces
- 4.1.1. Bargaining Power of Suppliers
- 4.1.2. Bargaining Power of Buyers
- 4.1.3. Threat of New Entrants
- 4.1.4. Threat of Substitutes
- 4.1.5. Competitive Rivalry
- 4.2. PESTEL analysis
- 4.3. BCG Analysis
- 4.3.1. Stars (High Growth, High Market Share)
- 4.3.2. Cash Cows (Low Growth, High Market Share)
- 4.3.3. Question Mark (High Growth, Low Market Share)
- 4.3.4. Dogs (Low Growth, Low Market Share)
- 4.4. Ansoff Matrix Analysis
- 4.5. Supply Chain Analysis
- 4.6. Regulatory Landscape
- 4.7. Current Market Potential and Opportunity Assessment (TAM–SAM–SOM Framework)
- 4.8. PRI Analyst Note
- 4.1. Porters Five Forces
- 5. Market Analysis, Insights and Forecast 2021-2033
- 5.1. Market Analysis, Insights and Forecast - by Production Analysis
- 5.2. Market Analysis, Insights and Forecast - by Consumption Analysis
- 5.3. Market Analysis, Insights and Forecast - by Import Market Analysis (Value & Volume)
- 5.4. Market Analysis, Insights and Forecast - by Export Market Analysis (Value & Volume)
- 5.5. Market Analysis, Insights and Forecast - by Price Trend Analysis
- 5.6. Market Analysis, Insights and Forecast - by Region
- 5.6.1. North America
- 5.6.2. South America
- 5.6.3. Europe
- 5.6.4. Middle East & Africa
- 5.6.5. Asia Pacific
- 6. Global Naval Combat Weapons Market Analysis, Insights and Forecast, 2021-2033
- 6.1. Market Analysis, Insights and Forecast - by Production Analysis
- 6.2. Market Analysis, Insights and Forecast - by Consumption Analysis
- 6.3. Market Analysis, Insights and Forecast - by Import Market Analysis (Value & Volume)
- 6.4. Market Analysis, Insights and Forecast - by Export Market Analysis (Value & Volume)
- 6.5. Market Analysis, Insights and Forecast - by Price Trend Analysis
- 7. North America Naval Combat Weapons Market Analysis, Insights and Forecast, 2020-2032
- 7.1. Market Analysis, Insights and Forecast - by Production Analysis
- 7.2. Market Analysis, Insights and Forecast - by Consumption Analysis
- 7.3. Market Analysis, Insights and Forecast - by Import Market Analysis (Value & Volume)
- 7.4. Market Analysis, Insights and Forecast - by Export Market Analysis (Value & Volume)
- 7.5. Market Analysis, Insights and Forecast - by Price Trend Analysis
- 8. South America Naval Combat Weapons Market Analysis, Insights and Forecast, 2020-2032
- 8.1. Market Analysis, Insights and Forecast - by Production Analysis
- 8.2. Market Analysis, Insights and Forecast - by Consumption Analysis
- 8.3. Market Analysis, Insights and Forecast - by Import Market Analysis (Value & Volume)
- 8.4. Market Analysis, Insights and Forecast - by Export Market Analysis (Value & Volume)
- 8.5. Market Analysis, Insights and Forecast - by Price Trend Analysis
- 9. Europe Naval Combat Weapons Market Analysis, Insights and Forecast, 2020-2032
- 9.1. Market Analysis, Insights and Forecast - by Production Analysis
- 9.2. Market Analysis, Insights and Forecast - by Consumption Analysis
- 9.3. Market Analysis, Insights and Forecast - by Import Market Analysis (Value & Volume)
- 9.4. Market Analysis, Insights and Forecast - by Export Market Analysis (Value & Volume)
- 9.5. Market Analysis, Insights and Forecast - by Price Trend Analysis
- 10. Middle East & Africa Naval Combat Weapons Market Analysis, Insights and Forecast, 2020-2032
- 10.1. Market Analysis, Insights and Forecast - by Production Analysis
- 10.2. Market Analysis, Insights and Forecast - by Consumption Analysis
- 10.3. Market Analysis, Insights and Forecast - by Import Market Analysis (Value & Volume)
- 10.4. Market Analysis, Insights and Forecast - by Export Market Analysis (Value & Volume)
- 10.5. Market Analysis, Insights and Forecast - by Price Trend Analysis
- 11. Asia Pacific Naval Combat Weapons Market Analysis, Insights and Forecast, 2020-2032
- 11.1. Market Analysis, Insights and Forecast - by Production Analysis
- 11.2. Market Analysis, Insights and Forecast - by Consumption Analysis
- 11.3. Market Analysis, Insights and Forecast - by Import Market Analysis (Value & Volume)
- 11.4. Market Analysis, Insights and Forecast - by Export Market Analysis (Value & Volume)
- 11.5. Market Analysis, Insights and Forecast - by Price Trend Analysis
- 12. Competitive Analysis
- 12.1. Company Profiles
- 12.1.1 General Dynamics Corporation
- 12.1.1.1. Company Overview
- 12.1.1.2. Products
- 12.1.1.3. Company Financials
- 12.1.1.4. SWOT Analysis
- 12.1.2 Raytheon Corporation
- 12.1.2.1. Company Overview
- 12.1.2.2. Products
- 12.1.2.3. Company Financials
- 12.1.2.4. SWOT Analysis
- 12.1.3 Leonardo SpA
- 12.1.3.1. Company Overview
- 12.1.3.2. Products
- 12.1.3.3. Company Financials
- 12.1.3.4. SWOT Analysis
- 12.1.4 Kongsberg Gruppen
- 12.1.4.1. Company Overview
- 12.1.4.2. Products
- 12.1.4.3. Company Financials
- 12.1.4.4. SWOT Analysis
- 12.1.5 Lockheed Martin Corporation
- 12.1.5.1. Company Overview
- 12.1.5.2. Products
- 12.1.5.3. Company Financials
- 12.1.5.4. SWOT Analysis
- 12.1.6 Terma
- 12.1.6.1. Company Overview
- 12.1.6.2. Products
- 12.1.6.3. Company Financials
- 12.1.6.4. SWOT Analysis
- 12.1.7 QinetiQ Grou
- 12.1.7.1. Company Overview
- 12.1.7.2. Products
- 12.1.7.3. Company Financials
- 12.1.7.4. SWOT Analysis
- 12.1.8 Elbit Systems
- 12.1.8.1. Company Overview
- 12.1.8.2. Products
- 12.1.8.3. Company Financials
- 12.1.8.4. SWOT Analysis
- 12.1.9 Thales Corporation
- 12.1.9.1. Company Overview
- 12.1.9.2. Products
- 12.1.9.3. Company Financials
- 12.1.9.4. SWOT Analysis
- 12.1.10 L3 Harris Corporation
- 12.1.10.1. Company Overview
- 12.1.10.2. Products
- 12.1.10.3. Company Financials
- 12.1.10.4. SWOT Analysis
- 12.1.11 BAE Systems Plc
- 12.1.11.1. Company Overview
- 12.1.11.2. Products
- 12.1.11.3. Company Financials
- 12.1.11.4. SWOT Analysis
- 12.1.12 SAAB AB
- 12.1.12.1. Company Overview
- 12.1.12.2. Products
- 12.1.12.3. Company Financials
- 12.1.12.4. SWOT Analysis
- 12.1.1 General Dynamics Corporation
- 12.2. Market Entropy
- 12.2.1 Company's Key Areas Served
- 12.2.2 Recent Developments
- 12.3. Company Market Share Analysis 2025
- 12.3.1 Top 5 Companies Market Share Analysis
- 12.3.2 Top 3 Companies Market Share Analysis
- 12.4. List of Potential Customers
- 13. Research Methodology
List of Figures
- Figure 1: Global Naval Combat Weapons Market Revenue Breakdown (billion, %) by Region 2025 & 2033
- Figure 2: North America Naval Combat Weapons Market Revenue (billion), by Production Analysis 2025 & 2033
- Figure 3: North America Naval Combat Weapons Market Revenue Share (%), by Production Analysis 2025 & 2033
- Figure 4: North America Naval Combat Weapons Market Revenue (billion), by Consumption Analysis 2025 & 2033
- Figure 5: North America Naval Combat Weapons Market Revenue Share (%), by Consumption Analysis 2025 & 2033
- Figure 6: North America Naval Combat Weapons Market Revenue (billion), by Import Market Analysis (Value & Volume) 2025 & 2033
- Figure 7: North America Naval Combat Weapons Market Revenue Share (%), by Import Market Analysis (Value & Volume) 2025 & 2033
- Figure 8: North America Naval Combat Weapons Market Revenue (billion), by Export Market Analysis (Value & Volume) 2025 & 2033
- Figure 9: North America Naval Combat Weapons Market Revenue Share (%), by Export Market Analysis (Value & Volume) 2025 & 2033
- Figure 10: North America Naval Combat Weapons Market Revenue (billion), by Price Trend Analysis 2025 & 2033
- Figure 11: North America Naval Combat Weapons Market Revenue Share (%), by Price Trend Analysis 2025 & 2033
- Figure 12: North America Naval Combat Weapons Market Revenue (billion), by Country 2025 & 2033
- Figure 13: North America Naval Combat Weapons Market Revenue Share (%), by Country 2025 & 2033
- Figure 14: South America Naval Combat Weapons Market Revenue (billion), by Production Analysis 2025 & 2033
- Figure 15: South America Naval Combat Weapons Market Revenue Share (%), by Production Analysis 2025 & 2033
- Figure 16: South America Naval Combat Weapons Market Revenue (billion), by Consumption Analysis 2025 & 2033
- Figure 17: South America Naval Combat Weapons Market Revenue Share (%), by Consumption Analysis 2025 & 2033
- Figure 18: South America Naval Combat Weapons Market Revenue (billion), by Import Market Analysis (Value & Volume) 2025 & 2033
- Figure 19: South America Naval Combat Weapons Market Revenue Share (%), by Import Market Analysis (Value & Volume) 2025 & 2033
- Figure 20: South America Naval Combat Weapons Market Revenue (billion), by Export Market Analysis (Value & Volume) 2025 & 2033
- Figure 21: South America Naval Combat Weapons Market Revenue Share (%), by Export Market Analysis (Value & Volume) 2025 & 2033
- Figure 22: South America Naval Combat Weapons Market Revenue (billion), by Price Trend Analysis 2025 & 2033
- Figure 23: South America Naval Combat Weapons Market Revenue Share (%), by Price Trend Analysis 2025 & 2033
- Figure 24: South America Naval Combat Weapons Market Revenue (billion), by Country 2025 & 2033
- Figure 25: South America Naval Combat Weapons Market Revenue Share (%), by Country 2025 & 2033
- Figure 26: Europe Naval Combat Weapons Market Revenue (billion), by Production Analysis 2025 & 2033
- Figure 27: Europe Naval Combat Weapons Market Revenue Share (%), by Production Analysis 2025 & 2033
- Figure 28: Europe Naval Combat Weapons Market Revenue (billion), by Consumption Analysis 2025 & 2033
- Figure 29: Europe Naval Combat Weapons Market Revenue Share (%), by Consumption Analysis 2025 & 2033
- Figure 30: Europe Naval Combat Weapons Market Revenue (billion), by Import Market Analysis (Value & Volume) 2025 & 2033
- Figure 31: Europe Naval Combat Weapons Market Revenue Share (%), by Import Market Analysis (Value & Volume) 2025 & 2033
- Figure 32: Europe Naval Combat Weapons Market Revenue (billion), by Export Market Analysis (Value & Volume) 2025 & 2033
- Figure 33: Europe Naval Combat Weapons Market Revenue Share (%), by Export Market Analysis (Value & Volume) 2025 & 2033
- Figure 34: Europe Naval Combat Weapons Market Revenue (billion), by Price Trend Analysis 2025 & 2033
- Figure 35: Europe Naval Combat Weapons Market Revenue Share (%), by Price Trend Analysis 2025 & 2033
- Figure 36: Europe Naval Combat Weapons Market Revenue (billion), by Country 2025 & 2033
- Figure 37: Europe Naval Combat Weapons Market Revenue Share (%), by Country 2025 & 2033
- Figure 38: Middle East & Africa Naval Combat Weapons Market Revenue (billion), by Production Analysis 2025 & 2033
- Figure 39: Middle East & Africa Naval Combat Weapons Market Revenue Share (%), by Production Analysis 2025 & 2033
- Figure 40: Middle East & Africa Naval Combat Weapons Market Revenue (billion), by Consumption Analysis 2025 & 2033
- Figure 41: Middle East & Africa Naval Combat Weapons Market Revenue Share (%), by Consumption Analysis 2025 & 2033
- Figure 42: Middle East & Africa Naval Combat Weapons Market Revenue (billion), by Import Market Analysis (Value & Volume) 2025 & 2033
- Figure 43: Middle East & Africa Naval Combat Weapons Market Revenue Share (%), by Import Market Analysis (Value & Volume) 2025 & 2033
- Figure 44: Middle East & Africa Naval Combat Weapons Market Revenue (billion), by Export Market Analysis (Value & Volume) 2025 & 2033
- Figure 45: Middle East & Africa Naval Combat Weapons Market Revenue Share (%), by Export Market Analysis (Value & Volume) 2025 & 2033
- Figure 46: Middle East & Africa Naval Combat Weapons Market Revenue (billion), by Price Trend Analysis 2025 & 2033
- Figure 47: Middle East & Africa Naval Combat Weapons Market Revenue Share (%), by Price Trend Analysis 2025 & 2033
- Figure 48: Middle East & Africa Naval Combat Weapons Market Revenue (billion), by Country 2025 & 2033
- Figure 49: Middle East & Africa Naval Combat Weapons Market Revenue Share (%), by Country 2025 & 2033
- Figure 50: Asia Pacific Naval Combat Weapons Market Revenue (billion), by Production Analysis 2025 & 2033
- Figure 51: Asia Pacific Naval Combat Weapons Market Revenue Share (%), by Production Analysis 2025 & 2033
- Figure 52: Asia Pacific Naval Combat Weapons Market Revenue (billion), by Consumption Analysis 2025 & 2033
- Figure 53: Asia Pacific Naval Combat Weapons Market Revenue Share (%), by Consumption Analysis 2025 & 2033
- Figure 54: Asia Pacific Naval Combat Weapons Market Revenue (billion), by Import Market Analysis (Value & Volume) 2025 & 2033
- Figure 55: Asia Pacific Naval Combat Weapons Market Revenue Share (%), by Import Market Analysis (Value & Volume) 2025 & 2033
- Figure 56: Asia Pacific Naval Combat Weapons Market Revenue (billion), by Export Market Analysis (Value & Volume) 2025 & 2033
- Figure 57: Asia Pacific Naval Combat Weapons Market Revenue Share (%), by Export Market Analysis (Value & Volume) 2025 & 2033
- Figure 58: Asia Pacific Naval Combat Weapons Market Revenue (billion), by Price Trend Analysis 2025 & 2033
- Figure 59: Asia Pacific Naval Combat Weapons Market Revenue Share (%), by Price Trend Analysis 2025 & 2033
- Figure 60: Asia Pacific Naval Combat Weapons Market Revenue (billion), by Country 2025 & 2033
- Figure 61: Asia Pacific Naval Combat Weapons Market Revenue Share (%), by Country 2025 & 2033
List of Tables
- Table 1: Global Naval Combat Weapons Market Revenue billion Forecast, by Production Analysis 2020 & 2033
- Table 2: Global Naval Combat Weapons Market Revenue billion Forecast, by Consumption Analysis 2020 & 2033
- Table 3: Global Naval Combat Weapons Market Revenue billion Forecast, by Import Market Analysis (Value & Volume) 2020 & 2033
- Table 4: Global Naval Combat Weapons Market Revenue billion Forecast, by Export Market Analysis (Value & Volume) 2020 & 2033
- Table 5: Global Naval Combat Weapons Market Revenue billion Forecast, by Price Trend Analysis 2020 & 2033
- Table 6: Global Naval Combat Weapons Market Revenue billion Forecast, by Region 2020 & 2033
- Table 7: Global Naval Combat Weapons Market Revenue billion Forecast, by Production Analysis 2020 & 2033
- Table 8: Global Naval Combat Weapons Market Revenue billion Forecast, by Consumption Analysis 2020 & 2033
- Table 9: Global Naval Combat Weapons Market Revenue billion Forecast, by Import Market Analysis (Value & Volume) 2020 & 2033
- Table 10: Global Naval Combat Weapons Market Revenue billion Forecast, by Export Market Analysis (Value & Volume) 2020 & 2033
- Table 11: Global Naval Combat Weapons Market Revenue billion Forecast, by Price Trend Analysis 2020 & 2033
- Table 12: Global Naval Combat Weapons Market Revenue billion Forecast, by Country 2020 & 2033
- Table 13: United States Naval Combat Weapons Market Revenue (billion) Forecast, by Application 2020 & 2033
- Table 14: Canada Naval Combat Weapons Market Revenue (billion) Forecast, by Application 2020 & 2033
- Table 15: Mexico Naval Combat Weapons Market Revenue (billion) Forecast, by Application 2020 & 2033
- Table 16: Global Naval Combat Weapons Market Revenue billion Forecast, by Production Analysis 2020 & 2033
- Table 17: Global Naval Combat Weapons Market Revenue billion Forecast, by Consumption Analysis 2020 & 2033
- Table 18: Global Naval Combat Weapons Market Revenue billion Forecast, by Import Market Analysis (Value & Volume) 2020 & 2033
- Table 19: Global Naval Combat Weapons Market Revenue billion Forecast, by Export Market Analysis (Value & Volume) 2020 & 2033
- Table 20: Global Naval Combat Weapons Market Revenue billion Forecast, by Price Trend Analysis 2020 & 2033
- Table 21: Global Naval Combat Weapons Market Revenue billion Forecast, by Country 2020 & 2033
- Table 22: Brazil Naval Combat Weapons Market Revenue (billion) Forecast, by Application 2020 & 2033
- Table 23: Argentina Naval Combat Weapons Market Revenue (billion) Forecast, by Application 2020 & 2033
- Table 24: Rest of South America Naval Combat Weapons Market Revenue (billion) Forecast, by Application 2020 & 2033
- Table 25: Global Naval Combat Weapons Market Revenue billion Forecast, by Production Analysis 2020 & 2033
- Table 26: Global Naval Combat Weapons Market Revenue billion Forecast, by Consumption Analysis 2020 & 2033
- Table 27: Global Naval Combat Weapons Market Revenue billion Forecast, by Import Market Analysis (Value & Volume) 2020 & 2033
- Table 28: Global Naval Combat Weapons Market Revenue billion Forecast, by Export Market Analysis (Value & Volume) 2020 & 2033
- Table 29: Global Naval Combat Weapons Market Revenue billion Forecast, by Price Trend Analysis 2020 & 2033
- Table 30: Global Naval Combat Weapons Market Revenue billion Forecast, by Country 2020 & 2033
- Table 31: United Kingdom Naval Combat Weapons Market Revenue (billion) Forecast, by Application 2020 & 2033
- Table 32: Germany Naval Combat Weapons Market Revenue (billion) Forecast, by Application 2020 & 2033
- Table 33: France Naval Combat Weapons Market Revenue (billion) Forecast, by Application 2020 & 2033
- Table 34: Italy Naval Combat Weapons Market Revenue (billion) Forecast, by Application 2020 & 2033
- Table 35: Spain Naval Combat Weapons Market Revenue (billion) Forecast, by Application 2020 & 2033
- Table 36: Russia Naval Combat Weapons Market Revenue (billion) Forecast, by Application 2020 & 2033
- Table 37: Benelux Naval Combat Weapons Market Revenue (billion) Forecast, by Application 2020 & 2033
- Table 38: Nordics Naval Combat Weapons Market Revenue (billion) Forecast, by Application 2020 & 2033
- Table 39: Rest of Europe Naval Combat Weapons Market Revenue (billion) Forecast, by Application 2020 & 2033
- Table 40: Global Naval Combat Weapons Market Revenue billion Forecast, by Production Analysis 2020 & 2033
- Table 41: Global Naval Combat Weapons Market Revenue billion Forecast, by Consumption Analysis 2020 & 2033
- Table 42: Global Naval Combat Weapons Market Revenue billion Forecast, by Import Market Analysis (Value & Volume) 2020 & 2033
- Table 43: Global Naval Combat Weapons Market Revenue billion Forecast, by Export Market Analysis (Value & Volume) 2020 & 2033
- Table 44: Global Naval Combat Weapons Market Revenue billion Forecast, by Price Trend Analysis 2020 & 2033
- Table 45: Global Naval Combat Weapons Market Revenue billion Forecast, by Country 2020 & 2033
- Table 46: Turkey Naval Combat Weapons Market Revenue (billion) Forecast, by Application 2020 & 2033
- Table 47: Israel Naval Combat Weapons Market Revenue (billion) Forecast, by Application 2020 & 2033
- Table 48: GCC Naval Combat Weapons Market Revenue (billion) Forecast, by Application 2020 & 2033
- Table 49: North Africa Naval Combat Weapons Market Revenue (billion) Forecast, by Application 2020 & 2033
- Table 50: South Africa Naval Combat Weapons Market Revenue (billion) Forecast, by Application 2020 & 2033
- Table 51: Rest of Middle East & Africa Naval Combat Weapons Market Revenue (billion) Forecast, by Application 2020 & 2033
- Table 52: Global Naval Combat Weapons Market Revenue billion Forecast, by Production Analysis 2020 & 2033
- Table 53: Global Naval Combat Weapons Market Revenue billion Forecast, by Consumption Analysis 2020 & 2033
- Table 54: Global Naval Combat Weapons Market Revenue billion Forecast, by Import Market Analysis (Value & Volume) 2020 & 2033
- Table 55: Global Naval Combat Weapons Market Revenue billion Forecast, by Export Market Analysis (Value & Volume) 2020 & 2033
- Table 56: Global Naval Combat Weapons Market Revenue billion Forecast, by Price Trend Analysis 2020 & 2033
- Table 57: Global Naval Combat Weapons Market Revenue billion Forecast, by Country 2020 & 2033
- Table 58: China Naval Combat Weapons Market Revenue (billion) Forecast, by Application 2020 & 2033
- Table 59: India Naval Combat Weapons Market Revenue (billion) Forecast, by Application 2020 & 2033
- Table 60: Japan Naval Combat Weapons Market Revenue (billion) Forecast, by Application 2020 & 2033
- Table 61: South Korea Naval Combat Weapons Market Revenue (billion) Forecast, by Application 2020 & 2033
- Table 62: ASEAN Naval Combat Weapons Market Revenue (billion) Forecast, by Application 2020 & 2033
- Table 63: Oceania Naval Combat Weapons Market Revenue (billion) Forecast, by Application 2020 & 2033
- Table 64: Rest of Asia Pacific Naval Combat Weapons Market Revenue (billion) Forecast, by Application 2020 & 2033
Frequently Asked Questions
1. What is the projected Compound Annual Growth Rate (CAGR) of the Naval Combat Weapons Market?
The projected CAGR is approximately 7.52%.
2. Which companies are prominent players in the Naval Combat Weapons Market?
Key companies in the market include General Dynamics Corporation, Raytheon Corporation, Leonardo SpA, Kongsberg Gruppen, Lockheed Martin Corporation, Terma, QinetiQ Grou, Elbit Systems, Thales Corporation, L3 Harris Corporation, BAE Systems Plc, SAAB AB.
3. What are the main segments of the Naval Combat Weapons Market?
The market segments include Production Analysis, Consumption Analysis, Import Market Analysis (Value & Volume), Export Market Analysis (Value & Volume), Price Trend Analysis.
4. Can you provide details about the market size?
The market size is estimated to be USD 10.38 billion as of 2022.
5. What are some drivers contributing to market growth?
Increase in Internet of Things (IoT) and Autonomous Systems; Rise in Demand for Military and Defense Satellite Communication Solutions.
6. What are the notable trends driving market growth?
Submarines Segment Will Showcase Significant Growth During the Forecast Period.
7. Are there any restraints impacting market growth?
Cybersecurity Threats to Satellite Communication; Interference in Transmission of Data.
8. Can you provide examples of recent developments in the market?
N/A
9. What pricing options are available for accessing the report?
Pricing options include single-user, multi-user, and enterprise licenses priced at USD 4750, USD 5250, and USD 8750 respectively.
10. Is the market size provided in terms of value or volume?
The market size is provided in terms of value, measured in billion.
11. Are there any specific market keywords associated with the report?
Yes, the market keyword associated with the report is "Naval Combat Weapons Market," which aids in identifying and referencing the specific market segment covered.
12. How do I determine which pricing option suits my needs best?
The pricing options vary based on user requirements and access needs. Individual users may opt for single-user licenses, while businesses requiring broader access may choose multi-user or enterprise licenses for cost-effective access to the report.
13. Are there any additional resources or data provided in the Naval Combat Weapons Market report?
While the report offers comprehensive insights, it's advisable to review the specific contents or supplementary materials provided to ascertain if additional resources or data are available.
14. How can I stay updated on further developments or reports in the Naval Combat Weapons Market?
To stay informed about further developments, trends, and reports in the Naval Combat Weapons Market, consider subscribing to industry newsletters, following relevant companies and organizations, or regularly checking reputable industry news sources and publications.
Methodology
Step 1 - Identification of Relevant Samples Size from Population Database


Step 2 - Approaches for Defining Global Market Size (Value, Volume* & Price*)

Note*: In applicable scenarios
Step 3 - Data Sources
Primary Research
- Web Analytics
- Survey Reports
- Research Institute
- Latest Research Reports
- Opinion Leaders
Secondary Research
- Annual Reports
- White Paper
- Latest Press Release
- Industry Association
- Paid Database
- Investor Presentations

Step 4 - Data Triangulation
Involves using different sources of information in order to increase the validity of a study
These sources are likely to be stakeholders in a program - participants, other researchers, program staff, other community members, and so on.
Then we put all data in single framework & apply various statistical tools to find out the dynamic on the market.
During the analysis stage, feedback from the stakeholder groups would be compared to determine areas of agreement as well as areas of divergence