

Key Insights
The network emulator market is poised for substantial growth, driven by escalating demand for advanced network testing and simulation across critical sectors. The market is projected to achieve a CAGR of 7.4%, expanding from a base year of 2025 with an estimated market size of 252.4 million. This expansion is attributed to the increasing complexity of network architectures and the imperative for rigorous pre-deployment validation. Key growth catalysts include the widespread adoption of 5G, advancements in cloud and edge computing, and the proliferation of Software-Defined Networking (SDN) and Network Functions Virtualization (NFV). These technologies demand sophisticated emulators for performance, security, and scalability validation. The market is segmented by component (hardware and software) and end-user vertical (telecommunications, defense, and others). The telecommunications sector currently leads due to extensive testing requirements for 5G deployment and network optimization. While hardware dominates the current market share, the software segment is anticipated to grow faster due to its flexibility and cost-effectiveness. Potential constraints include high initial investment costs for advanced systems and the need for specialized expertise. However, continuous technological innovation and the growing demand for reliable network infrastructure are expected to mitigate these challenges. North America currently leads the market, followed by Europe and the Asia-Pacific region, which is projected to experience significant growth driven by rapid digital transformation and infrastructure investment.
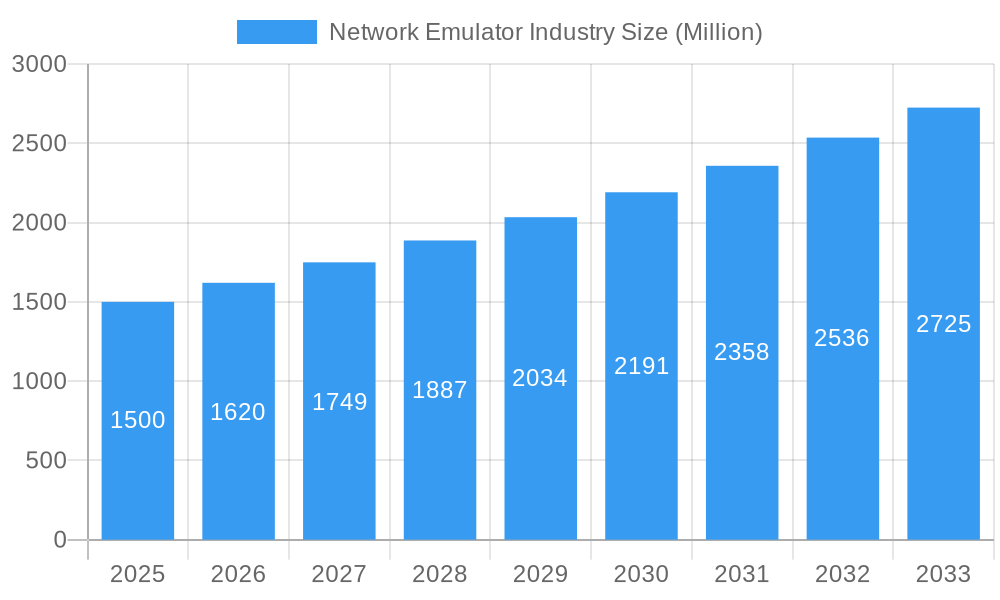
Network Emulator Industry Market Size (In Million)
The competitive landscape features a blend of established industry leaders and innovative new entrants. Key players such as Viavi Solutions, Keysight Technologies, and Spirent Communications are leveraging their extensive experience in test and measurement. Emerging companies are gaining traction by offering novel and cost-effective solutions. The market is expected to see increased consolidation and strategic alliances as companies aim to broaden their product offerings and market presence. The forecast period (2025-2033) indicates a sustained upward trajectory, with market expansion further propelled by the adoption of network automation, the growth of the Internet of Things (IoT), and the increasing reliance on network-centric applications. Enhancements in emulation capabilities, including the integration of AI and machine learning, will also be pivotal in driving market expansion.
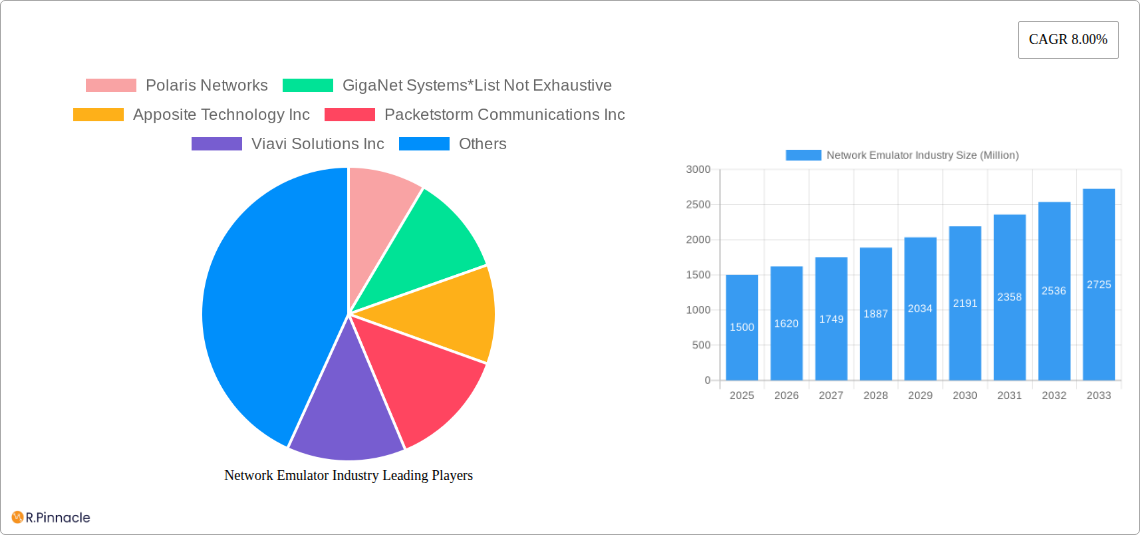
Network Emulator Industry Company Market Share
Network Emulator Industry Report: 2019-2033 Market Analysis & Forecast
This comprehensive report provides a detailed analysis of the Network Emulator industry, projecting a market value of $XX Million by 2033. The study period covers 2019-2033, with 2025 as the base and estimated year. This in-depth research offers actionable insights for industry professionals, investors, and strategic decision-makers.
Network Emulator Industry Market Structure & Innovation Trends
The Network Emulator market exhibits a moderately concentrated structure, with key players like Viavi Solutions Inc, Spirent Communications Inc, and Keysight Technologies Inc holding significant market share. However, the presence of numerous smaller players and startups fosters a dynamic competitive landscape. Market share fluctuations are primarily driven by technological advancements, strategic partnerships, and M&A activities. The total M&A deal value within the industry during the historical period (2019-2024) reached approximately $XX Million.
- Innovation Drivers: Advancements in 5G, network virtualization, and software-defined networking (SDN) are key innovation drivers.
- Regulatory Frameworks: Government regulations regarding network security and interoperability influence market dynamics.
- Product Substitutes: Virtualized network functions (VNFs) and cloud-based testing solutions pose some level of substitution.
- End-User Demographics: Telecommunication companies constitute the largest end-user segment, followed by the defense and other end-user verticals.
- M&A Activities: Strategic acquisitions are reshaping the industry's competitive landscape, driving consolidation and technological integration. The average deal size during 2019-2024 was approximately $XX Million.
Network Emulator Industry Market Dynamics & Trends
The Network Emulator market is experiencing robust growth, driven by the increasing demand for high-speed, reliable networks. The global market is projected to grow at a CAGR of XX% during the forecast period (2025-2033), reaching $XX Million by 2033. Market penetration remains relatively high in developed regions, while emerging markets present significant growth opportunities. Technological disruptions, such as the adoption of AI and machine learning in network testing, are reshaping the market. Consumer preferences are shifting towards more integrated, cloud-based solutions. Competitive dynamics are characterized by ongoing innovation, strategic alliances, and M&A activities.
Dominant Regions & Segments in Network Emulator Industry
The North American region currently holds the dominant position in the Network Emulator market, driven by robust technological advancements and high investments in telecommunication infrastructure. Within the segments:
Component: The Hardware segment is currently the larger segment, contributing XX% of the market revenue in 2025. However, the Software segment is experiencing faster growth due to the increasing popularity of software-defined networking (SDN).
End-user Vertical: The Telecommunication sector remains the dominant end-user vertical, accounting for over XX% of the total market revenue. The Defense sector is a significant contributor, driven by the need for secure and reliable network infrastructure. Other end-user verticals, such as education and healthcare, are showing promising growth potential.
Key Drivers (North America):
- Strong government support for technological advancements.
- Well-established telecommunication infrastructure.
- High adoption of 5G and other next-generation technologies.
Network Emulator Industry Product Innovations
Recent product innovations include cloud-based network emulators, AI-powered network testing tools, and solutions that support 5G and beyond network testing. These innovations offer enhanced scalability, efficiency, and precision. Key competitive advantages lie in superior performance, ease of use, and comprehensive support for various network technologies. The market is characterized by a continuous push towards more integrated and user-friendly solutions.
Report Scope & Segmentation Analysis
This report provides a detailed segmentation analysis of the Network Emulator market across various components (Hardware and Software) and end-user verticals (Telecommunication, Defense, and Other End-user Verticals). Each segment's market size, growth projections, and competitive dynamics are thoroughly analyzed. The Telecommunication sector is projected to maintain its dominant position with an anticipated CAGR of XX%, while the Software segment demonstrates higher growth potential within the components.
Key Drivers of Network Emulator Industry Growth
The growth of the Network Emulator industry is driven by several factors, including the increasing adoption of 5G and other advanced network technologies, the rising demand for high-speed and reliable network connectivity, the need for efficient network testing and optimization, and ongoing investments in network infrastructure by telecommunication providers and government entities.
Challenges in the Network Emulator Industry Sector
The Network Emulator industry faces challenges such as high initial investment costs for hardware, the complexity of integrating new technologies, and intense competition among established players. Supply chain disruptions can also impact market dynamics, resulting in potential delays and increased costs. Strict regulatory compliance requirements add complexity to operations.
Emerging Opportunities in Network Emulator Industry
Emerging opportunities include the integration of AI and machine learning in network emulators, the development of cloud-based solutions for enhanced scalability and flexibility, and the expansion into new markets like IoT and edge computing. The growing adoption of SDN and NFV is also creating lucrative opportunities for vendors.
Leading Players in the Network Emulator Industry Market
- Polaris Networks
- GigaNet Systems
- Apposite Technology Inc
- Packetstorm Communications Inc
- Viavi Solutions Inc
- Spirent Communications Inc
- Keysight Technologies Inc
- Aukua Systems Inc
- iTrinegy
- InterWorking Labs
Key Developments in Network Emulator Industry
- 2022 Q4: Viavi Solutions launched its next-generation network emulator.
- 2023 Q1: Spirent Communications announced a strategic partnership with a major cloud provider.
- 2023 Q3: Keysight Technologies acquired a smaller network emulator company. (Further details to be added based on available data)
Future Outlook for Network Emulator Industry Market
The Network Emulator market is poised for continued growth, driven by ongoing technological advancements, increasing demand for reliable network infrastructure, and the expansion into new applications. Strategic partnerships, innovative product development, and acquisitions will play a crucial role in shaping the industry's future. The market’s potential extends to emerging technologies like 6G and the growth of edge computing.
Network Emulator Industry Segmentation
-
1. Component
- 1.1. Hardware
- 1.2. Software
-
2. End-user Vertical
- 2.1. Telecommunication
- 2.2. Defense
- 2.3. Other End-user Verticals
Network Emulator Industry Segmentation By Geography
- 1. North America
- 2. Europe
- 3. Asia Pacific
- 4. Rest of the World
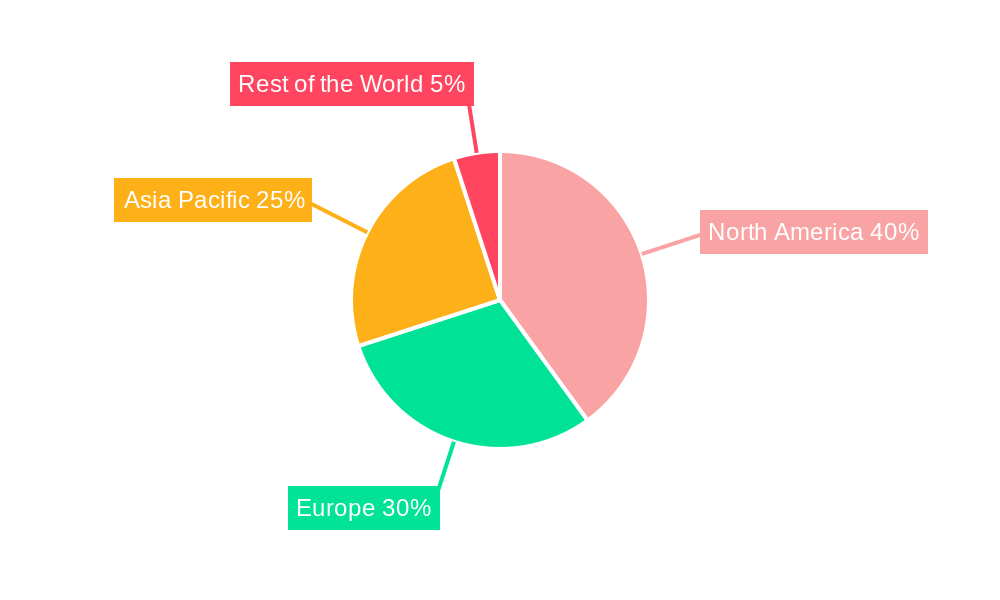
Network Emulator Industry Regional Market Share
Geographic Coverage of Network Emulator Industry
Network Emulator Industry REPORT HIGHLIGHTS
| Aspects | Details |
|---|---|
| Study Period | 2020-2034 |
| Base Year | 2025 |
| Estimated Year | 2026 |
| Forecast Period | 2026-2034 |
| Historical Period | 2020-2025 |
| Growth Rate | CAGR of 7.4% from 2020-2034 |
| Segmentation |
|
Table of Contents
- 1. Introduction
- 1.1. Research Scope
- 1.2. Market Segmentation
- 1.3. Research Objective
- 1.4. Definitions and Assumptions
- 2. Executive Summary
- 2.1. Market Snapshot
- 3. Market Dynamics
- 3.1. Market Drivers
- 3.2. Market Restrains
- 3.3. Market Trends
- 3.4. Market Opportunities
- 4. Market Factor Analysis
- 4.1. Porters Five Forces
- 4.1.1. Bargaining Power of Suppliers
- 4.1.2. Bargaining Power of Buyers
- 4.1.3. Threat of New Entrants
- 4.1.4. Threat of Substitutes
- 4.1.5. Competitive Rivalry
- 4.2. PESTEL analysis
- 4.3. BCG Analysis
- 4.3.1. Stars (High Growth, High Market Share)
- 4.3.2. Cash Cows (Low Growth, High Market Share)
- 4.3.3. Question Mark (High Growth, Low Market Share)
- 4.3.4. Dogs (Low Growth, Low Market Share)
- 4.4. Ansoff Matrix Analysis
- 4.5. Supply Chain Analysis
- 4.6. Regulatory Landscape
- 4.7. Current Market Potential and Opportunity Assessment (TAM–SAM–SOM Framework)
- 4.8. PRI Analyst Note
- 4.1. Porters Five Forces
- 5. Market Analysis, Insights and Forecast 2021-2033
- 5.1. Market Analysis, Insights and Forecast - by Component
- 5.1.1. Hardware
- 5.1.2. Software
- 5.2. Market Analysis, Insights and Forecast - by End-user Vertical
- 5.2.1. Telecommunication
- 5.2.2. Defense
- 5.2.3. Other End-user Verticals
- 5.3. Market Analysis, Insights and Forecast - by Region
- 5.3.1. North America
- 5.3.2. Europe
- 5.3.3. Asia Pacific
- 5.3.4. Rest of the World
- 5.1. Market Analysis, Insights and Forecast - by Component
- 6. Global Network Emulator Industry Analysis, Insights and Forecast, 2021-2033
- 6.1. Market Analysis, Insights and Forecast - by Component
- 6.1.1. Hardware
- 6.1.2. Software
- 6.2. Market Analysis, Insights and Forecast - by End-user Vertical
- 6.2.1. Telecommunication
- 6.2.2. Defense
- 6.2.3. Other End-user Verticals
- 6.1. Market Analysis, Insights and Forecast - by Component
- 7. North America Network Emulator Industry Analysis, Insights and Forecast, 2020-2032
- 7.1. Market Analysis, Insights and Forecast - by Component
- 7.1.1. Hardware
- 7.1.2. Software
- 7.2. Market Analysis, Insights and Forecast - by End-user Vertical
- 7.2.1. Telecommunication
- 7.2.2. Defense
- 7.2.3. Other End-user Verticals
- 7.1. Market Analysis, Insights and Forecast - by Component
- 8. Europe Network Emulator Industry Analysis, Insights and Forecast, 2020-2032
- 8.1. Market Analysis, Insights and Forecast - by Component
- 8.1.1. Hardware
- 8.1.2. Software
- 8.2. Market Analysis, Insights and Forecast - by End-user Vertical
- 8.2.1. Telecommunication
- 8.2.2. Defense
- 8.2.3. Other End-user Verticals
- 8.1. Market Analysis, Insights and Forecast - by Component
- 9. Asia Pacific Network Emulator Industry Analysis, Insights and Forecast, 2020-2032
- 9.1. Market Analysis, Insights and Forecast - by Component
- 9.1.1. Hardware
- 9.1.2. Software
- 9.2. Market Analysis, Insights and Forecast - by End-user Vertical
- 9.2.1. Telecommunication
- 9.2.2. Defense
- 9.2.3. Other End-user Verticals
- 9.1. Market Analysis, Insights and Forecast - by Component
- 10. Rest of the World Network Emulator Industry Analysis, Insights and Forecast, 2020-2032
- 10.1. Market Analysis, Insights and Forecast - by Component
- 10.1.1. Hardware
- 10.1.2. Software
- 10.2. Market Analysis, Insights and Forecast - by End-user Vertical
- 10.2.1. Telecommunication
- 10.2.2. Defense
- 10.2.3. Other End-user Verticals
- 10.1. Market Analysis, Insights and Forecast - by Component
- 11. Competitive Analysis
- 11.1. Company Profiles
- 11.1.1 Polaris Networks
- 11.1.1.1. Company Overview
- 11.1.1.2. Products
- 11.1.1.3. Company Financials
- 11.1.1.4. SWOT Analysis
- 11.1.2 GigaNet Systems*List Not Exhaustive
- 11.1.2.1. Company Overview
- 11.1.2.2. Products
- 11.1.2.3. Company Financials
- 11.1.2.4. SWOT Analysis
- 11.1.3 Apposite Technology Inc
- 11.1.3.1. Company Overview
- 11.1.3.2. Products
- 11.1.3.3. Company Financials
- 11.1.3.4. SWOT Analysis
- 11.1.4 Packetstorm Communications Inc
- 11.1.4.1. Company Overview
- 11.1.4.2. Products
- 11.1.4.3. Company Financials
- 11.1.4.4. SWOT Analysis
- 11.1.5 Viavi Solutions Inc
- 11.1.5.1. Company Overview
- 11.1.5.2. Products
- 11.1.5.3. Company Financials
- 11.1.5.4. SWOT Analysis
- 11.1.6 Spirent Communications Inc
- 11.1.6.1. Company Overview
- 11.1.6.2. Products
- 11.1.6.3. Company Financials
- 11.1.6.4. SWOT Analysis
- 11.1.7 Keysight Technologies Inc
- 11.1.7.1. Company Overview
- 11.1.7.2. Products
- 11.1.7.3. Company Financials
- 11.1.7.4. SWOT Analysis
- 11.1.8 Aukua Systems Inc
- 11.1.8.1. Company Overview
- 11.1.8.2. Products
- 11.1.8.3. Company Financials
- 11.1.8.4. SWOT Analysis
- 11.1.9 iTrinegy
- 11.1.9.1. Company Overview
- 11.1.9.2. Products
- 11.1.9.3. Company Financials
- 11.1.9.4. SWOT Analysis
- 11.1.10 InterWorking Labs
- 11.1.10.1. Company Overview
- 11.1.10.2. Products
- 11.1.10.3. Company Financials
- 11.1.10.4. SWOT Analysis
- 11.1.1 Polaris Networks
- 11.2. Market Entropy
- 11.2.1 Company's Key Areas Served
- 11.2.2 Recent Developments
- 11.3. Company Market Share Analysis 2025
- 11.3.1 Top 5 Companies Market Share Analysis
- 11.3.2 Top 3 Companies Market Share Analysis
- 11.4. List of Potential Customers
- 12. Research Methodology
List of Figures
- Figure 1: Global Network Emulator Industry Revenue Breakdown (million, %) by Region 2025 & 2033
- Figure 2: North America Network Emulator Industry Revenue (million), by Component 2025 & 2033
- Figure 3: North America Network Emulator Industry Revenue Share (%), by Component 2025 & 2033
- Figure 4: North America Network Emulator Industry Revenue (million), by End-user Vertical 2025 & 2033
- Figure 5: North America Network Emulator Industry Revenue Share (%), by End-user Vertical 2025 & 2033
- Figure 6: North America Network Emulator Industry Revenue (million), by Country 2025 & 2033
- Figure 7: North America Network Emulator Industry Revenue Share (%), by Country 2025 & 2033
- Figure 8: Europe Network Emulator Industry Revenue (million), by Component 2025 & 2033
- Figure 9: Europe Network Emulator Industry Revenue Share (%), by Component 2025 & 2033
- Figure 10: Europe Network Emulator Industry Revenue (million), by End-user Vertical 2025 & 2033
- Figure 11: Europe Network Emulator Industry Revenue Share (%), by End-user Vertical 2025 & 2033
- Figure 12: Europe Network Emulator Industry Revenue (million), by Country 2025 & 2033
- Figure 13: Europe Network Emulator Industry Revenue Share (%), by Country 2025 & 2033
- Figure 14: Asia Pacific Network Emulator Industry Revenue (million), by Component 2025 & 2033
- Figure 15: Asia Pacific Network Emulator Industry Revenue Share (%), by Component 2025 & 2033
- Figure 16: Asia Pacific Network Emulator Industry Revenue (million), by End-user Vertical 2025 & 2033
- Figure 17: Asia Pacific Network Emulator Industry Revenue Share (%), by End-user Vertical 2025 & 2033
- Figure 18: Asia Pacific Network Emulator Industry Revenue (million), by Country 2025 & 2033
- Figure 19: Asia Pacific Network Emulator Industry Revenue Share (%), by Country 2025 & 2033
- Figure 20: Rest of the World Network Emulator Industry Revenue (million), by Component 2025 & 2033
- Figure 21: Rest of the World Network Emulator Industry Revenue Share (%), by Component 2025 & 2033
- Figure 22: Rest of the World Network Emulator Industry Revenue (million), by End-user Vertical 2025 & 2033
- Figure 23: Rest of the World Network Emulator Industry Revenue Share (%), by End-user Vertical 2025 & 2033
- Figure 24: Rest of the World Network Emulator Industry Revenue (million), by Country 2025 & 2033
- Figure 25: Rest of the World Network Emulator Industry Revenue Share (%), by Country 2025 & 2033
List of Tables
- Table 1: Global Network Emulator Industry Revenue million Forecast, by Component 2020 & 2033
- Table 2: Global Network Emulator Industry Revenue million Forecast, by End-user Vertical 2020 & 2033
- Table 3: Global Network Emulator Industry Revenue million Forecast, by Region 2020 & 2033
- Table 4: Global Network Emulator Industry Revenue million Forecast, by Component 2020 & 2033
- Table 5: Global Network Emulator Industry Revenue million Forecast, by End-user Vertical 2020 & 2033
- Table 6: Global Network Emulator Industry Revenue million Forecast, by Country 2020 & 2033
- Table 7: Global Network Emulator Industry Revenue million Forecast, by Component 2020 & 2033
- Table 8: Global Network Emulator Industry Revenue million Forecast, by End-user Vertical 2020 & 2033
- Table 9: Global Network Emulator Industry Revenue million Forecast, by Country 2020 & 2033
- Table 10: Global Network Emulator Industry Revenue million Forecast, by Component 2020 & 2033
- Table 11: Global Network Emulator Industry Revenue million Forecast, by End-user Vertical 2020 & 2033
- Table 12: Global Network Emulator Industry Revenue million Forecast, by Country 2020 & 2033
- Table 13: Global Network Emulator Industry Revenue million Forecast, by Component 2020 & 2033
- Table 14: Global Network Emulator Industry Revenue million Forecast, by End-user Vertical 2020 & 2033
- Table 15: Global Network Emulator Industry Revenue million Forecast, by Country 2020 & 2033
Frequently Asked Questions
1. What is the projected Compound Annual Growth Rate (CAGR) of the Network Emulator Industry?
The projected CAGR is approximately 7.4%.
2. Which companies are prominent players in the Network Emulator Industry?
Key companies in the market include Polaris Networks, GigaNet Systems*List Not Exhaustive, Apposite Technology Inc, Packetstorm Communications Inc, Viavi Solutions Inc, Spirent Communications Inc, Keysight Technologies Inc, Aukua Systems Inc, iTrinegy, InterWorking Labs.
3. What are the main segments of the Network Emulator Industry?
The market segments include Component, End-user Vertical.
4. Can you provide details about the market size?
The market size is estimated to be USD 252.4 million as of 2022.
5. What are some drivers contributing to market growth?
; Advancements and Growth in 5G Testing.
6. What are the notable trends driving market growth?
Telecommunication Vertical is Expected to Show a Significant Growth Over the Forecast period.
7. Are there any restraints impacting market growth?
; RF Design. Flexibility and Size Issues of the Equipment; Evolving RF Standards.
8. Can you provide examples of recent developments in the market?
N/A
9. What pricing options are available for accessing the report?
Pricing options include single-user, multi-user, and enterprise licenses priced at USD 4750, USD 5250, and USD 8750 respectively.
10. Is the market size provided in terms of value or volume?
The market size is provided in terms of value, measured in million.
11. Are there any specific market keywords associated with the report?
Yes, the market keyword associated with the report is "Network Emulator Industry," which aids in identifying and referencing the specific market segment covered.
12. How do I determine which pricing option suits my needs best?
The pricing options vary based on user requirements and access needs. Individual users may opt for single-user licenses, while businesses requiring broader access may choose multi-user or enterprise licenses for cost-effective access to the report.
13. Are there any additional resources or data provided in the Network Emulator Industry report?
While the report offers comprehensive insights, it's advisable to review the specific contents or supplementary materials provided to ascertain if additional resources or data are available.
14. How can I stay updated on further developments or reports in the Network Emulator Industry?
To stay informed about further developments, trends, and reports in the Network Emulator Industry, consider subscribing to industry newsletters, following relevant companies and organizations, or regularly checking reputable industry news sources and publications.
Methodology
Step 1 - Identification of Relevant Samples Size from Population Database


Step 2 - Approaches for Defining Global Market Size (Value, Volume* & Price*)

Note*: In applicable scenarios
Step 3 - Data Sources
Primary Research
- Web Analytics
- Survey Reports
- Research Institute
- Latest Research Reports
- Opinion Leaders
Secondary Research
- Annual Reports
- White Paper
- Latest Press Release
- Industry Association
- Paid Database
- Investor Presentations

Step 4 - Data Triangulation
Involves using different sources of information in order to increase the validity of a study
These sources are likely to be stakeholders in a program - participants, other researchers, program staff, other community members, and so on.
Then we put all data in single framework & apply various statistical tools to find out the dynamic on the market.
During the analysis stage, feedback from the stakeholder groups would be compared to determine areas of agreement as well as areas of divergence