
Key Insights
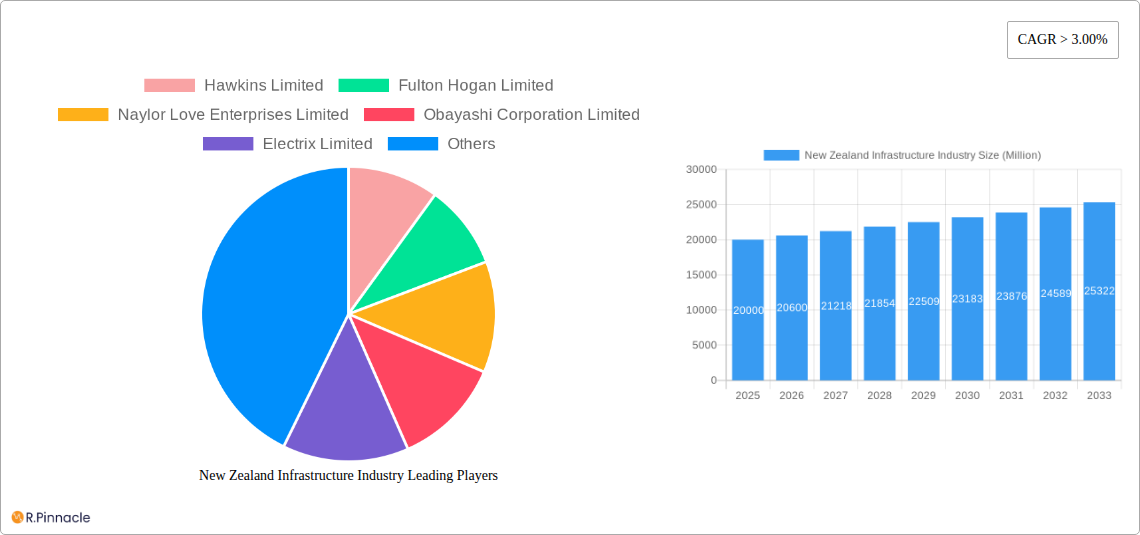
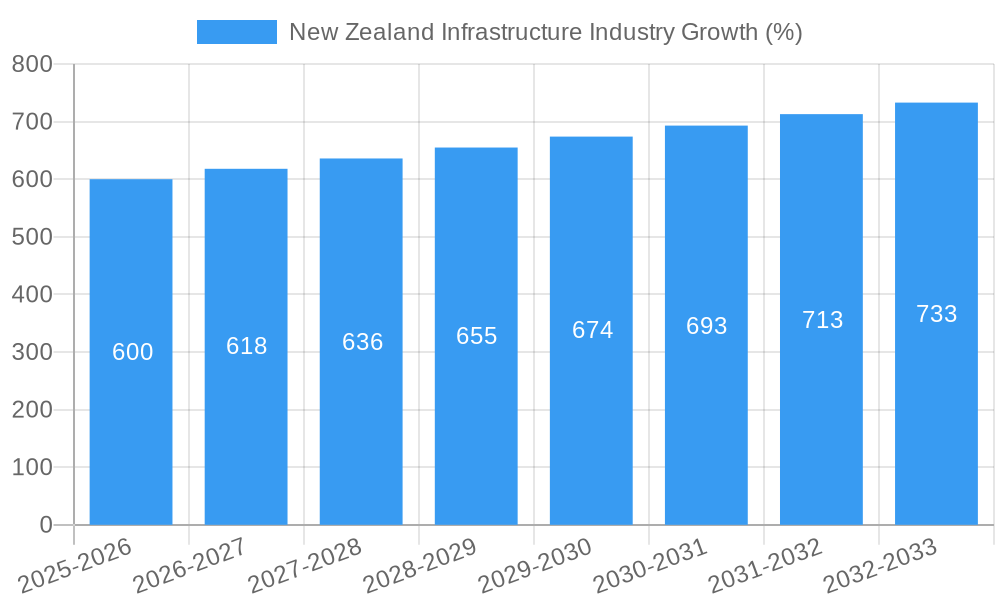
The New Zealand infrastructure industry, valued at approximately $20 billion NZD in 2025, is experiencing robust growth, projected to maintain a Compound Annual Growth Rate (CAGR) exceeding 3% through 2033. This expansion is fueled by several key drivers. Significant government investment in social infrastructure projects, including transportation upgrades (roads, railways, and potentially light rail in larger cities), crucial water management infrastructure improvements, and expansion of telecommunications networks, are primary contributors. Furthermore, a burgeoning population and increasing urbanization are placing pressure on existing infrastructure, necessitating further investment and modernization. Growth in key cities like Auckland, Wellington, and Hamilton is particularly strong, driving demand for construction and related services. While rising material costs and skilled labor shortages represent potential restraints, innovative construction techniques and ongoing government initiatives aimed at addressing these challenges are mitigating their impact. The industry is segmented by infrastructure type (social infrastructure encompassing transportation, waterways, and telecommunications; and other social infrastructures) and by key cities, providing a granular view of market dynamics. Major players like Hawkins Limited, Fulton Hogan Limited, and Downer Group are actively involved, shaping the competitive landscape.
The forecast period (2025-2033) presents significant opportunities for both established players and new entrants. Further expansion is anticipated in areas such as sustainable infrastructure development, driven by increasing environmental concerns and government policies promoting green initiatives. The industry's success hinges on effective project management, adherence to strict building codes and regulations, and successful navigation of the ongoing challenges in labor supply and material pricing. The projected growth signifies a significant potential for investment and expansion within the New Zealand infrastructure sector, positioning it as an attractive market for both domestic and international players.
New Zealand Infrastructure Industry Report: 2019-2033 Forecast
This comprehensive report provides an in-depth analysis of the New Zealand infrastructure industry, offering invaluable insights for industry professionals, investors, and strategic planners. Covering the period from 2019 to 2033, with a base year of 2025 and a forecast period of 2025-2033, this report leverages extensive data analysis to deliver actionable intelligence on market dynamics, key players, and future growth prospects.
New Zealand Infrastructure Industry Market Structure & Innovation Trends
This section analyzes the competitive landscape of the New Zealand infrastructure industry, examining market concentration, innovation drivers, regulatory frameworks, and M&A activities. The report delves into the market share of key players such as Hawkins Limited, Fulton Hogan Limited, and Naylor Love Enterprises Limited, among others. The analysis includes an assessment of the impact of regulatory frameworks on innovation and competition, as well as an evaluation of the influence of product substitutes and end-user demographics. Furthermore, the report quantifies M&A activity within the sector, providing insights into deal values and their implications for market consolidation. The estimated market size in 2025 is NZD xx Million. Market concentration is assessed using the Herfindahl-Hirschman Index (HHI), revealing the level of competition. The report also identifies key innovation drivers, including government initiatives and technological advancements, and their effects on market growth.
New Zealand Infrastructure Industry Market Dynamics & Trends
This section explores the key drivers and trends shaping the New Zealand infrastructure industry's growth trajectory. The report analyzes the compound annual growth rate (CAGR) for the forecast period (2025-2033), factoring in factors such as government spending on infrastructure projects, technological disruptions, evolving consumer preferences, and the competitive landscape. The analysis includes a detailed examination of market penetration rates across different infrastructure segments. The report also assesses the impact of technological advancements, such as the adoption of Building Information Modeling (BIM) and digital twins, on market dynamics. The influence of demographic shifts and evolving consumer demands on infrastructure development is also examined. Competitive dynamics, including pricing strategies and market positioning of key players, are scrutinized, with a special focus on market share fluctuations and strategic alliances. The estimated market value in 2033 is projected to reach NZD xx Million.
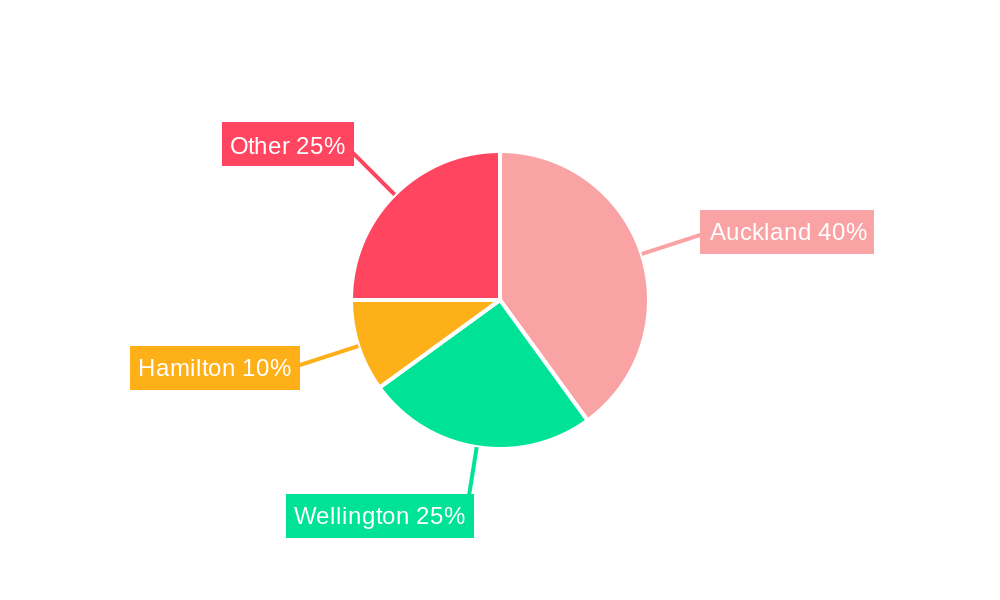
Dominant Regions & Segments in New Zealand Infrastructure Industry
This section identifies the dominant regions and segments within the New Zealand infrastructure industry. The analysis focuses on key cities (Auckland, Wellington, Hamilton) and infrastructure segments (Social Infrastructure, Transportation Infrastructure, Waterways: Extraction Infrastructure, Telecoms: Manufacturing Infrastructure).
Key Cities:
- Auckland: Dominance driven by high population density, significant infrastructure development projects, and economic activity.
- Wellington: Strong government presence and associated infrastructure needs contribute to its significance.
- Hamilton: Growth driven by regional development initiatives and industrial activity.
Infrastructure Segments:
- Transportation Infrastructure: High growth due to increasing urbanization and the need for efficient transportation networks.
- Social Infrastructure: Significant government investment fuels growth in this sector, encompassing healthcare, education, and community facilities.
- Waterways: Extraction Infrastructure: Driven by increasing demand for water resources and related infrastructure upgrades.
- Telecoms: Manufacturing Infrastructure: Growth fueled by advancements in telecommunication technology and increasing digitalization.
The report provides a detailed analysis of the factors contributing to the dominance of each region and segment, including economic policies, infrastructure investment, and regulatory frameworks.
New Zealand Infrastructure Industry Product Innovations
This section summarizes recent product developments, highlighting applications and competitive advantages. The focus is on technological trends and the extent to which these innovations address market needs. Examples of innovative products and technologies, along with their impact on the industry, are presented.
Report Scope & Segmentation Analysis
This report segments the New Zealand infrastructure industry by infrastructure type (Social Infrastructure, Transportation Infrastructure, Waterways: Extraction Infrastructure, Telecoms: Manufacturing Infrastructure) and key cities (Wellington, Auckland, Hamilton). Each segment’s growth projections, market size estimates for 2025 and 2033, and competitive dynamics are analyzed.
Key Drivers of New Zealand Infrastructure Industry Growth
Key drivers of growth include increasing government investment in infrastructure projects, urbanization, technological advancements (e.g., digitalization of infrastructure management), and robust economic growth. Specific examples of government initiatives and their impacts are highlighted.
Challenges in the New Zealand Infrastructure Industry Sector
Challenges include securing skilled labor, managing supply chain disruptions (potentially leading to delays and cost overruns), navigating complex regulatory environments, and intense competition amongst contractors. The report quantifies the potential impact of these challenges on project timelines and costs.
Emerging Opportunities in New Zealand Infrastructure Industry
Emerging opportunities lie in the adoption of sustainable infrastructure solutions, the growing demand for smart city technologies, and the potential for public-private partnerships to finance large-scale infrastructure projects. The report identifies specific areas with high growth potential.
Leading Players in the New Zealand Infrastructure Industry Market
- Hawkins Limited
- Fulton Hogan Limited
- Naylor Love Enterprises Limited
- Obayashi Corporation Limited
- Electrix Limited
- Visionstream Pty Limited
- Cpb Contractors Pty Limited
- City Care Limited
- Kiwi Property Group Limited
- Downer Group
Key Developments in New Zealand Infrastructure Industry Industry
- 2022 Q4: Government announces NZD xx Million investment in national broadband infrastructure.
- 2023 Q1: Major merger between two leading construction companies.
- 2023 Q2: Launch of a new sustainable infrastructure initiative by a leading contractor.
- (Further key developments will be detailed in the full report)
Future Outlook for New Zealand Infrastructure Industry Market
The New Zealand infrastructure industry is poised for significant growth over the forecast period, driven by sustained government investment, technological advancements, and increasing urbanization. Strategic opportunities exist for companies that can adapt to changing market dynamics and embrace innovative solutions. The report concludes with a projection of the market's overall potential and identifies key strategic opportunities for businesses operating within the sector.
New Zealand Infrastructure Industry Segmentation
-
1. Infrastructure segment
-
1.1. Social Infrastructure
- 1.1.1. Schools
- 1.1.2. Hospitals
- 1.1.3. Defence
- 1.1.4. Other Social Infrastructures
-
1.2. Transportation Infrastructure
- 1.2.1. Railways
- 1.2.2. Roadways
- 1.2.3. Airports
- 1.2.4. Waterways
-
1.3. Extraction Infrastructure
- 1.3.1. Power Generation
- 1.3.2. Electricity Transmission and Distribution
- 1.3.3. Gas
- 1.3.4. Telecoms
-
1.4. Manufacturing Infrastructure
- 1.4.1. Metal and Ore Production
- 1.4.2. Petroleum Refining
- 1.4.3. Chemical Manufacturing
- 1.4.4. Industrial Parks and Clusters
- 1.4.5. Other Manufacturing Infrastructures
-
1.1. Social Infrastructure
-
2. Key Cities
- 2.1. Wellington
- 2.2. Auckland
- 2.3. Hamilton
New Zealand Infrastructure Industry Segmentation By Geography
- 1. New Zealand
New Zealand Infrastructure Industry REPORT HIGHLIGHTS
| Aspects | Details |
|---|---|
| Study Period | 2019-2033 |
| Base Year | 2024 |
| Estimated Year | 2025 |
| Forecast Period | 2025-2033 |
| Historical Period | 2019-2024 |
| Growth Rate | CAGR of > 3.00% from 2019-2033 |
| Segmentation |
|
Table of Contents
- 1. Introduction
- 1.1. Research Scope
- 1.2. Market Segmentation
- 1.3. Research Methodology
- 1.4. Definitions and Assumptions
- 2. Executive Summary
- 2.1. Introduction
- 3. Market Dynamics
- 3.1. Introduction
- 3.2. Market Drivers
- 3.2.1. Growth of Education Sector; Rising Demand for Quality Accomodation
- 3.3. Market Restrains
- 3.3.1. Enrolment Fluctuations
- 3.4. Market Trends
- 3.4.1. Increasing Demand for Transport Infrastructure Driving the Market
- 4. Market Factor Analysis
- 4.1. Porters Five Forces
- 4.2. Supply/Value Chain
- 4.3. PESTEL analysis
- 4.4. Market Entropy
- 4.5. Patent/Trademark Analysis
- 5. New Zealand Infrastructure Industry Analysis, Insights and Forecast, 2019-2031
- 5.1. Market Analysis, Insights and Forecast - by Infrastructure segment
- 5.1.1. Social Infrastructure
- 5.1.1.1. Schools
- 5.1.1.2. Hospitals
- 5.1.1.3. Defence
- 5.1.1.4. Other Social Infrastructures
- 5.1.2. Transportation Infrastructure
- 5.1.2.1. Railways
- 5.1.2.2. Roadways
- 5.1.2.3. Airports
- 5.1.2.4. Waterways
- 5.1.3. Extraction Infrastructure
- 5.1.3.1. Power Generation
- 5.1.3.2. Electricity Transmission and Distribution
- 5.1.3.3. Gas
- 5.1.3.4. Telecoms
- 5.1.4. Manufacturing Infrastructure
- 5.1.4.1. Metal and Ore Production
- 5.1.4.2. Petroleum Refining
- 5.1.4.3. Chemical Manufacturing
- 5.1.4.4. Industrial Parks and Clusters
- 5.1.4.5. Other Manufacturing Infrastructures
- 5.1.1. Social Infrastructure
- 5.2. Market Analysis, Insights and Forecast - by Key Cities
- 5.2.1. Wellington
- 5.2.2. Auckland
- 5.2.3. Hamilton
- 5.3. Market Analysis, Insights and Forecast - by Region
- 5.3.1. New Zealand
- 5.1. Market Analysis, Insights and Forecast - by Infrastructure segment
- 6. Competitive Analysis
- 6.1. Market Share Analysis 2024
- 6.2. Company Profiles
- 6.2.1 Hawkins Limited
- 6.2.1.1. Overview
- 6.2.1.2. Products
- 6.2.1.3. SWOT Analysis
- 6.2.1.4. Recent Developments
- 6.2.1.5. Financials (Based on Availability)
- 6.2.2 Fulton Hogan Limited
- 6.2.2.1. Overview
- 6.2.2.2. Products
- 6.2.2.3. SWOT Analysis
- 6.2.2.4. Recent Developments
- 6.2.2.5. Financials (Based on Availability)
- 6.2.3 Naylor Love Enterprises Limited
- 6.2.3.1. Overview
- 6.2.3.2. Products
- 6.2.3.3. SWOT Analysis
- 6.2.3.4. Recent Developments
- 6.2.3.5. Financials (Based on Availability)
- 6.2.4 Obayashi Corporation Limited
- 6.2.4.1. Overview
- 6.2.4.2. Products
- 6.2.4.3. SWOT Analysis
- 6.2.4.4. Recent Developments
- 6.2.4.5. Financials (Based on Availability)
- 6.2.5 Electrix Limited
- 6.2.5.1. Overview
- 6.2.5.2. Products
- 6.2.5.3. SWOT Analysis
- 6.2.5.4. Recent Developments
- 6.2.5.5. Financials (Based on Availability)
- 6.2.6 Visionstream Pty Limited*List Not Exhaustive
- 6.2.6.1. Overview
- 6.2.6.2. Products
- 6.2.6.3. SWOT Analysis
- 6.2.6.4. Recent Developments
- 6.2.6.5. Financials (Based on Availability)
- 6.2.7 Cpb Contractors Pty Limited
- 6.2.7.1. Overview
- 6.2.7.2. Products
- 6.2.7.3. SWOT Analysis
- 6.2.7.4. Recent Developments
- 6.2.7.5. Financials (Based on Availability)
- 6.2.8 City Care Limited
- 6.2.8.1. Overview
- 6.2.8.2. Products
- 6.2.8.3. SWOT Analysis
- 6.2.8.4. Recent Developments
- 6.2.8.5. Financials (Based on Availability)
- 6.2.9 Kiwi Property Group Limited
- 6.2.9.1. Overview
- 6.2.9.2. Products
- 6.2.9.3. SWOT Analysis
- 6.2.9.4. Recent Developments
- 6.2.9.5. Financials (Based on Availability)
- 6.2.10 Downer Group
- 6.2.10.1. Overview
- 6.2.10.2. Products
- 6.2.10.3. SWOT Analysis
- 6.2.10.4. Recent Developments
- 6.2.10.5. Financials (Based on Availability)
- 6.2.1 Hawkins Limited
List of Figures
- Figure 1: New Zealand Infrastructure Industry Revenue Breakdown (Million, %) by Product 2024 & 2032
- Figure 2: New Zealand Infrastructure Industry Share (%) by Company 2024
List of Tables
- Table 1: New Zealand Infrastructure Industry Revenue Million Forecast, by Region 2019 & 2032
- Table 2: New Zealand Infrastructure Industry Revenue Million Forecast, by Infrastructure segment 2019 & 2032
- Table 3: New Zealand Infrastructure Industry Revenue Million Forecast, by Key Cities 2019 & 2032
- Table 4: New Zealand Infrastructure Industry Revenue Million Forecast, by Region 2019 & 2032
- Table 5: New Zealand Infrastructure Industry Revenue Million Forecast, by Country 2019 & 2032
- Table 6: New Zealand Infrastructure Industry Revenue Million Forecast, by Infrastructure segment 2019 & 2032
- Table 7: New Zealand Infrastructure Industry Revenue Million Forecast, by Key Cities 2019 & 2032
- Table 8: New Zealand Infrastructure Industry Revenue Million Forecast, by Country 2019 & 2032
Frequently Asked Questions
1. What is the projected Compound Annual Growth Rate (CAGR) of the New Zealand Infrastructure Industry?
The projected CAGR is approximately > 3.00%.
2. Which companies are prominent players in the New Zealand Infrastructure Industry?
Key companies in the market include Hawkins Limited, Fulton Hogan Limited, Naylor Love Enterprises Limited, Obayashi Corporation Limited, Electrix Limited, Visionstream Pty Limited*List Not Exhaustive, Cpb Contractors Pty Limited, City Care Limited, Kiwi Property Group Limited, Downer Group.
3. What are the main segments of the New Zealand Infrastructure Industry?
The market segments include Infrastructure segment, Key Cities.
4. Can you provide details about the market size?
The market size is estimated to be USD XX Million as of 2022.
5. What are some drivers contributing to market growth?
Growth of Education Sector; Rising Demand for Quality Accomodation.
6. What are the notable trends driving market growth?
Increasing Demand for Transport Infrastructure Driving the Market.
7. Are there any restraints impacting market growth?
Enrolment Fluctuations.
8. Can you provide examples of recent developments in the market?
N/A
9. What pricing options are available for accessing the report?
Pricing options include single-user, multi-user, and enterprise licenses priced at USD 3800, USD 4500, and USD 5800 respectively.
10. Is the market size provided in terms of value or volume?
The market size is provided in terms of value, measured in Million.
11. Are there any specific market keywords associated with the report?
Yes, the market keyword associated with the report is "New Zealand Infrastructure Industry," which aids in identifying and referencing the specific market segment covered.
12. How do I determine which pricing option suits my needs best?
The pricing options vary based on user requirements and access needs. Individual users may opt for single-user licenses, while businesses requiring broader access may choose multi-user or enterprise licenses for cost-effective access to the report.
13. Are there any additional resources or data provided in the New Zealand Infrastructure Industry report?
While the report offers comprehensive insights, it's advisable to review the specific contents or supplementary materials provided to ascertain if additional resources or data are available.
14. How can I stay updated on further developments or reports in the New Zealand Infrastructure Industry?
To stay informed about further developments, trends, and reports in the New Zealand Infrastructure Industry, consider subscribing to industry newsletters, following relevant companies and organizations, or regularly checking reputable industry news sources and publications.
Methodology
Step 1 - Identification of Relevant Samples Size from Population Database


Step 2 - Approaches for Defining Global Market Size (Value, Volume* & Price*)

Note*: In applicable scenarios
Step 3 - Data Sources
Primary Research
- Web Analytics
- Survey Reports
- Research Institute
- Latest Research Reports
- Opinion Leaders
Secondary Research
- Annual Reports
- White Paper
- Latest Press Release
- Industry Association
- Paid Database
- Investor Presentations

Step 4 - Data Triangulation
Involves using different sources of information in order to increase the validity of a study
These sources are likely to be stakeholders in a program - participants, other researchers, program staff, other community members, and so on.
Then we put all data in single framework & apply various statistical tools to find out the dynamic on the market.
During the analysis stage, feedback from the stakeholder groups would be compared to determine areas of agreement as well as areas of divergence


