Key Insights
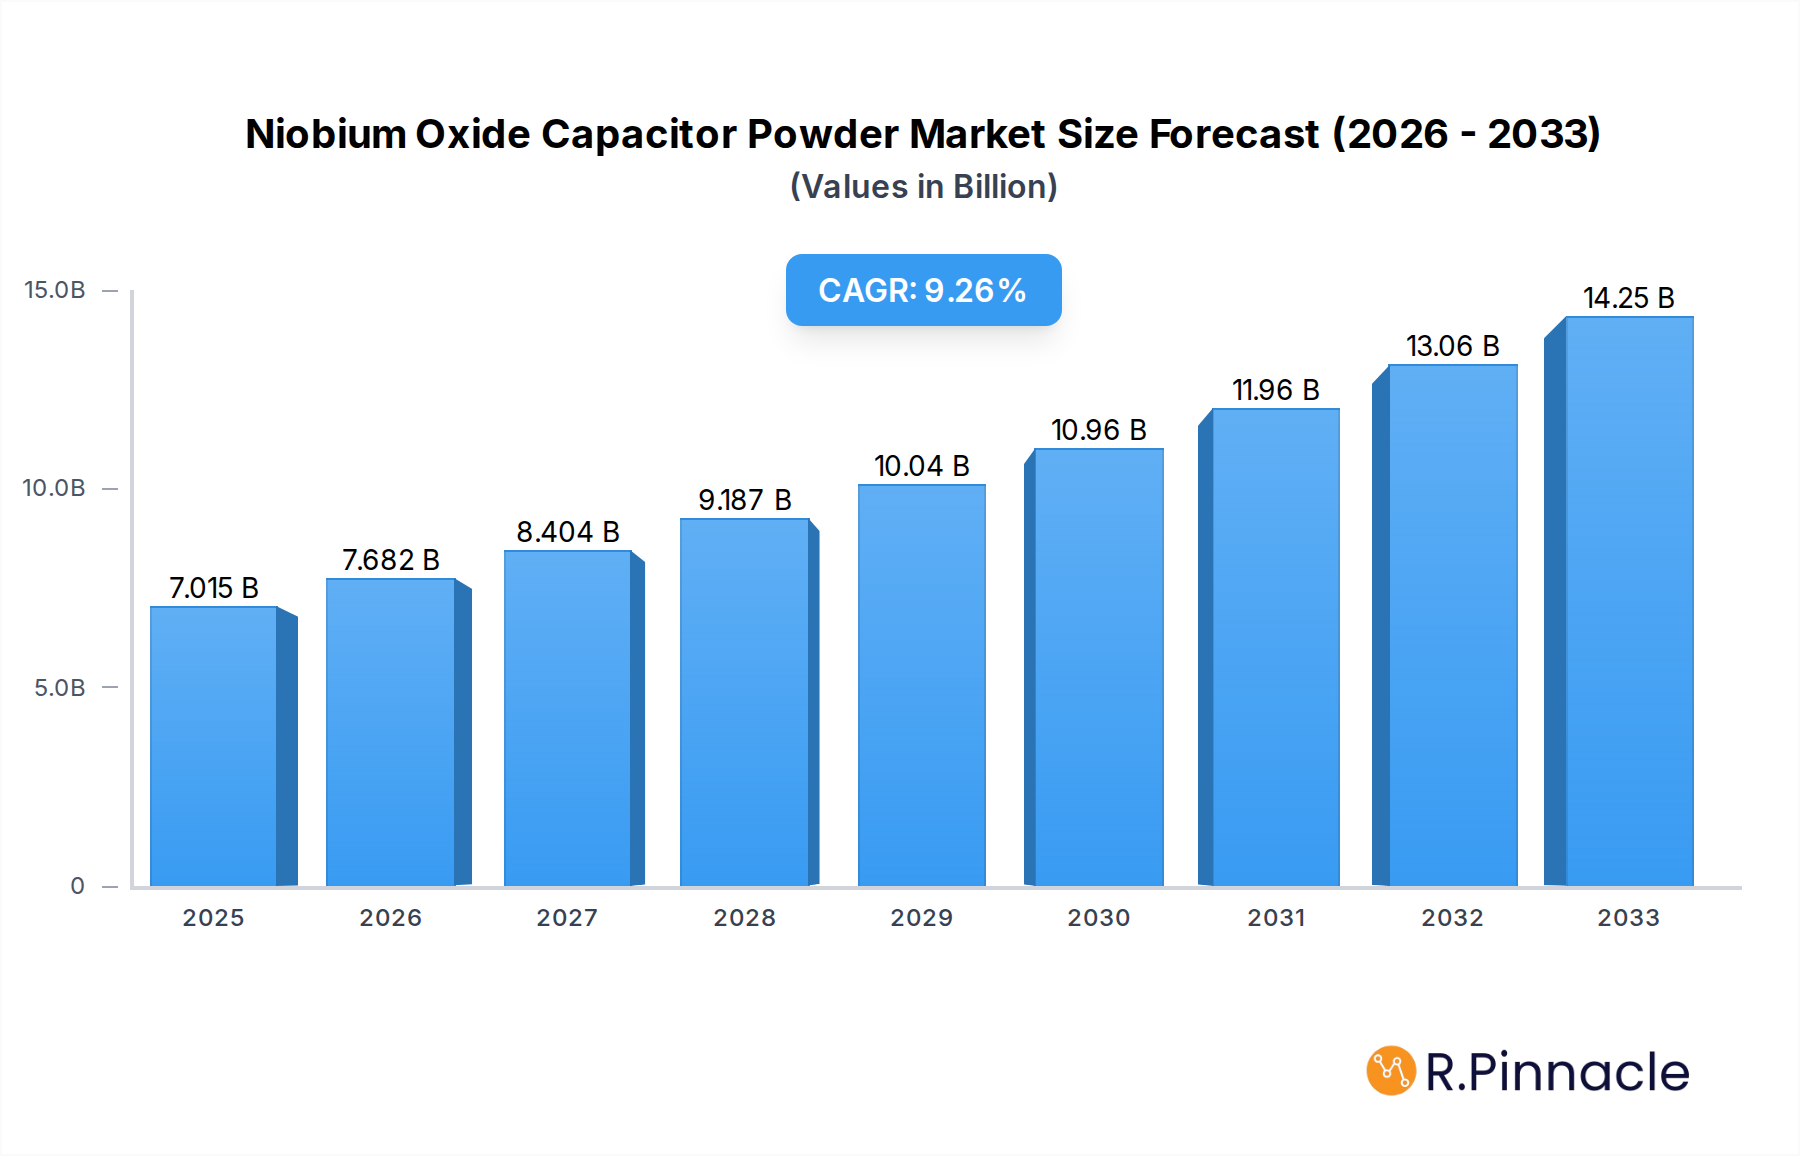
The global niobium oxide capacitor powder market is poised for robust expansion, driven by escalating demand for advanced electronic components that offer superior performance and miniaturization. With an estimated market size of USD 7,015 million in 2025, the sector is projected to witness a significant Compound Annual Growth Rate (CAGR) of 9.54% through the forecast period ending in 2033. This growth trajectory is primarily fueled by the increasing adoption of niobium oxide capacitors in high-performance applications across consumer electronics, automotive, and industrial sectors. The superior volumetric efficiency, excellent capacitance retention, and inherent stability of niobium oxide make it an attractive alternative to traditional tantalum-based capacitors, especially as devices become smaller and require more power. Innovations in material processing and manufacturing techniques are further enhancing the capabilities of these powders, leading to the development of capacitors with higher CV (capacitance voltage) ratings and lower Equivalent Series Resistance (ESR), crucial for advanced power management and filtering in modern electronics.

Niobium Oxide Capacitor Powder Market Size (In Billion)
Key market drivers include the burgeoning demand for smartphones, wearable technology, electric vehicles, and sophisticated industrial control systems, all of which rely heavily on compact and efficient energy storage solutions. The "General Niobium Oxide Capacitor" segment, alongside "High CV Niobium Oxide Capacitor" and "Low ESR Niobium Oxide Capacitor," are expected to see substantial growth as manufacturers push the boundaries of capacitor technology. While the market is largely dominated by established players like TANIOBIS and Dongfang Tantalum Industry, opportunities exist for companies focusing on niche applications and advanced material formulations. Regions like Asia Pacific, particularly China and Japan, are anticipated to lead the market in terms of both production and consumption, owing to their strong manufacturing base and rapid technological adoption. The forecast period will likely see increased investment in R&D to further optimize niobium oxide purity and performance characteristics, addressing potential challenges related to raw material sourcing and cost-effectiveness.
Niobium Oxide Capacitor Powder Company Market Share
This in-depth report provides a granular analysis of the global Niobium Oxide Capacitor Powder market, offering critical insights into its structure, dynamics, and future trajectory. Spanning the historical period of 2019–2024, with a base year of 2025 and a forecast period extending to 2033, this research is essential for industry stakeholders seeking to capitalize on emerging trends and navigate market complexities. We delve into key segments, dominant regions, technological innovations, and the competitive landscape, featuring leading players like TANIOBIS and Dongfang Tantalum Industry. The report is meticulously structured to deliver actionable intelligence, aiding strategic decision-making in this dynamic sector.
Niobium Oxide Capacitor Powder Market Structure & Innovation Trends
The Niobium Oxide Capacitor Powder market exhibits a moderate concentration, with a few key players dominating the supply chain. Innovation is primarily driven by the demand for higher capacitance density and improved performance characteristics in electronic components. Regulatory frameworks, particularly those concerning material sourcing and environmental impact, are increasingly influencing market practices. Product substitutes, such as tantalum and aluminum electrolytic capacitors, offer alternative solutions, though niobium oxide's unique properties provide distinct advantages in specific applications. End-user demographics are shifting towards industries with high miniaturization and power efficiency requirements, including consumer electronics, automotive, and telecommunications. Mergers and acquisitions (M&A) are sporadic but significant, often aimed at consolidating market share or acquiring proprietary technologies. For instance, recent M&A deal values in the broader capacitor materials sector have reached into the hundreds of millions. Understanding these structural elements is crucial for forecasting market evolution and identifying strategic growth avenues.
Niobium Oxide Capacitor Powder Market Dynamics & Trends
The Niobium Oxide Capacitor Powder market is poised for robust growth, projected to experience a Compound Annual Growth Rate (CAGR) of approximately 8.5% over the forecast period. This expansion is fueled by the relentless miniaturization trend in consumer electronics, where advanced capacitor technologies are indispensable for creating smaller, more powerful devices. The increasing adoption of electric vehicles (EVs) also presents a significant growth catalyst, as these vehicles demand high-performance capacitors for power management and energy storage systems. Furthermore, the proliferation of 5G infrastructure and the expansion of the Internet of Things (IoT) ecosystem are creating substantial demand for reliable and efficient electronic components, including niobium oxide capacitors.
Technological disruptions are playing a pivotal role, with ongoing research focused on enhancing the volumetric efficiency and voltage rating of niobium oxide capacitors. Innovations in powder processing and manufacturing techniques are enabling the production of higher purity grades (e.g., 99.9% purity) with finer particle sizes, leading to superior performance characteristics. Consumer preferences are increasingly skewed towards energy-efficient and long-lasting electronic devices, directly benefiting the adoption of high-quality niobium oxide capacitors. The competitive dynamics within the market are characterized by a blend of established players and emerging manufacturers, all vying for market share through product differentiation and cost-competitiveness. Market penetration of niobium oxide capacitors is steadily increasing, particularly in applications previously dominated by other capacitor types, due to their inherent advantages in terms of stability, reliability, and frequency response. The estimated market size for niobium oxide capacitor powder is projected to exceed several million dollars by 2025, with significant potential for further expansion.
Dominant Regions & Segments in Niobium Oxide Capacitor Powder
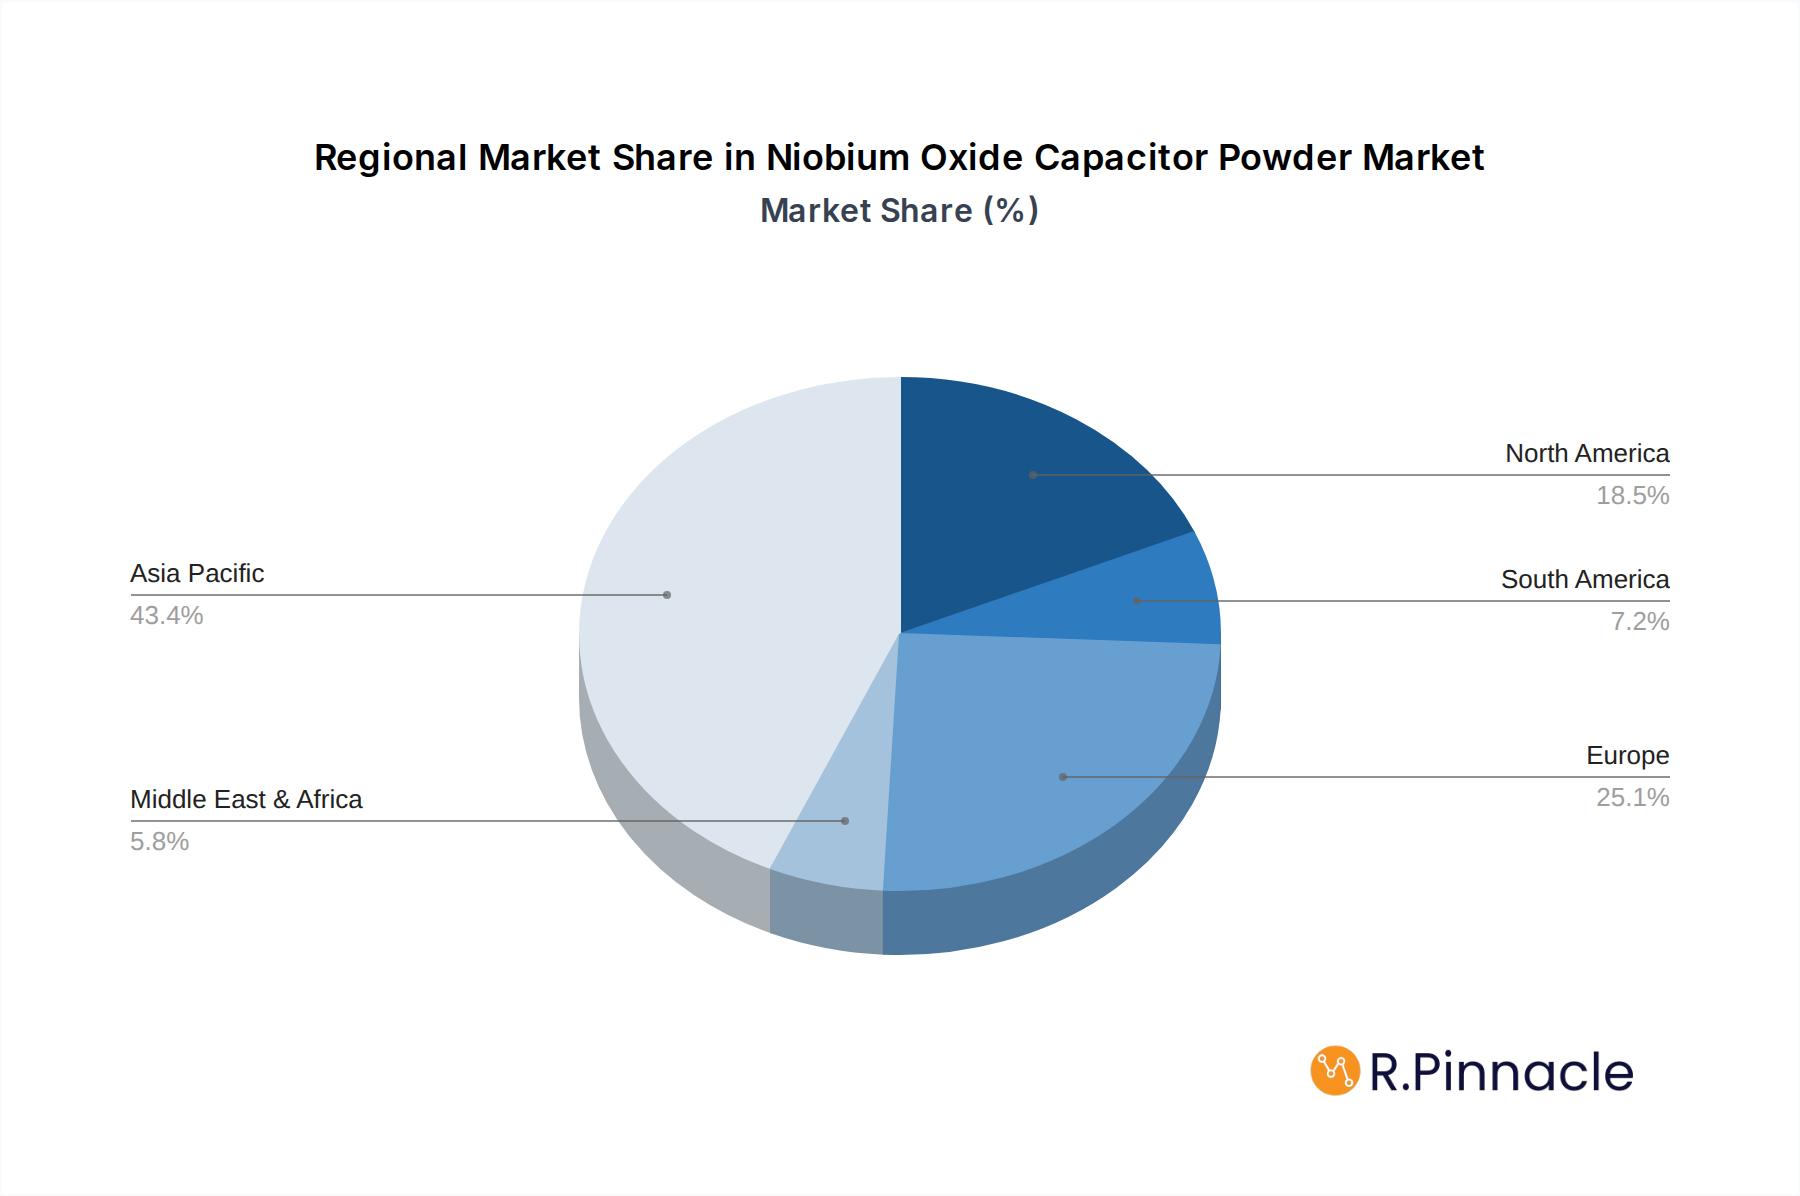
Asia Pacific is emerging as the dominant region in the Niobium Oxide Capacitor Powder market, driven by its expansive manufacturing base for electronic components and the burgeoning demand from its rapidly growing economies. Countries like China, South Korea, and Taiwan are at the forefront of this dominance, acting as major hubs for the production and consumption of electronic devices.
Application Dominance:
- High CV Niobium Oxide Capacitor: This segment holds significant sway due to the increasing demand for higher capacitance values in a smaller form factor, crucial for modern electronic designs. The automotive and telecommunications sectors are major contributors to this segment's growth.
- General Niobium Oxide Capacitor: While established, this segment continues to be a substantial contributor, catering to a broad range of general-purpose electronic applications.
Type Dominance:
- 99.9% Purity: The demand for high-purity niobium oxide powder is paramount, as it directly correlates with the performance and reliability of advanced capacitors. Manufacturers are increasingly investing in producing and sourcing this grade to meet stringent industry standards.
Key drivers for this regional and segmental dominance include favorable government policies supporting the electronics manufacturing sector, substantial investments in research and development, and the presence of a skilled workforce. The robust infrastructure development across these regions further facilitates efficient production and supply chains. For example, economic policies in countries like South Korea have consistently fostered innovation and growth in the semiconductor and electronic component industries, directly impacting the niobium oxide capacitor powder market. The continuous integration of advanced niobium oxide capacitors into consumer electronics, industrial automation, and renewable energy solutions solidifies the dominance of these segments and regions in the foreseeable future. The market penetration of 99.9% purity niobium oxide powder is high, reflecting its essential role in high-performance applications.
Niobium Oxide Capacitor Powder Product Innovations
Product innovation in the Niobium Oxide Capacitor Powder market is centered on achieving higher capacitance density and enhanced volumetric efficiency. Developments focus on producing finer, more uniform powder particles through advanced synthesis and processing techniques. These innovations enable the creation of capacitors with significantly improved CV (capacitance-voltage) ratings, crucial for miniaturization in consumer electronics and power management applications. Competitive advantages are realized through superior dielectric properties, increased operating temperatures, and enhanced ripple current handling capabilities. Technological trends are pushing towards more sustainable and cost-effective production methods, ensuring market fit with evolving industry demands for high-performance and reliable electronic components.
Report Scope & Segmentation Analysis
The Niobium Oxide Capacitor Powder market is segmented based on critical application and product type parameters, providing a granular view of market dynamics.
Application Segments:
- General Niobium Oxide Capacitor: This segment caters to a wide array of standard electronic applications. Growth projections indicate a steady, moderate expansion, with a market size estimated in the tens of millions.
- High CV Niobium Oxide Capacitor: Driven by the demand for miniaturization and high performance, this segment exhibits strong growth potential, with projected market sizes in the hundreds of millions and a CAGR exceeding 9%.
- Low ESR Niobium Oxide Capacitor: This niche segment, crucial for high-frequency applications, is also expected to see significant growth, driven by advancements in telecommunications and power electronics. Market size is estimated in the tens of millions.
- Other: This category encompasses specialized applications and emerging uses, with modest but consistent growth anticipated.
Type Segments:
- 99.9% Purity: This high-grade segment is the primary driver of market value, reflecting its critical role in high-performance capacitors. Projected market sizes are in the hundreds of millions, with a high CAGR.
- Other: This includes lower purity grades or specialized compositions, catering to less demanding applications. Growth is expected to be moderate.
Key Drivers of Niobium Oxide Capacitor Powder Growth
The growth of the Niobium Oxide Capacitor Powder market is propelled by several interconnected factors. The relentless miniaturization trend across all electronic devices necessitates capacitors with higher energy density, a key strength of niobium oxide. The burgeoning electric vehicle (EV) market, with its demand for efficient power management systems, is a significant growth accelerator. Furthermore, the expansion of 5G networks and the proliferation of IoT devices require highly reliable and stable electronic components, driving demand for niobium-based capacitors. Technological advancements in powder processing, leading to higher purity and improved particle characteristics, are enabling new application possibilities and enhancing performance. Economic factors, such as increasing disposable incomes in emerging economies and government initiatives supporting technological development, also contribute to market expansion.
Challenges in the Niobium Oxide Capacitor Powder Sector
Despite its growth potential, the Niobium Oxide Capacitor Powder sector faces several challenges. Fluctuations in the price and availability of raw niobium ore can impact production costs and supply chain stability. Stringent environmental regulations regarding mining and processing can lead to increased operational expenses and compliance hurdles. The availability of established substitutes, such as tantalum and ceramic capacitors, presents ongoing competitive pressure, particularly in cost-sensitive applications. Furthermore, the technical expertise required for high-purity niobium oxide powder production and capacitor manufacturing limits the number of market participants, potentially creating supply chain bottlenecks. Intense competition among existing players also exerts downward pressure on profit margins, requiring continuous innovation and cost optimization.
Emerging Opportunities in Niobium Oxide Capacitor Powder
The Niobium Oxide Capacitor Powder market presents several exciting emerging opportunities. The rapid growth of the electric vehicle (EV) sector is a prime area, with increasing demand for high-performance capacitors in battery management systems, power inverters, and onboard charging. The expanding 5G infrastructure and the proliferation of IoT devices create a substantial market for reliable and compact capacitors. Advances in medical electronics and wearable technology also offer new avenues for miniaturized and efficient niobium oxide capacitors. Furthermore, research into solid-state electrolytes and advanced battery technologies could lead to novel applications for niobium oxide-based materials. Exploring these niche and high-growth segments can unlock significant market potential.
Leading Players in the Niobium Oxide Capacitor Powder Market
- TANIOBIS
- Dongfang Tantalum Industry
Key Developments in Niobium Oxide Capacitor Powder Industry
- 2023: Introduction of advanced niobium oxide powder grades with enhanced dielectric properties for high-voltage applications.
- 2022: Increased investment in R&D by major players to improve powder synthesis and processing techniques, aiming for higher purity and finer particle sizes.
- 2021: Growing demand for niobium oxide capacitors in automotive electronics, particularly in EV power management systems.
- 2020: Focus on sustainable sourcing and environmentally friendly production methods for niobium oxide powder.
- 2019: Significant advancements in manufacturing processes leading to improved consistency and reliability of niobium oxide capacitor powder.
Future Outlook for Niobium Oxide Capacitor Powder Market
The future outlook for the Niobium Oxide Capacitor Powder market is exceptionally positive, driven by the insatiable demand for smaller, more powerful, and energy-efficient electronic components. The continued growth of electric vehicles, 5G networks, and the Internet of Things will be pivotal in accelerating market expansion. Strategic opportunities lie in developing specialized niobium oxide powders tailored for emerging applications, such as advanced battery technologies and high-performance computing. Continued investment in research and development to push the boundaries of capacitance density and voltage ratings will be crucial for maintaining a competitive edge. Collaboration between powder manufacturers and capacitor producers will further optimize product development and market penetration. The market is expected to witness sustained growth, with innovative solutions playing a key role in unlocking its full potential.
Niobium Oxide Capacitor Powder Segmentation
-
1. Application
- 1.1. General Niobium Oxide Capacitor
- 1.2. High CV Niobium Oxide Capacitor
- 1.3. Low ESR Niobium Oxide Capacitor
- 1.4. Other
-
2. Type
- 2.1. 99.9% Purity
- 2.2. Other
Niobium Oxide Capacitor Powder Segmentation By Geography
-
1. North America
- 1.1. United States
- 1.2. Canada
- 1.3. Mexico
-
2. South America
- 2.1. Brazil
- 2.2. Argentina
- 2.3. Rest of South America
-
3. Europe
- 3.1. United Kingdom
- 3.2. Germany
- 3.3. France
- 3.4. Italy
- 3.5. Spain
- 3.6. Russia
- 3.7. Benelux
- 3.8. Nordics
- 3.9. Rest of Europe
-
4. Middle East & Africa
- 4.1. Turkey
- 4.2. Israel
- 4.3. GCC
- 4.4. North Africa
- 4.5. South Africa
- 4.6. Rest of Middle East & Africa
-
5. Asia Pacific
- 5.1. China
- 5.2. India
- 5.3. Japan
- 5.4. South Korea
- 5.5. ASEAN
- 5.6. Oceania
- 5.7. Rest of Asia Pacific
Niobium Oxide Capacitor Powder Regional Market Share
Geographic Coverage of Niobium Oxide Capacitor Powder
Niobium Oxide Capacitor Powder REPORT HIGHLIGHTS
| Aspects | Details |
|---|---|
| Study Period | 2020-2034 |
| Base Year | 2025 |
| Estimated Year | 2026 |
| Forecast Period | 2026-2034 |
| Historical Period | 2020-2025 |
| Growth Rate | CAGR of 9.54% from 2020-2034 |
| Segmentation |
|
Table of Contents
- 1. Introduction
- 1.1. Research Scope
- 1.2. Market Segmentation
- 1.3. Research Methodology
- 1.4. Definitions and Assumptions
- 2. Executive Summary
- 2.1. Introduction
- 3. Market Dynamics
- 3.1. Introduction
- 3.2. Market Drivers
- 3.3. Market Restrains
- 3.4. Market Trends
- 4. Market Factor Analysis
- 4.1. Porters Five Forces
- 4.2. Supply/Value Chain
- 4.3. PESTEL analysis
- 4.4. Market Entropy
- 4.5. Patent/Trademark Analysis
- 5. Global Niobium Oxide Capacitor Powder Analysis, Insights and Forecast, 2020-2032
- 5.1. Market Analysis, Insights and Forecast - by Application
- 5.1.1. General Niobium Oxide Capacitor
- 5.1.2. High CV Niobium Oxide Capacitor
- 5.1.3. Low ESR Niobium Oxide Capacitor
- 5.1.4. Other
- 5.2. Market Analysis, Insights and Forecast - by Type
- 5.2.1. 99.9% Purity
- 5.2.2. Other
- 5.3. Market Analysis, Insights and Forecast - by Region
- 5.3.1. North America
- 5.3.2. South America
- 5.3.3. Europe
- 5.3.4. Middle East & Africa
- 5.3.5. Asia Pacific
- 5.1. Market Analysis, Insights and Forecast - by Application
- 6. North America Niobium Oxide Capacitor Powder Analysis, Insights and Forecast, 2020-2032
- 6.1. Market Analysis, Insights and Forecast - by Application
- 6.1.1. General Niobium Oxide Capacitor
- 6.1.2. High CV Niobium Oxide Capacitor
- 6.1.3. Low ESR Niobium Oxide Capacitor
- 6.1.4. Other
- 6.2. Market Analysis, Insights and Forecast - by Type
- 6.2.1. 99.9% Purity
- 6.2.2. Other
- 6.1. Market Analysis, Insights and Forecast - by Application
- 7. South America Niobium Oxide Capacitor Powder Analysis, Insights and Forecast, 2020-2032
- 7.1. Market Analysis, Insights and Forecast - by Application
- 7.1.1. General Niobium Oxide Capacitor
- 7.1.2. High CV Niobium Oxide Capacitor
- 7.1.3. Low ESR Niobium Oxide Capacitor
- 7.1.4. Other
- 7.2. Market Analysis, Insights and Forecast - by Type
- 7.2.1. 99.9% Purity
- 7.2.2. Other
- 7.1. Market Analysis, Insights and Forecast - by Application
- 8. Europe Niobium Oxide Capacitor Powder Analysis, Insights and Forecast, 2020-2032
- 8.1. Market Analysis, Insights and Forecast - by Application
- 8.1.1. General Niobium Oxide Capacitor
- 8.1.2. High CV Niobium Oxide Capacitor
- 8.1.3. Low ESR Niobium Oxide Capacitor
- 8.1.4. Other
- 8.2. Market Analysis, Insights and Forecast - by Type
- 8.2.1. 99.9% Purity
- 8.2.2. Other
- 8.1. Market Analysis, Insights and Forecast - by Application
- 9. Middle East & Africa Niobium Oxide Capacitor Powder Analysis, Insights and Forecast, 2020-2032
- 9.1. Market Analysis, Insights and Forecast - by Application
- 9.1.1. General Niobium Oxide Capacitor
- 9.1.2. High CV Niobium Oxide Capacitor
- 9.1.3. Low ESR Niobium Oxide Capacitor
- 9.1.4. Other
- 9.2. Market Analysis, Insights and Forecast - by Type
- 9.2.1. 99.9% Purity
- 9.2.2. Other
- 9.1. Market Analysis, Insights and Forecast - by Application
- 10. Asia Pacific Niobium Oxide Capacitor Powder Analysis, Insights and Forecast, 2020-2032
- 10.1. Market Analysis, Insights and Forecast - by Application
- 10.1.1. General Niobium Oxide Capacitor
- 10.1.2. High CV Niobium Oxide Capacitor
- 10.1.3. Low ESR Niobium Oxide Capacitor
- 10.1.4. Other
- 10.2. Market Analysis, Insights and Forecast - by Type
- 10.2.1. 99.9% Purity
- 10.2.2. Other
- 10.1. Market Analysis, Insights and Forecast - by Application
- 11. Competitive Analysis
- 11.1. Global Market Share Analysis 2025
- 11.2. Company Profiles
- 11.2.1 TANIOBIS
- 11.2.1.1. Overview
- 11.2.1.2. Products
- 11.2.1.3. SWOT Analysis
- 11.2.1.4. Recent Developments
- 11.2.1.5. Financials (Based on Availability)
- 11.2.2 Dongfang Tantalum Industry
- 11.2.2.1. Overview
- 11.2.2.2. Products
- 11.2.2.3. SWOT Analysis
- 11.2.2.4. Recent Developments
- 11.2.2.5. Financials (Based on Availability)
- 11.2.1 TANIOBIS
List of Figures
- Figure 1: Global Niobium Oxide Capacitor Powder Revenue Breakdown (million, %) by Region 2025 & 2033
- Figure 2: Global Niobium Oxide Capacitor Powder Volume Breakdown (K, %) by Region 2025 & 2033
- Figure 3: North America Niobium Oxide Capacitor Powder Revenue (million), by Application 2025 & 2033
- Figure 4: North America Niobium Oxide Capacitor Powder Volume (K), by Application 2025 & 2033
- Figure 5: North America Niobium Oxide Capacitor Powder Revenue Share (%), by Application 2025 & 2033
- Figure 6: North America Niobium Oxide Capacitor Powder Volume Share (%), by Application 2025 & 2033
- Figure 7: North America Niobium Oxide Capacitor Powder Revenue (million), by Type 2025 & 2033
- Figure 8: North America Niobium Oxide Capacitor Powder Volume (K), by Type 2025 & 2033
- Figure 9: North America Niobium Oxide Capacitor Powder Revenue Share (%), by Type 2025 & 2033
- Figure 10: North America Niobium Oxide Capacitor Powder Volume Share (%), by Type 2025 & 2033
- Figure 11: North America Niobium Oxide Capacitor Powder Revenue (million), by Country 2025 & 2033
- Figure 12: North America Niobium Oxide Capacitor Powder Volume (K), by Country 2025 & 2033
- Figure 13: North America Niobium Oxide Capacitor Powder Revenue Share (%), by Country 2025 & 2033
- Figure 14: North America Niobium Oxide Capacitor Powder Volume Share (%), by Country 2025 & 2033
- Figure 15: South America Niobium Oxide Capacitor Powder Revenue (million), by Application 2025 & 2033
- Figure 16: South America Niobium Oxide Capacitor Powder Volume (K), by Application 2025 & 2033
- Figure 17: South America Niobium Oxide Capacitor Powder Revenue Share (%), by Application 2025 & 2033
- Figure 18: South America Niobium Oxide Capacitor Powder Volume Share (%), by Application 2025 & 2033
- Figure 19: South America Niobium Oxide Capacitor Powder Revenue (million), by Type 2025 & 2033
- Figure 20: South America Niobium Oxide Capacitor Powder Volume (K), by Type 2025 & 2033
- Figure 21: South America Niobium Oxide Capacitor Powder Revenue Share (%), by Type 2025 & 2033
- Figure 22: South America Niobium Oxide Capacitor Powder Volume Share (%), by Type 2025 & 2033
- Figure 23: South America Niobium Oxide Capacitor Powder Revenue (million), by Country 2025 & 2033
- Figure 24: South America Niobium Oxide Capacitor Powder Volume (K), by Country 2025 & 2033
- Figure 25: South America Niobium Oxide Capacitor Powder Revenue Share (%), by Country 2025 & 2033
- Figure 26: South America Niobium Oxide Capacitor Powder Volume Share (%), by Country 2025 & 2033
- Figure 27: Europe Niobium Oxide Capacitor Powder Revenue (million), by Application 2025 & 2033
- Figure 28: Europe Niobium Oxide Capacitor Powder Volume (K), by Application 2025 & 2033
- Figure 29: Europe Niobium Oxide Capacitor Powder Revenue Share (%), by Application 2025 & 2033
- Figure 30: Europe Niobium Oxide Capacitor Powder Volume Share (%), by Application 2025 & 2033
- Figure 31: Europe Niobium Oxide Capacitor Powder Revenue (million), by Type 2025 & 2033
- Figure 32: Europe Niobium Oxide Capacitor Powder Volume (K), by Type 2025 & 2033
- Figure 33: Europe Niobium Oxide Capacitor Powder Revenue Share (%), by Type 2025 & 2033
- Figure 34: Europe Niobium Oxide Capacitor Powder Volume Share (%), by Type 2025 & 2033
- Figure 35: Europe Niobium Oxide Capacitor Powder Revenue (million), by Country 2025 & 2033
- Figure 36: Europe Niobium Oxide Capacitor Powder Volume (K), by Country 2025 & 2033
- Figure 37: Europe Niobium Oxide Capacitor Powder Revenue Share (%), by Country 2025 & 2033
- Figure 38: Europe Niobium Oxide Capacitor Powder Volume Share (%), by Country 2025 & 2033
- Figure 39: Middle East & Africa Niobium Oxide Capacitor Powder Revenue (million), by Application 2025 & 2033
- Figure 40: Middle East & Africa Niobium Oxide Capacitor Powder Volume (K), by Application 2025 & 2033
- Figure 41: Middle East & Africa Niobium Oxide Capacitor Powder Revenue Share (%), by Application 2025 & 2033
- Figure 42: Middle East & Africa Niobium Oxide Capacitor Powder Volume Share (%), by Application 2025 & 2033
- Figure 43: Middle East & Africa Niobium Oxide Capacitor Powder Revenue (million), by Type 2025 & 2033
- Figure 44: Middle East & Africa Niobium Oxide Capacitor Powder Volume (K), by Type 2025 & 2033
- Figure 45: Middle East & Africa Niobium Oxide Capacitor Powder Revenue Share (%), by Type 2025 & 2033
- Figure 46: Middle East & Africa Niobium Oxide Capacitor Powder Volume Share (%), by Type 2025 & 2033
- Figure 47: Middle East & Africa Niobium Oxide Capacitor Powder Revenue (million), by Country 2025 & 2033
- Figure 48: Middle East & Africa Niobium Oxide Capacitor Powder Volume (K), by Country 2025 & 2033
- Figure 49: Middle East & Africa Niobium Oxide Capacitor Powder Revenue Share (%), by Country 2025 & 2033
- Figure 50: Middle East & Africa Niobium Oxide Capacitor Powder Volume Share (%), by Country 2025 & 2033
- Figure 51: Asia Pacific Niobium Oxide Capacitor Powder Revenue (million), by Application 2025 & 2033
- Figure 52: Asia Pacific Niobium Oxide Capacitor Powder Volume (K), by Application 2025 & 2033
- Figure 53: Asia Pacific Niobium Oxide Capacitor Powder Revenue Share (%), by Application 2025 & 2033
- Figure 54: Asia Pacific Niobium Oxide Capacitor Powder Volume Share (%), by Application 2025 & 2033
- Figure 55: Asia Pacific Niobium Oxide Capacitor Powder Revenue (million), by Type 2025 & 2033
- Figure 56: Asia Pacific Niobium Oxide Capacitor Powder Volume (K), by Type 2025 & 2033
- Figure 57: Asia Pacific Niobium Oxide Capacitor Powder Revenue Share (%), by Type 2025 & 2033
- Figure 58: Asia Pacific Niobium Oxide Capacitor Powder Volume Share (%), by Type 2025 & 2033
- Figure 59: Asia Pacific Niobium Oxide Capacitor Powder Revenue (million), by Country 2025 & 2033
- Figure 60: Asia Pacific Niobium Oxide Capacitor Powder Volume (K), by Country 2025 & 2033
- Figure 61: Asia Pacific Niobium Oxide Capacitor Powder Revenue Share (%), by Country 2025 & 2033
- Figure 62: Asia Pacific Niobium Oxide Capacitor Powder Volume Share (%), by Country 2025 & 2033
List of Tables
- Table 1: Global Niobium Oxide Capacitor Powder Revenue million Forecast, by Application 2020 & 2033
- Table 2: Global Niobium Oxide Capacitor Powder Volume K Forecast, by Application 2020 & 2033
- Table 3: Global Niobium Oxide Capacitor Powder Revenue million Forecast, by Type 2020 & 2033
- Table 4: Global Niobium Oxide Capacitor Powder Volume K Forecast, by Type 2020 & 2033
- Table 5: Global Niobium Oxide Capacitor Powder Revenue million Forecast, by Region 2020 & 2033
- Table 6: Global Niobium Oxide Capacitor Powder Volume K Forecast, by Region 2020 & 2033
- Table 7: Global Niobium Oxide Capacitor Powder Revenue million Forecast, by Application 2020 & 2033
- Table 8: Global Niobium Oxide Capacitor Powder Volume K Forecast, by Application 2020 & 2033
- Table 9: Global Niobium Oxide Capacitor Powder Revenue million Forecast, by Type 2020 & 2033
- Table 10: Global Niobium Oxide Capacitor Powder Volume K Forecast, by Type 2020 & 2033
- Table 11: Global Niobium Oxide Capacitor Powder Revenue million Forecast, by Country 2020 & 2033
- Table 12: Global Niobium Oxide Capacitor Powder Volume K Forecast, by Country 2020 & 2033
- Table 13: United States Niobium Oxide Capacitor Powder Revenue (million) Forecast, by Application 2020 & 2033
- Table 14: United States Niobium Oxide Capacitor Powder Volume (K) Forecast, by Application 2020 & 2033
- Table 15: Canada Niobium Oxide Capacitor Powder Revenue (million) Forecast, by Application 2020 & 2033
- Table 16: Canada Niobium Oxide Capacitor Powder Volume (K) Forecast, by Application 2020 & 2033
- Table 17: Mexico Niobium Oxide Capacitor Powder Revenue (million) Forecast, by Application 2020 & 2033
- Table 18: Mexico Niobium Oxide Capacitor Powder Volume (K) Forecast, by Application 2020 & 2033
- Table 19: Global Niobium Oxide Capacitor Powder Revenue million Forecast, by Application 2020 & 2033
- Table 20: Global Niobium Oxide Capacitor Powder Volume K Forecast, by Application 2020 & 2033
- Table 21: Global Niobium Oxide Capacitor Powder Revenue million Forecast, by Type 2020 & 2033
- Table 22: Global Niobium Oxide Capacitor Powder Volume K Forecast, by Type 2020 & 2033
- Table 23: Global Niobium Oxide Capacitor Powder Revenue million Forecast, by Country 2020 & 2033
- Table 24: Global Niobium Oxide Capacitor Powder Volume K Forecast, by Country 2020 & 2033
- Table 25: Brazil Niobium Oxide Capacitor Powder Revenue (million) Forecast, by Application 2020 & 2033
- Table 26: Brazil Niobium Oxide Capacitor Powder Volume (K) Forecast, by Application 2020 & 2033
- Table 27: Argentina Niobium Oxide Capacitor Powder Revenue (million) Forecast, by Application 2020 & 2033
- Table 28: Argentina Niobium Oxide Capacitor Powder Volume (K) Forecast, by Application 2020 & 2033
- Table 29: Rest of South America Niobium Oxide Capacitor Powder Revenue (million) Forecast, by Application 2020 & 2033
- Table 30: Rest of South America Niobium Oxide Capacitor Powder Volume (K) Forecast, by Application 2020 & 2033
- Table 31: Global Niobium Oxide Capacitor Powder Revenue million Forecast, by Application 2020 & 2033
- Table 32: Global Niobium Oxide Capacitor Powder Volume K Forecast, by Application 2020 & 2033
- Table 33: Global Niobium Oxide Capacitor Powder Revenue million Forecast, by Type 2020 & 2033
- Table 34: Global Niobium Oxide Capacitor Powder Volume K Forecast, by Type 2020 & 2033
- Table 35: Global Niobium Oxide Capacitor Powder Revenue million Forecast, by Country 2020 & 2033
- Table 36: Global Niobium Oxide Capacitor Powder Volume K Forecast, by Country 2020 & 2033
- Table 37: United Kingdom Niobium Oxide Capacitor Powder Revenue (million) Forecast, by Application 2020 & 2033
- Table 38: United Kingdom Niobium Oxide Capacitor Powder Volume (K) Forecast, by Application 2020 & 2033
- Table 39: Germany Niobium Oxide Capacitor Powder Revenue (million) Forecast, by Application 2020 & 2033
- Table 40: Germany Niobium Oxide Capacitor Powder Volume (K) Forecast, by Application 2020 & 2033
- Table 41: France Niobium Oxide Capacitor Powder Revenue (million) Forecast, by Application 2020 & 2033
- Table 42: France Niobium Oxide Capacitor Powder Volume (K) Forecast, by Application 2020 & 2033
- Table 43: Italy Niobium Oxide Capacitor Powder Revenue (million) Forecast, by Application 2020 & 2033
- Table 44: Italy Niobium Oxide Capacitor Powder Volume (K) Forecast, by Application 2020 & 2033
- Table 45: Spain Niobium Oxide Capacitor Powder Revenue (million) Forecast, by Application 2020 & 2033
- Table 46: Spain Niobium Oxide Capacitor Powder Volume (K) Forecast, by Application 2020 & 2033
- Table 47: Russia Niobium Oxide Capacitor Powder Revenue (million) Forecast, by Application 2020 & 2033
- Table 48: Russia Niobium Oxide Capacitor Powder Volume (K) Forecast, by Application 2020 & 2033
- Table 49: Benelux Niobium Oxide Capacitor Powder Revenue (million) Forecast, by Application 2020 & 2033
- Table 50: Benelux Niobium Oxide Capacitor Powder Volume (K) Forecast, by Application 2020 & 2033
- Table 51: Nordics Niobium Oxide Capacitor Powder Revenue (million) Forecast, by Application 2020 & 2033
- Table 52: Nordics Niobium Oxide Capacitor Powder Volume (K) Forecast, by Application 2020 & 2033
- Table 53: Rest of Europe Niobium Oxide Capacitor Powder Revenue (million) Forecast, by Application 2020 & 2033
- Table 54: Rest of Europe Niobium Oxide Capacitor Powder Volume (K) Forecast, by Application 2020 & 2033
- Table 55: Global Niobium Oxide Capacitor Powder Revenue million Forecast, by Application 2020 & 2033
- Table 56: Global Niobium Oxide Capacitor Powder Volume K Forecast, by Application 2020 & 2033
- Table 57: Global Niobium Oxide Capacitor Powder Revenue million Forecast, by Type 2020 & 2033
- Table 58: Global Niobium Oxide Capacitor Powder Volume K Forecast, by Type 2020 & 2033
- Table 59: Global Niobium Oxide Capacitor Powder Revenue million Forecast, by Country 2020 & 2033
- Table 60: Global Niobium Oxide Capacitor Powder Volume K Forecast, by Country 2020 & 2033
- Table 61: Turkey Niobium Oxide Capacitor Powder Revenue (million) Forecast, by Application 2020 & 2033
- Table 62: Turkey Niobium Oxide Capacitor Powder Volume (K) Forecast, by Application 2020 & 2033
- Table 63: Israel Niobium Oxide Capacitor Powder Revenue (million) Forecast, by Application 2020 & 2033
- Table 64: Israel Niobium Oxide Capacitor Powder Volume (K) Forecast, by Application 2020 & 2033
- Table 65: GCC Niobium Oxide Capacitor Powder Revenue (million) Forecast, by Application 2020 & 2033
- Table 66: GCC Niobium Oxide Capacitor Powder Volume (K) Forecast, by Application 2020 & 2033
- Table 67: North Africa Niobium Oxide Capacitor Powder Revenue (million) Forecast, by Application 2020 & 2033
- Table 68: North Africa Niobium Oxide Capacitor Powder Volume (K) Forecast, by Application 2020 & 2033
- Table 69: South Africa Niobium Oxide Capacitor Powder Revenue (million) Forecast, by Application 2020 & 2033
- Table 70: South Africa Niobium Oxide Capacitor Powder Volume (K) Forecast, by Application 2020 & 2033
- Table 71: Rest of Middle East & Africa Niobium Oxide Capacitor Powder Revenue (million) Forecast, by Application 2020 & 2033
- Table 72: Rest of Middle East & Africa Niobium Oxide Capacitor Powder Volume (K) Forecast, by Application 2020 & 2033
- Table 73: Global Niobium Oxide Capacitor Powder Revenue million Forecast, by Application 2020 & 2033
- Table 74: Global Niobium Oxide Capacitor Powder Volume K Forecast, by Application 2020 & 2033
- Table 75: Global Niobium Oxide Capacitor Powder Revenue million Forecast, by Type 2020 & 2033
- Table 76: Global Niobium Oxide Capacitor Powder Volume K Forecast, by Type 2020 & 2033
- Table 77: Global Niobium Oxide Capacitor Powder Revenue million Forecast, by Country 2020 & 2033
- Table 78: Global Niobium Oxide Capacitor Powder Volume K Forecast, by Country 2020 & 2033
- Table 79: China Niobium Oxide Capacitor Powder Revenue (million) Forecast, by Application 2020 & 2033
- Table 80: China Niobium Oxide Capacitor Powder Volume (K) Forecast, by Application 2020 & 2033
- Table 81: India Niobium Oxide Capacitor Powder Revenue (million) Forecast, by Application 2020 & 2033
- Table 82: India Niobium Oxide Capacitor Powder Volume (K) Forecast, by Application 2020 & 2033
- Table 83: Japan Niobium Oxide Capacitor Powder Revenue (million) Forecast, by Application 2020 & 2033
- Table 84: Japan Niobium Oxide Capacitor Powder Volume (K) Forecast, by Application 2020 & 2033
- Table 85: South Korea Niobium Oxide Capacitor Powder Revenue (million) Forecast, by Application 2020 & 2033
- Table 86: South Korea Niobium Oxide Capacitor Powder Volume (K) Forecast, by Application 2020 & 2033
- Table 87: ASEAN Niobium Oxide Capacitor Powder Revenue (million) Forecast, by Application 2020 & 2033
- Table 88: ASEAN Niobium Oxide Capacitor Powder Volume (K) Forecast, by Application 2020 & 2033
- Table 89: Oceania Niobium Oxide Capacitor Powder Revenue (million) Forecast, by Application 2020 & 2033
- Table 90: Oceania Niobium Oxide Capacitor Powder Volume (K) Forecast, by Application 2020 & 2033
- Table 91: Rest of Asia Pacific Niobium Oxide Capacitor Powder Revenue (million) Forecast, by Application 2020 & 2033
- Table 92: Rest of Asia Pacific Niobium Oxide Capacitor Powder Volume (K) Forecast, by Application 2020 & 2033
Frequently Asked Questions
1. What is the projected Compound Annual Growth Rate (CAGR) of the Niobium Oxide Capacitor Powder?
The projected CAGR is approximately 9.54%.
2. Which companies are prominent players in the Niobium Oxide Capacitor Powder?
Key companies in the market include TANIOBIS, Dongfang Tantalum Industry.
3. What are the main segments of the Niobium Oxide Capacitor Powder?
The market segments include Application, Type.
4. Can you provide details about the market size?
The market size is estimated to be USD 7015 million as of 2022.
5. What are some drivers contributing to market growth?
N/A
6. What are the notable trends driving market growth?
N/A
7. Are there any restraints impacting market growth?
N/A
8. Can you provide examples of recent developments in the market?
N/A
9. What pricing options are available for accessing the report?
Pricing options include single-user, multi-user, and enterprise licenses priced at USD 3950.00, USD 5925.00, and USD 7900.00 respectively.
10. Is the market size provided in terms of value or volume?
The market size is provided in terms of value, measured in million and volume, measured in K.
11. Are there any specific market keywords associated with the report?
Yes, the market keyword associated with the report is "Niobium Oxide Capacitor Powder," which aids in identifying and referencing the specific market segment covered.
12. How do I determine which pricing option suits my needs best?
The pricing options vary based on user requirements and access needs. Individual users may opt for single-user licenses, while businesses requiring broader access may choose multi-user or enterprise licenses for cost-effective access to the report.
13. Are there any additional resources or data provided in the Niobium Oxide Capacitor Powder report?
While the report offers comprehensive insights, it's advisable to review the specific contents or supplementary materials provided to ascertain if additional resources or data are available.
14. How can I stay updated on further developments or reports in the Niobium Oxide Capacitor Powder?
To stay informed about further developments, trends, and reports in the Niobium Oxide Capacitor Powder, consider subscribing to industry newsletters, following relevant companies and organizations, or regularly checking reputable industry news sources and publications.
Methodology
Step 1 - Identification of Relevant Samples Size from Population Database


Step 2 - Approaches for Defining Global Market Size (Value, Volume* & Price*)

Note*: In applicable scenarios
Step 3 - Data Sources
Primary Research
- Web Analytics
- Survey Reports
- Research Institute
- Latest Research Reports
- Opinion Leaders
Secondary Research
- Annual Reports
- White Paper
- Latest Press Release
- Industry Association
- Paid Database
- Investor Presentations

Step 4 - Data Triangulation
Involves using different sources of information in order to increase the validity of a study
These sources are likely to be stakeholders in a program - participants, other researchers, program staff, other community members, and so on.
Then we put all data in single framework & apply various statistical tools to find out the dynamic on the market.
During the analysis stage, feedback from the stakeholder groups would be compared to determine areas of agreement as well as areas of divergence

