

Key Insights
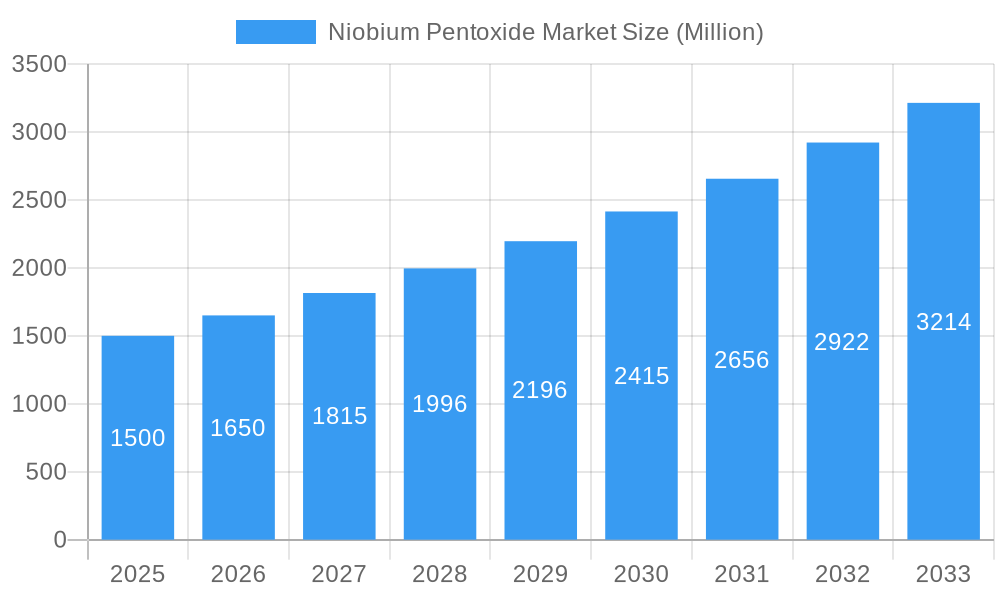
The Niobium Pentoxide market is experiencing robust growth, driven by increasing demand from key sectors like superalloys, supercapacitors, and optical glass manufacturing. The market's Compound Annual Growth Rate (CAGR) of 10.09% from 2019 to 2024 indicates significant expansion, projected to continue throughout the forecast period (2025-2033). This growth is fueled by technological advancements in these application areas, particularly the burgeoning renewable energy sector's reliance on supercapacitors for energy storage. The Asia-Pacific region, led by China and India, is expected to dominate the market due to rapid industrialization and increasing investments in infrastructure development. The high purity grades (4N and above) of niobium pentoxide are witnessing particularly strong demand, driven by their superior performance characteristics in high-tech applications. While supply chain constraints and price volatility of raw materials pose some challenges, the long-term outlook for the Niobium Pentoxide market remains positive, supported by consistent growth in its end-use industries and ongoing research and development efforts focused on enhancing its functionalities.
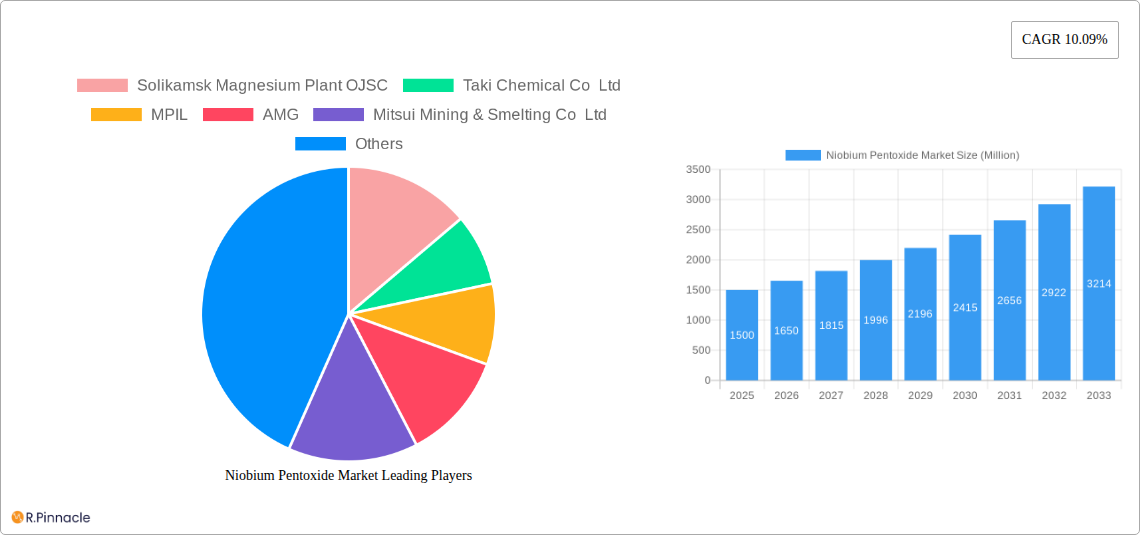
Niobium Pentoxide Market Market Size (In Billion)
The segmentation of the Niobium Pentoxide market by grade (3N, 4N, and others) and application (Niobium Metal, Optical Glass, Supercapacitors, Superalloys, Ceramics, and Others) provides valuable insights into market dynamics. Major players like Solikamsk Magnesium Plant OJSC, CBMM, and others are strategically positioning themselves to capitalize on this growth, focusing on research and development, strategic partnerships, and expanding production capacities to meet the increasing demand. Regional variations in market growth reflect differing levels of industrial development and economic growth. North America and Europe, while mature markets, still hold significant market share due to established manufacturing bases and technological advancements. However, emerging economies in the Asia-Pacific and South America regions are expected to show accelerated growth in the coming years. Competition within the market is moderate, characterized by a mix of large multinational corporations and smaller, specialized producers. This competitive landscape promotes innovation and ensures a consistent supply to meet global demand.
Niobium Pentoxide Market Company Market Share
Niobium Pentoxide Market: A Comprehensive Report (2019-2033)
This in-depth report provides a comprehensive analysis of the Niobium Pentoxide market, offering actionable insights for industry professionals, investors, and stakeholders. Covering the period from 2019 to 2033, with a focus on 2025, this report dissects market dynamics, key players, and future growth potential. The report leverages extensive data analysis and expert insights to provide a clear and concise overview of this dynamic market.
Niobium Pentoxide Market Structure & Innovation Trends
This section analyzes the competitive landscape of the Niobium Pentoxide market, examining market concentration, innovation drivers, regulatory frameworks, and key industry trends. The market is moderately concentrated, with several major players holding significant market share. However, the presence of smaller, specialized companies fosters innovation and competition.
- Market Concentration: The top 5 players hold approximately xx% of the global market share in 2025. This is expected to xx% by 2033.
- Innovation Drivers: Increasing demand from the supercapacitor and superalloy sectors, coupled with advancements in material science, are driving innovation.
- Regulatory Frameworks: Government regulations concerning environmental impact and resource management influence the industry's sustainability practices.
- Product Substitutes: Limited direct substitutes exist, but alternative materials are explored for specific applications, impacting market share.
- End-User Demographics: The primary end-users include manufacturers of superalloys, ceramics, and electronics, with demand heavily influenced by technological advancements in these sectors.
- M&A Activities: The past five years have witnessed xx major M&A deals, with an aggregate value of approximately USD xx Million. These activities are expected to continue, driven by the desire for increased market share and access to advanced technologies.
Niobium Pentoxide Market Dynamics & Trends
The Niobium Pentoxide market is experiencing robust growth, driven by several factors. The increasing adoption of niobium pentoxide in high-growth sectors, such as electric vehicles and renewable energy technologies, fuels market expansion. Technological advancements are streamlining production processes, improving product quality and efficiency, and lowering costs. Furthermore, evolving consumer preferences towards sustainable and high-performance materials contribute to market growth. The compound annual growth rate (CAGR) is projected at xx% during the forecast period (2025-2033), indicating substantial market expansion. Market penetration in key sectors, like supercapacitors, is anticipated to reach xx% by 2033. Competitive dynamics are characterized by ongoing innovation, strategic partnerships, and capacity expansions by leading players.
Dominant Regions & Segments in Niobium Pentoxide Market
The report identifies [Region Name] as the leading region in the Niobium Pentoxide market, accounting for xx% of global market share in 2025. This dominance is attributed to several factors:
- Key Drivers:
- Robust economic growth and infrastructure development.
- Favorable government policies supporting the adoption of advanced materials.
- High concentration of end-use industries.
- Dominance Analysis: [Region Name]'s strong industrial base, particularly in the [Specific Industry] sector, fuels high demand for Niobium Pentoxide. Furthermore, government initiatives promoting technological advancements in key industries further solidify its position as a dominant market.
Within the segments, the Industrial Grade (purity: 4N) segment holds the largest market share, driven by high demand from the superalloy industry. The Superalloy application segment also shows significant growth potential, driven by increasing demand from the aerospace and automotive sectors.
Niobium Pentoxide Market Product Innovations
Recent innovations focus on enhancing the purity and consistency of Niobium Pentoxide to meet the demanding requirements of high-tech applications. New production processes are being developed to improve efficiency and reduce environmental impact. Companies are also exploring new applications for Niobium Pentoxide, such as in advanced energy storage devices and specialized coatings. These advancements are contributing to a more competitive and dynamic market.
Report Scope & Segmentation Analysis
This report segments the Niobium Pentoxide market by Grade (Industrial Grade: 3N, 4N) and Application (Niobium Metal, Optical Glass, Supercapacitors, Superalloys, Ceramics, Other Applications). Each segment is analyzed based on market size, growth rate, and competitive landscape. Growth projections for each segment are provided for the forecast period (2025-2033). Competitive dynamics within each segment are analyzed, highlighting key players and their strategies.
Key Drivers of Niobium Pentoxide Market Growth
Several key factors fuel the growth of the Niobium Pentoxide market:
- Technological Advancements: Innovations in material science and manufacturing processes are enhancing the performance and reducing the cost of Niobium Pentoxide.
- Economic Growth: The expanding global economy, particularly in developing countries, drives demand for high-performance materials used in various industrial applications.
- Stringent Environmental Regulations: Governments' push for cleaner energy technologies and sustainable industrial practices boosts the adoption of Niobium Pentoxide in environmentally friendly products.
Challenges in the Niobium Pentoxide Market Sector
Despite its growth potential, the Niobium Pentoxide market faces several challenges:
- Supply Chain Disruptions: Geopolitical uncertainties and resource limitations can disrupt the supply chain, affecting production and pricing.
- Price Volatility: Fluctuations in raw material prices impact profitability and investment decisions.
- Intense Competition: The market is witnessing increasing competition among established players and new entrants, creating price pressures.
Emerging Opportunities in Niobium Pentoxide Market
The Niobium Pentoxide market presents exciting opportunities:
- Growing Demand from Emerging Applications: The increasing adoption of Niobium Pentoxide in electric vehicles, renewable energy technologies, and other emerging sectors creates significant growth opportunities.
- Technological Advancements: Continuous innovations in material science and manufacturing technologies are opening up new application areas and enhancing the competitiveness of Niobium Pentoxide.
- Strategic Partnerships & Collaborations: Collaborations between producers and end-users create synergistic opportunities for market expansion and innovation.
Leading Players in the Niobium Pentoxide Market Market
- Solikamsk Magnesium Plant OJSC
- Taki Chemical Co Ltd
- MPIL
- AMG
- Mitsui Mining & Smelting Co Ltd
- JX Nippon Mining & Metals Corporation
- F&X Electro-Materials Limited
- King-Tan Tantalum Industry Ltd
- XIMEI Resources Holding Limited
- CBMM
Key Developments in Niobium Pentoxide Market Industry
- December 2022: CBMM announced an USD 80 Million investment to expand niobium oxide capacity from 500 tons to 3,000 tons by 2024, aiming for 40,000 tons by 2030. A collaboration with Echion Technologies will establish a new facility in Brazil.
- March 2022: CBMM partnered with Horwin Brasil, investing ~USD 13.8 Million to integrate niobium into lithium-ion batteries for electric motorcycles, aiming for 50,000 tons of niobium oxide sales by 2030.
Future Outlook for Niobium Pentoxide Market Market
The Niobium Pentoxide market is poised for significant growth, driven by the increasing demand from high-growth sectors. Continued technological advancements, coupled with supportive government policies and strategic partnerships, will further propel market expansion. The market presents attractive opportunities for both established players and new entrants seeking to capitalize on this dynamic and evolving industry.
Niobium Pentoxide Market Segmentation
-
1. Grade
- 1.1. Industrial Grade (purity: 99.0% to 99.8%)
- 1.2. 3N
- 1.3. 4N
-
2. Application
- 2.1. Niobium Metal
- 2.2. Optical Glass
- 2.3. Supercapacitors
- 2.4. Superalloys
- 2.5. Ceramics
- 2.6. Other Applications
Niobium Pentoxide Market Segmentation By Geography
-
1. Asia Pacific
- 1.1. China
- 1.2. India
- 1.3. Japan
- 1.4. South Korea
- 1.5. Rest of Asia Pacific
-
2. North America
- 2.1. United States
- 2.2. Canada
- 2.3. Mexico
-
3. Europe
- 3.1. Germany
- 3.2. United Kingdom
- 3.3. France
- 3.4. Italy
- 3.5. Rest of Europe
-
4. South America
- 4.1. Brazil
- 4.2. Argentina
- 4.3. Rest of South America
-
5. Middle East and Africa
- 5.1. Saudi Arabia
- 5.2. South Africa
- 5.3. Rest of Middle East and Africa
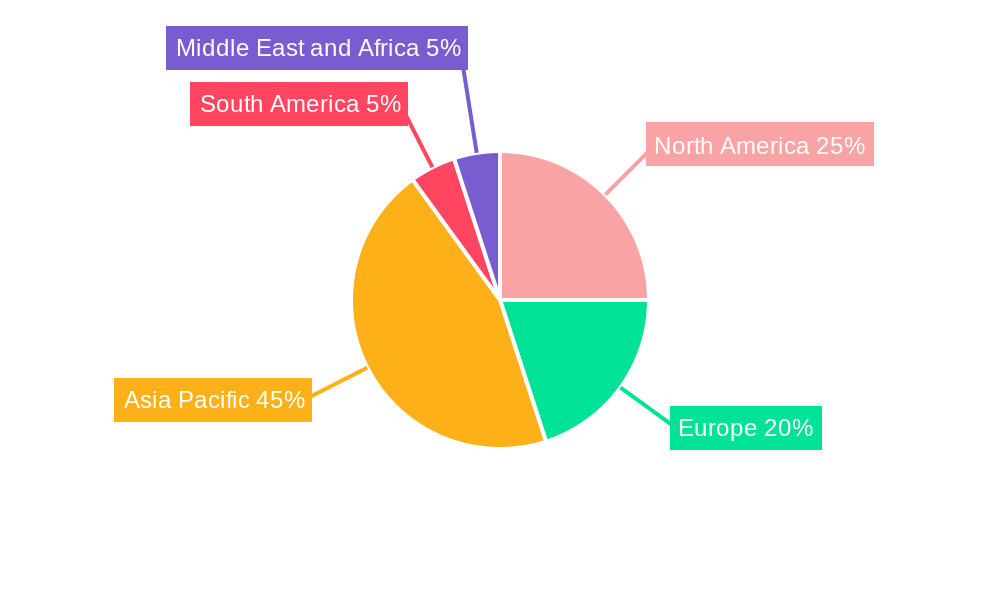
Niobium Pentoxide Market Regional Market Share
Geographic Coverage of Niobium Pentoxide Market
Niobium Pentoxide Market REPORT HIGHLIGHTS
| Aspects | Details |
|---|---|
| Study Period | 2020-2034 |
| Base Year | 2025 |
| Estimated Year | 2026 |
| Forecast Period | 2026-2034 |
| Historical Period | 2020-2025 |
| Growth Rate | CAGR of 5.6% from 2020-2034 |
| Segmentation |
|
Table of Contents
- 1. Introduction
- 1.1. Research Scope
- 1.2. Market Segmentation
- 1.3. Research Objective
- 1.4. Definitions and Assumptions
- 2. Executive Summary
- 2.1. Market Snapshot
- 3. Market Dynamics
- 3.1. Market Drivers
- 3.2. Market Restrains
- 3.3. Market Trends
- 3.4. Market Opportunities
- 4. Market Factor Analysis
- 4.1. Porters Five Forces
- 4.1.1. Bargaining Power of Suppliers
- 4.1.2. Bargaining Power of Buyers
- 4.1.3. Threat of New Entrants
- 4.1.4. Threat of Substitutes
- 4.1.5. Competitive Rivalry
- 4.2. PESTEL analysis
- 4.3. BCG Analysis
- 4.3.1. Stars (High Growth, High Market Share)
- 4.3.2. Cash Cows (Low Growth, High Market Share)
- 4.3.3. Question Mark (High Growth, Low Market Share)
- 4.3.4. Dogs (Low Growth, Low Market Share)
- 4.4. Ansoff Matrix Analysis
- 4.5. Supply Chain Analysis
- 4.6. Regulatory Landscape
- 4.7. Current Market Potential and Opportunity Assessment (TAM–SAM–SOM Framework)
- 4.8. PRI Analyst Note
- 4.1. Porters Five Forces
- 5. Market Analysis, Insights and Forecast 2021-2033
- 5.1. Market Analysis, Insights and Forecast - by Grade
- 5.1.1. Industrial Grade (purity: 99.0% to 99.8%)
- 5.1.2. 3N
- 5.1.3. 4N
- 5.2. Market Analysis, Insights and Forecast - by Application
- 5.2.1. Niobium Metal
- 5.2.2. Optical Glass
- 5.2.3. Supercapacitors
- 5.2.4. Superalloys
- 5.2.5. Ceramics
- 5.2.6. Other Applications
- 5.3. Market Analysis, Insights and Forecast - by Region
- 5.3.1. Asia Pacific
- 5.3.2. North America
- 5.3.3. Europe
- 5.3.4. South America
- 5.3.5. Middle East and Africa
- 5.1. Market Analysis, Insights and Forecast - by Grade
- 6. Global Niobium Pentoxide Market Analysis, Insights and Forecast, 2021-2033
- 6.1. Market Analysis, Insights and Forecast - by Grade
- 6.1.1. Industrial Grade (purity: 99.0% to 99.8%)
- 6.1.2. 3N
- 6.1.3. 4N
- 6.2. Market Analysis, Insights and Forecast - by Application
- 6.2.1. Niobium Metal
- 6.2.2. Optical Glass
- 6.2.3. Supercapacitors
- 6.2.4. Superalloys
- 6.2.5. Ceramics
- 6.2.6. Other Applications
- 6.1. Market Analysis, Insights and Forecast - by Grade
- 7. Asia Pacific Niobium Pentoxide Market Analysis, Insights and Forecast, 2020-2032
- 7.1. Market Analysis, Insights and Forecast - by Grade
- 7.1.1. Industrial Grade (purity: 99.0% to 99.8%)
- 7.1.2. 3N
- 7.1.3. 4N
- 7.2. Market Analysis, Insights and Forecast - by Application
- 7.2.1. Niobium Metal
- 7.2.2. Optical Glass
- 7.2.3. Supercapacitors
- 7.2.4. Superalloys
- 7.2.5. Ceramics
- 7.2.6. Other Applications
- 7.1. Market Analysis, Insights and Forecast - by Grade
- 8. North America Niobium Pentoxide Market Analysis, Insights and Forecast, 2020-2032
- 8.1. Market Analysis, Insights and Forecast - by Grade
- 8.1.1. Industrial Grade (purity: 99.0% to 99.8%)
- 8.1.2. 3N
- 8.1.3. 4N
- 8.2. Market Analysis, Insights and Forecast - by Application
- 8.2.1. Niobium Metal
- 8.2.2. Optical Glass
- 8.2.3. Supercapacitors
- 8.2.4. Superalloys
- 8.2.5. Ceramics
- 8.2.6. Other Applications
- 8.1. Market Analysis, Insights and Forecast - by Grade
- 9. Europe Niobium Pentoxide Market Analysis, Insights and Forecast, 2020-2032
- 9.1. Market Analysis, Insights and Forecast - by Grade
- 9.1.1. Industrial Grade (purity: 99.0% to 99.8%)
- 9.1.2. 3N
- 9.1.3. 4N
- 9.2. Market Analysis, Insights and Forecast - by Application
- 9.2.1. Niobium Metal
- 9.2.2. Optical Glass
- 9.2.3. Supercapacitors
- 9.2.4. Superalloys
- 9.2.5. Ceramics
- 9.2.6. Other Applications
- 9.1. Market Analysis, Insights and Forecast - by Grade
- 10. South America Niobium Pentoxide Market Analysis, Insights and Forecast, 2020-2032
- 10.1. Market Analysis, Insights and Forecast - by Grade
- 10.1.1. Industrial Grade (purity: 99.0% to 99.8%)
- 10.1.2. 3N
- 10.1.3. 4N
- 10.2. Market Analysis, Insights and Forecast - by Application
- 10.2.1. Niobium Metal
- 10.2.2. Optical Glass
- 10.2.3. Supercapacitors
- 10.2.4. Superalloys
- 10.2.5. Ceramics
- 10.2.6. Other Applications
- 10.1. Market Analysis, Insights and Forecast - by Grade
- 11. Middle East and Africa Niobium Pentoxide Market Analysis, Insights and Forecast, 2020-2032
- 11.1. Market Analysis, Insights and Forecast - by Grade
- 11.1.1. Industrial Grade (purity: 99.0% to 99.8%)
- 11.1.2. 3N
- 11.1.3. 4N
- 11.2. Market Analysis, Insights and Forecast - by Application
- 11.2.1. Niobium Metal
- 11.2.2. Optical Glass
- 11.2.3. Supercapacitors
- 11.2.4. Superalloys
- 11.2.5. Ceramics
- 11.2.6. Other Applications
- 11.1. Market Analysis, Insights and Forecast - by Grade
- 12. Competitive Analysis
- 12.1. Company Profiles
- 12.1.1 Solikamsk Magnesium Plant OJSC
- 12.1.1.1. Company Overview
- 12.1.1.2. Products
- 12.1.1.3. Company Financials
- 12.1.1.4. SWOT Analysis
- 12.1.2 Taki Chemical Co Ltd
- 12.1.2.1. Company Overview
- 12.1.2.2. Products
- 12.1.2.3. Company Financials
- 12.1.2.4. SWOT Analysis
- 12.1.3 MPIL
- 12.1.3.1. Company Overview
- 12.1.3.2. Products
- 12.1.3.3. Company Financials
- 12.1.3.4. SWOT Analysis
- 12.1.4 AMG
- 12.1.4.1. Company Overview
- 12.1.4.2. Products
- 12.1.4.3. Company Financials
- 12.1.4.4. SWOT Analysis
- 12.1.5 Mitsui Mining & Smelting Co Ltd
- 12.1.5.1. Company Overview
- 12.1.5.2. Products
- 12.1.5.3. Company Financials
- 12.1.5.4. SWOT Analysis
- 12.1.6 JX Nippon Mining & Metals Corporation
- 12.1.6.1. Company Overview
- 12.1.6.2. Products
- 12.1.6.3. Company Financials
- 12.1.6.4. SWOT Analysis
- 12.1.7 F&X Electro-Materials Limited
- 12.1.7.1. Company Overview
- 12.1.7.2. Products
- 12.1.7.3. Company Financials
- 12.1.7.4. SWOT Analysis
- 12.1.8 King-Tan Tantalum Industry Ltd
- 12.1.8.1. Company Overview
- 12.1.8.2. Products
- 12.1.8.3. Company Financials
- 12.1.8.4. SWOT Analysis
- 12.1.9 XIMEI Resources Holding Limited*List Not Exhaustive
- 12.1.9.1. Company Overview
- 12.1.9.2. Products
- 12.1.9.3. Company Financials
- 12.1.9.4. SWOT Analysis
- 12.1.10 CBMM
- 12.1.10.1. Company Overview
- 12.1.10.2. Products
- 12.1.10.3. Company Financials
- 12.1.10.4. SWOT Analysis
- 12.1.1 Solikamsk Magnesium Plant OJSC
- 12.2. Market Entropy
- 12.2.1 Company's Key Areas Served
- 12.2.2 Recent Developments
- 12.3. Company Market Share Analysis 2025
- 12.3.1 Top 5 Companies Market Share Analysis
- 12.3.2 Top 3 Companies Market Share Analysis
- 12.4. List of Potential Customers
- 13. Research Methodology
List of Figures
- Figure 1: Global Niobium Pentoxide Market Revenue Breakdown (million, %) by Region 2025 & 2033
- Figure 2: Asia Pacific Niobium Pentoxide Market Revenue (million), by Grade 2025 & 2033
- Figure 3: Asia Pacific Niobium Pentoxide Market Revenue Share (%), by Grade 2025 & 2033
- Figure 4: Asia Pacific Niobium Pentoxide Market Revenue (million), by Application 2025 & 2033
- Figure 5: Asia Pacific Niobium Pentoxide Market Revenue Share (%), by Application 2025 & 2033
- Figure 6: Asia Pacific Niobium Pentoxide Market Revenue (million), by Country 2025 & 2033
- Figure 7: Asia Pacific Niobium Pentoxide Market Revenue Share (%), by Country 2025 & 2033
- Figure 8: North America Niobium Pentoxide Market Revenue (million), by Grade 2025 & 2033
- Figure 9: North America Niobium Pentoxide Market Revenue Share (%), by Grade 2025 & 2033
- Figure 10: North America Niobium Pentoxide Market Revenue (million), by Application 2025 & 2033
- Figure 11: North America Niobium Pentoxide Market Revenue Share (%), by Application 2025 & 2033
- Figure 12: North America Niobium Pentoxide Market Revenue (million), by Country 2025 & 2033
- Figure 13: North America Niobium Pentoxide Market Revenue Share (%), by Country 2025 & 2033
- Figure 14: Europe Niobium Pentoxide Market Revenue (million), by Grade 2025 & 2033
- Figure 15: Europe Niobium Pentoxide Market Revenue Share (%), by Grade 2025 & 2033
- Figure 16: Europe Niobium Pentoxide Market Revenue (million), by Application 2025 & 2033
- Figure 17: Europe Niobium Pentoxide Market Revenue Share (%), by Application 2025 & 2033
- Figure 18: Europe Niobium Pentoxide Market Revenue (million), by Country 2025 & 2033
- Figure 19: Europe Niobium Pentoxide Market Revenue Share (%), by Country 2025 & 2033
- Figure 20: South America Niobium Pentoxide Market Revenue (million), by Grade 2025 & 2033
- Figure 21: South America Niobium Pentoxide Market Revenue Share (%), by Grade 2025 & 2033
- Figure 22: South America Niobium Pentoxide Market Revenue (million), by Application 2025 & 2033
- Figure 23: South America Niobium Pentoxide Market Revenue Share (%), by Application 2025 & 2033
- Figure 24: South America Niobium Pentoxide Market Revenue (million), by Country 2025 & 2033
- Figure 25: South America Niobium Pentoxide Market Revenue Share (%), by Country 2025 & 2033
- Figure 26: Middle East and Africa Niobium Pentoxide Market Revenue (million), by Grade 2025 & 2033
- Figure 27: Middle East and Africa Niobium Pentoxide Market Revenue Share (%), by Grade 2025 & 2033
- Figure 28: Middle East and Africa Niobium Pentoxide Market Revenue (million), by Application 2025 & 2033
- Figure 29: Middle East and Africa Niobium Pentoxide Market Revenue Share (%), by Application 2025 & 2033
- Figure 30: Middle East and Africa Niobium Pentoxide Market Revenue (million), by Country 2025 & 2033
- Figure 31: Middle East and Africa Niobium Pentoxide Market Revenue Share (%), by Country 2025 & 2033
List of Tables
- Table 1: Global Niobium Pentoxide Market Revenue million Forecast, by Grade 2020 & 2033
- Table 2: Global Niobium Pentoxide Market Revenue million Forecast, by Application 2020 & 2033
- Table 3: Global Niobium Pentoxide Market Revenue million Forecast, by Region 2020 & 2033
- Table 4: Global Niobium Pentoxide Market Revenue million Forecast, by Grade 2020 & 2033
- Table 5: Global Niobium Pentoxide Market Revenue million Forecast, by Application 2020 & 2033
- Table 6: Global Niobium Pentoxide Market Revenue million Forecast, by Country 2020 & 2033
- Table 7: China Niobium Pentoxide Market Revenue (million) Forecast, by Application 2020 & 2033
- Table 8: India Niobium Pentoxide Market Revenue (million) Forecast, by Application 2020 & 2033
- Table 9: Japan Niobium Pentoxide Market Revenue (million) Forecast, by Application 2020 & 2033
- Table 10: South Korea Niobium Pentoxide Market Revenue (million) Forecast, by Application 2020 & 2033
- Table 11: Rest of Asia Pacific Niobium Pentoxide Market Revenue (million) Forecast, by Application 2020 & 2033
- Table 12: Global Niobium Pentoxide Market Revenue million Forecast, by Grade 2020 & 2033
- Table 13: Global Niobium Pentoxide Market Revenue million Forecast, by Application 2020 & 2033
- Table 14: Global Niobium Pentoxide Market Revenue million Forecast, by Country 2020 & 2033
- Table 15: United States Niobium Pentoxide Market Revenue (million) Forecast, by Application 2020 & 2033
- Table 16: Canada Niobium Pentoxide Market Revenue (million) Forecast, by Application 2020 & 2033
- Table 17: Mexico Niobium Pentoxide Market Revenue (million) Forecast, by Application 2020 & 2033
- Table 18: Global Niobium Pentoxide Market Revenue million Forecast, by Grade 2020 & 2033
- Table 19: Global Niobium Pentoxide Market Revenue million Forecast, by Application 2020 & 2033
- Table 20: Global Niobium Pentoxide Market Revenue million Forecast, by Country 2020 & 2033
- Table 21: Germany Niobium Pentoxide Market Revenue (million) Forecast, by Application 2020 & 2033
- Table 22: United Kingdom Niobium Pentoxide Market Revenue (million) Forecast, by Application 2020 & 2033
- Table 23: France Niobium Pentoxide Market Revenue (million) Forecast, by Application 2020 & 2033
- Table 24: Italy Niobium Pentoxide Market Revenue (million) Forecast, by Application 2020 & 2033
- Table 25: Rest of Europe Niobium Pentoxide Market Revenue (million) Forecast, by Application 2020 & 2033
- Table 26: Global Niobium Pentoxide Market Revenue million Forecast, by Grade 2020 & 2033
- Table 27: Global Niobium Pentoxide Market Revenue million Forecast, by Application 2020 & 2033
- Table 28: Global Niobium Pentoxide Market Revenue million Forecast, by Country 2020 & 2033
- Table 29: Brazil Niobium Pentoxide Market Revenue (million) Forecast, by Application 2020 & 2033
- Table 30: Argentina Niobium Pentoxide Market Revenue (million) Forecast, by Application 2020 & 2033
- Table 31: Rest of South America Niobium Pentoxide Market Revenue (million) Forecast, by Application 2020 & 2033
- Table 32: Global Niobium Pentoxide Market Revenue million Forecast, by Grade 2020 & 2033
- Table 33: Global Niobium Pentoxide Market Revenue million Forecast, by Application 2020 & 2033
- Table 34: Global Niobium Pentoxide Market Revenue million Forecast, by Country 2020 & 2033
- Table 35: Saudi Arabia Niobium Pentoxide Market Revenue (million) Forecast, by Application 2020 & 2033
- Table 36: South Africa Niobium Pentoxide Market Revenue (million) Forecast, by Application 2020 & 2033
- Table 37: Rest of Middle East and Africa Niobium Pentoxide Market Revenue (million) Forecast, by Application 2020 & 2033
Frequently Asked Questions
1. What is the projected Compound Annual Growth Rate (CAGR) of the Niobium Pentoxide Market?
The projected CAGR is approximately 5.6%.
2. Which companies are prominent players in the Niobium Pentoxide Market?
Key companies in the market include Solikamsk Magnesium Plant OJSC, Taki Chemical Co Ltd, MPIL, AMG, Mitsui Mining & Smelting Co Ltd, JX Nippon Mining & Metals Corporation, F&X Electro-Materials Limited, King-Tan Tantalum Industry Ltd, XIMEI Resources Holding Limited*List Not Exhaustive, CBMM.
3. What are the main segments of the Niobium Pentoxide Market?
The market segments include Grade, Application.
4. Can you provide details about the market size?
The market size is estimated to be USD 270.2 million as of 2022.
5. What are some drivers contributing to market growth?
Growing Demand from the Electric Vehicles Segment; Growing Demand for High-Quality Steel from the Manufacturing Sector.
6. What are the notable trends driving market growth?
Increasing Usage in the Production of Niobium Metal.
7. Are there any restraints impacting market growth?
Concerns About Health Issues on Acute Exposure.
8. Can you provide examples of recent developments in the market?
December 2022: CBMM announced a USD 80 million investment to expand niobium oxide capacity from 500 tons to 3,000 tons by 2024. Through a collaboration with Echion Technologies, CBMM plans to establish a niobium oxide facility at its Araxá plant in Minas Gerais, Brazil, aligning with its goal of achieving a niobium oxide capacity of 40,000 t by 2030.
9. What pricing options are available for accessing the report?
Pricing options include single-user, multi-user, and enterprise licenses priced at USD 4750, USD 5250, and USD 8750 respectively.
10. Is the market size provided in terms of value or volume?
The market size is provided in terms of value, measured in million.
11. Are there any specific market keywords associated with the report?
Yes, the market keyword associated with the report is "Niobium Pentoxide Market," which aids in identifying and referencing the specific market segment covered.
12. How do I determine which pricing option suits my needs best?
The pricing options vary based on user requirements and access needs. Individual users may opt for single-user licenses, while businesses requiring broader access may choose multi-user or enterprise licenses for cost-effective access to the report.
13. Are there any additional resources or data provided in the Niobium Pentoxide Market report?
While the report offers comprehensive insights, it's advisable to review the specific contents or supplementary materials provided to ascertain if additional resources or data are available.
14. How can I stay updated on further developments or reports in the Niobium Pentoxide Market?
To stay informed about further developments, trends, and reports in the Niobium Pentoxide Market, consider subscribing to industry newsletters, following relevant companies and organizations, or regularly checking reputable industry news sources and publications.
Methodology
Step 1 - Identification of Relevant Samples Size from Population Database


Step 2 - Approaches for Defining Global Market Size (Value, Volume* & Price*)

Note*: In applicable scenarios
Step 3 - Data Sources
Primary Research
- Web Analytics
- Survey Reports
- Research Institute
- Latest Research Reports
- Opinion Leaders
Secondary Research
- Annual Reports
- White Paper
- Latest Press Release
- Industry Association
- Paid Database
- Investor Presentations

Step 4 - Data Triangulation
Involves using different sources of information in order to increase the validity of a study
These sources are likely to be stakeholders in a program - participants, other researchers, program staff, other community members, and so on.
Then we put all data in single framework & apply various statistical tools to find out the dynamic on the market.
During the analysis stage, feedback from the stakeholder groups would be compared to determine areas of agreement as well as areas of divergence