

Key Insights
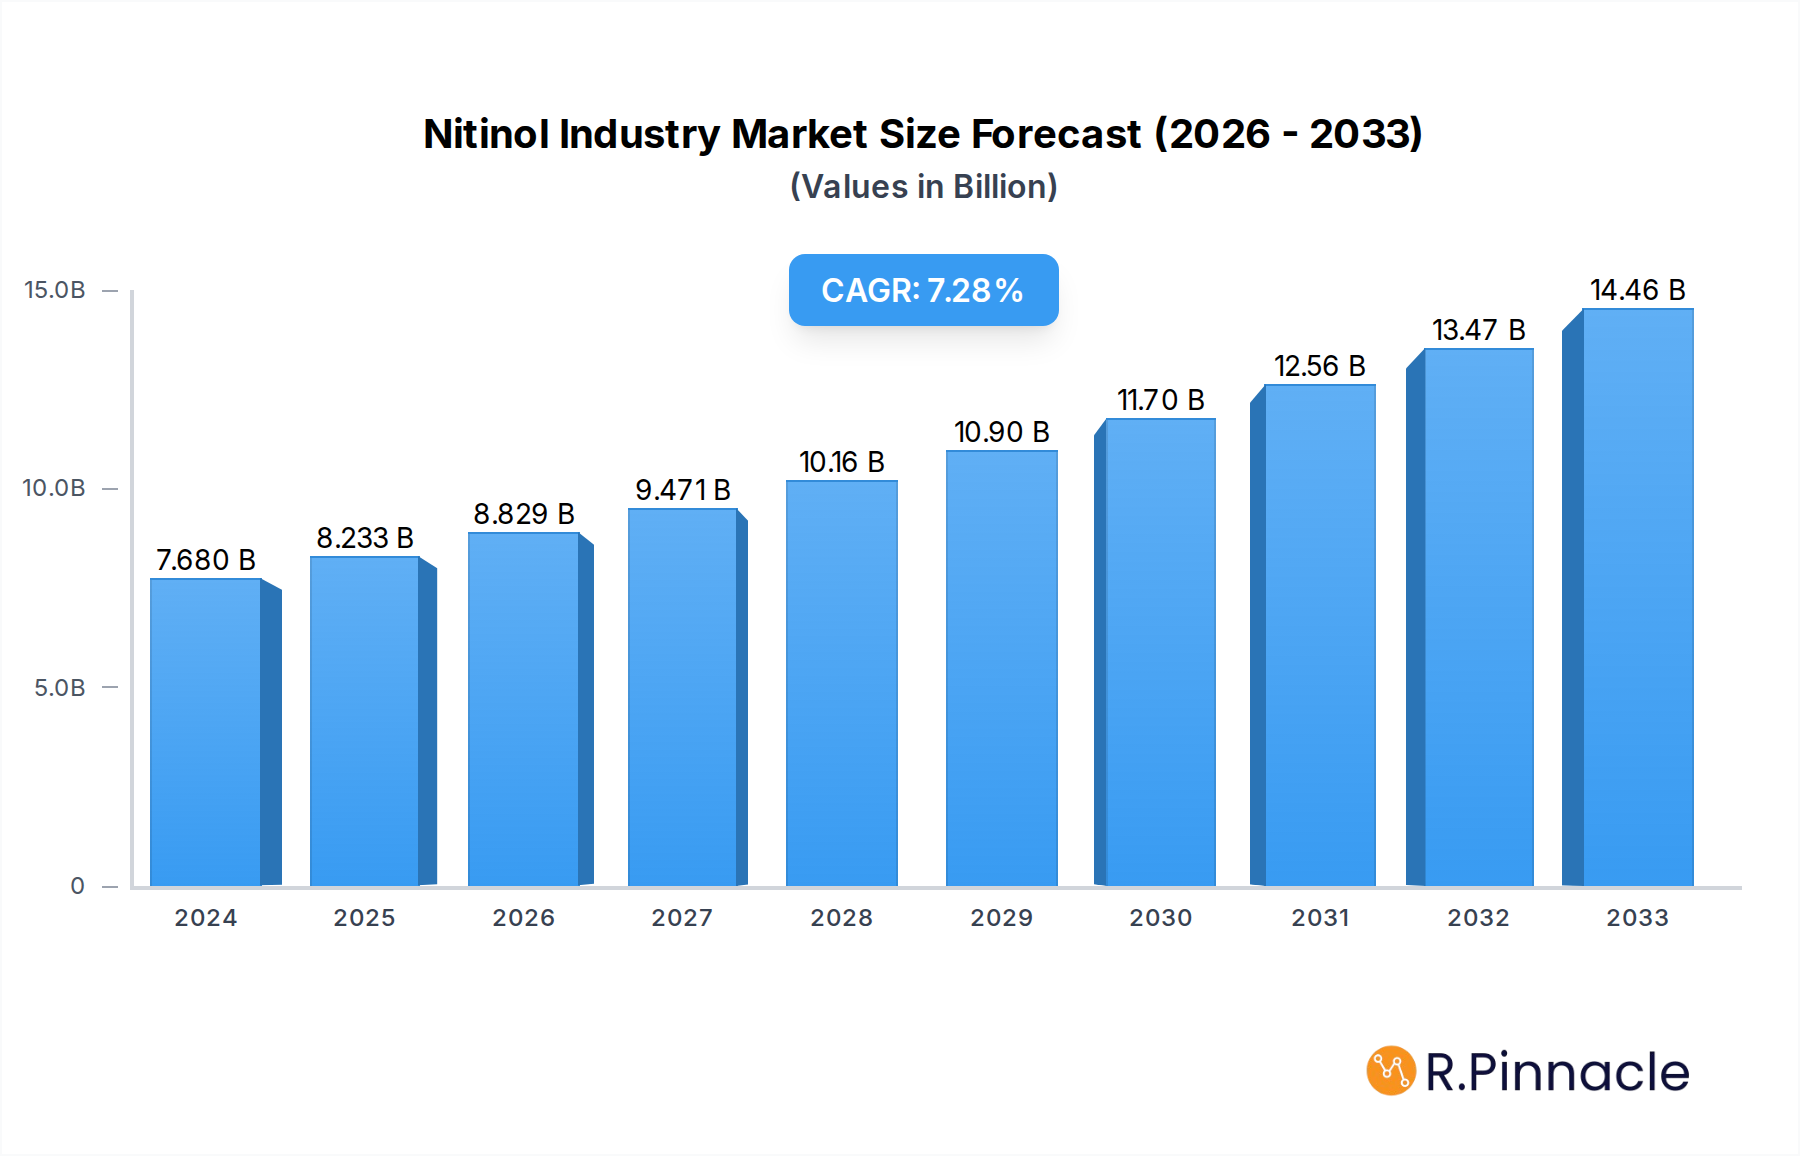
The Nitinol market is poised for significant expansion, projected to reach a robust USD 7.68 billion in 2024. This growth is fueled by an impressive Compound Annual Growth Rate (CAGR) of 7.1% through 2033, indicating sustained demand and innovation within the industry. Key drivers for this upward trajectory include the increasing prevalence of chronic diseases requiring advanced medical devices, a growing elderly population, and continuous advancements in the material properties and applications of Nitinol. The material's unique superelasticity and shape memory properties make it indispensable in a wide array of minimally invasive medical procedures, particularly in cardiovascular and urological interventions. Furthermore, the expanding use of Nitinol in less traditional sectors like aerospace and consumer electronics also contributes to its market dominance.

Nitinol Industry Market Size (In Billion)
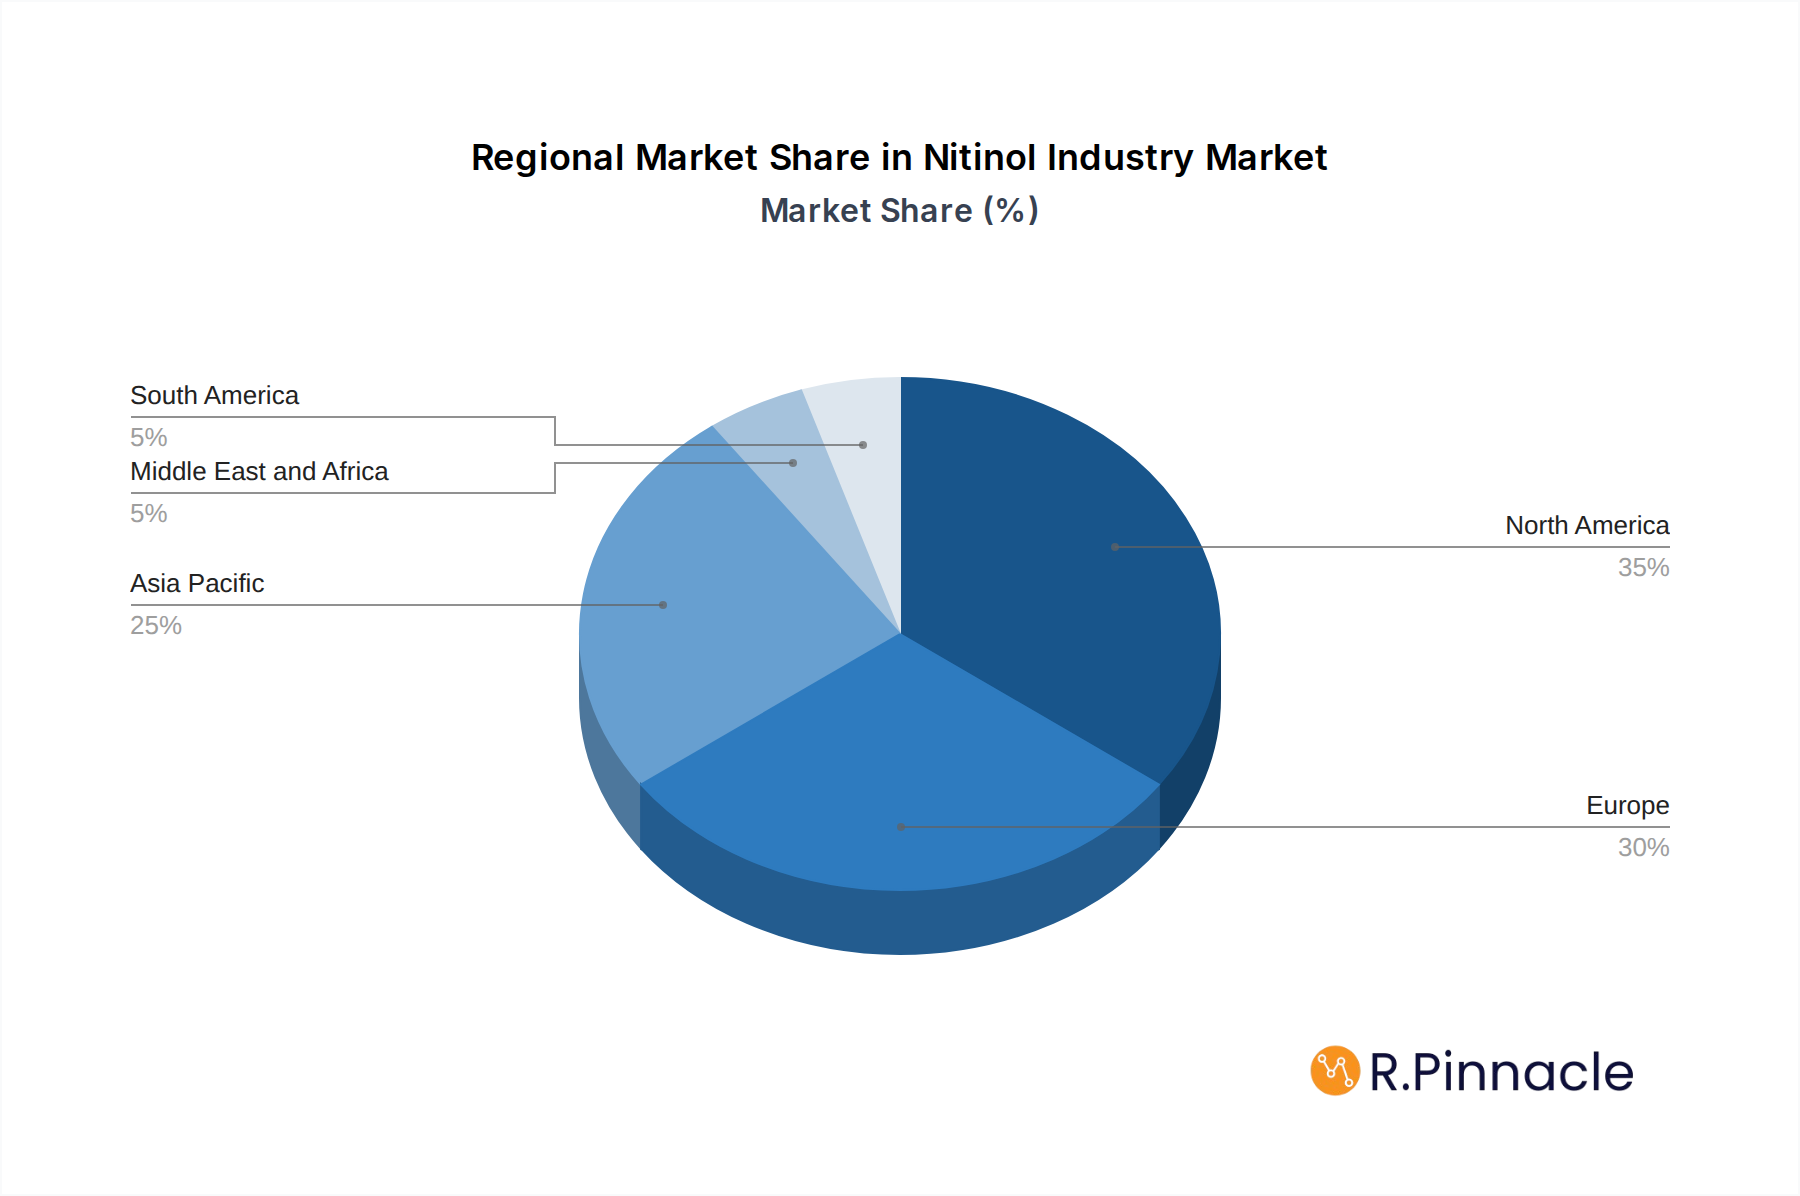
The market is segmented into product types including stents, baskets, guidewires, and other specialized products, with stents and guidewires currently leading in adoption due to their critical role in interventional cardiology and peripheral vascular procedures. Geographically, North America and Europe are established leaders, driven by high healthcare expenditure and advanced medical infrastructure. However, the Asia Pacific region is emerging as a rapid growth market, propelled by increasing healthcare investments, a burgeoning middle class, and a rising incidence of lifestyle-related diseases. While strong growth is anticipated, potential restraints such as the high cost of raw materials and stringent regulatory approvals for new Nitinol-based devices may present challenges. Nevertheless, ongoing research and development efforts are focused on cost optimization and expanding the application scope, ensuring a dynamic and evolving Nitinol market landscape.
Nitinol Industry Company Market Share
This in-depth report provides a comprehensive analysis of the global Nitinol industry, offering critical insights into market dynamics, innovation trends, growth drivers, and future outlook. Leveraging extensive market research and proprietary data, this report is an indispensable resource for industry professionals, investors, and stakeholders seeking to understand the evolving landscape of nitinol applications. With a study period spanning from 2019 to 2033, and a base year of 2025, this report delivers actionable intelligence for strategic decision-making. The market size is projected to reach over one billion dollars by 2033.
Nitinol Industry Market Structure & Innovation Trends
The Nitinol industry exhibits a moderately concentrated market structure, driven by specialized manufacturing capabilities and high R&D investment. Innovation in nitinol alloys, focusing on enhanced biocompatibility, superelasticity, and fatigue resistance, serves as a primary growth catalyst. Regulatory frameworks, particularly stringent approvals for medical devices, significantly influence market entry and product development. While direct product substitutes are limited due to nitinol's unique properties, advancements in alternative materials for specific applications may pose indirect competition. End-user demographics are heavily skewed towards healthcare providers and medical device manufacturers, with an increasing demand from interventional cardiology and minimally invasive surgery. Mergers and acquisitions (M&A) activities are on the rise, signaling consolidation and strategic expansion, with deal values often in the hundreds of millions of dollars. For instance, the acquisition of Endosmart by Alleima in November 2022 underscored the strategic importance of specialized nitinol component manufacturers.
- Market Concentration: Moderate, with key players holding significant market share.
- Innovation Drivers: Enhanced alloy properties, new application development, process optimization.
- Regulatory Frameworks: FDA, CE Mark, and other regional medical device regulations.
- Product Substitutes: Limited direct substitutes, but ongoing material science research.
- End-User Demographics: Primarily medical device manufacturers, hospitals, and research institutions.
- M&A Activities: Increasing consolidation, strategic acquisitions to gain market share and technological expertise.
Nitinol Industry Market Dynamics & Trends
The Nitinol industry is experiencing robust growth, propelled by an escalating demand for advanced medical devices, particularly in minimally invasive surgical procedures. The inherent properties of nitinol, such as its superelasticity, shape memory effect, and high biocompatibility, make it an ideal material for a wide array of critical medical implants and instruments. The global market penetration of nitinol-based devices is steadily increasing, driven by favorable clinical outcomes and a growing patient preference for less invasive treatments. Technological disruptions are continuously shaping the industry, with ongoing research and development focused on refining nitinol alloy compositions, improving manufacturing processes, and expanding its application spectrum. Consumer preferences, in this context, translate to a strong demand for safer, more effective, and less traumatic medical interventions, which nitinol-based solutions are well-positioned to deliver. The competitive dynamics are characterized by a blend of established players and emerging innovators, all vying for market share through product differentiation, strategic partnerships, and continuous technological advancement. The compound annual growth rate (CAGR) for the Nitinol industry is projected to be in the high single digits throughout the forecast period.
Key market growth drivers include:
- Increasing prevalence of chronic diseases: Conditions like cardiovascular diseases and cancer necessitate advanced treatment solutions.
- Growing adoption of minimally invasive procedures: Nitinol's flexibility and biocompatibility are crucial for these techniques.
- Technological advancements in alloy production: Leading to improved material properties and cost-effectiveness.
- Rising healthcare expenditure globally: Enabling greater access to sophisticated medical technologies.
- Aging global population: Leading to a higher demand for medical devices and treatments.
The market penetration of nitinol in key applications such as cardiovascular stents and urology devices continues to expand, indicating strong market acceptance and confidence in the material's capabilities.
Dominant Regions & Segments in Nitinol Industry
North America currently dominates the Nitinol industry, driven by a sophisticated healthcare infrastructure, high per capita healthcare spending, and a strong presence of leading medical device manufacturers like Boston Scientific Corporation and Becton Dickinson & Company. The region's robust research and development ecosystem fosters continuous innovation in nitinol applications. The United States, in particular, is a key market, accounting for a significant portion of global nitinol consumption.
Product Type Dominance:
- Stents: This segment holds the largest market share due to the widespread use of nitinol stents in cardiovascular and peripheral vascular interventions. The demand is fueled by the rising incidence of cardiovascular diseases and the ongoing shift towards less invasive treatment options. Companies like Cook Medical and Terumo Corporation are major contributors to this segment.
- Guidewires: Precision and flexibility are paramount in guidewires used in interventional procedures, making nitinol an ideal material. The increasing complexity of interventional cardiology and neurovascular interventions further boosts demand.
- Baskets: Primarily utilized in urology for stone retrieval and in other interventional procedures, the basket segment is experiencing steady growth. The acquisition of Endosmart, a specialist in kidney stone retrieval baskets, by Alleima highlights the strategic importance of this product type.
- Other Products: This encompasses a diverse range of applications, including surgical instruments, orthodontic devices, and active implants, showcasing the versatility of nitinol.
Application Dominance:
- Cardiovascular: This is the largest application segment, owing to the extensive use of nitinol in coronary stents, peripheral vascular stents, and other devices for treating heart and blood vessel conditions.
- Urology: Nitinol finds significant application in urology for stents, baskets for stone removal, and other minimally invasive instruments.
- Dentistry: Emerging applications in orthodontics and endodontics contribute to the growth of this segment.
- Other Products: Includes applications in neurovascular, gastrointestinal, and orthopedic interventions, demonstrating the broad applicability of nitinol.
Economic policies favoring healthcare innovation and infrastructure development in regions like Europe and Asia-Pacific are also contributing to the expanding global footprint of the Nitinol industry.
Nitinol Industry Product Innovations
Product innovations in the Nitinol industry are primarily driven by the pursuit of enhanced biocompatibility, superior mechanical properties, and novel functionalities. Advancements in alloy compositions and manufacturing techniques are yielding nitinol products with increased fatigue resistance, improved superelasticity, and tailored shape memory effects, crucial for intricate medical applications. These innovations are leading to the development of next-generation stents with thinner struts and better deliverability, more precise guidewires for complex interventions, and advanced surgical tools offering greater control and efficacy. The competitive advantage lies in the ability to develop highly specialized nitinol components that precisely meet the demanding requirements of interventional cardiology, urology, and other fields.
Report Scope & Segmentation Analysis
This report meticulously segments the Nitinol industry by Product Type and Application. The Product Type segmentation includes Stents, Baskets, Guidewires, and Other Products. The Application segmentation covers Cardiovascular, Urology, Dentistry, and Other Products. Each segment is analyzed for its market size, growth projections, and competitive dynamics within the broader Nitinol market.
- Stents: Expected to maintain its leading position, driven by advancements in cardiovascular interventions and increasing adoption in peripheral applications.
- Baskets: Growth anticipated in urology and interventional radiology, with ongoing product development for enhanced retrieval capabilities.
- Guidewires: Consistent demand driven by the increasing complexity of minimally invasive procedures and neurovascular interventions.
- Other Products: A rapidly expanding segment encompassing diverse applications, showcasing the versatility and potential of nitinol.
- Cardiovascular: The largest application segment, with continued innovation in stent technology and treatment of complex vascular diseases.
- Urology: Steady growth fueled by the demand for less invasive treatment of kidney stones and other urological conditions.
- Dentistry: Emerging applications in orthodontics and endodontics are contributing to this segment's expansion.
- Other Products: Covers a wide array of applications in neurovascular, gastrointestinal, and orthopedic procedures, with significant growth potential.
Key Drivers of Nitinol Industry Growth
The Nitinol industry's growth is propelled by several key factors. Technologically, the inherent properties of nitinol – superelasticity, shape memory, and biocompatibility – make it indispensable for advanced medical devices, particularly in minimally invasive surgery. Economically, rising global healthcare expenditure and an aging population are increasing the demand for sophisticated medical treatments. Regulatory bodies, while stringent, also encourage innovation by approving novel nitinol-based devices that demonstrate clear clinical benefits and improved patient outcomes. The continuous pursuit of less invasive procedures, coupled with advancements in material science and manufacturing, forms a powerful synergistic force driving market expansion.
- Technological Advancement: Unique material properties enabling advanced medical device design.
- Growing Demand for Minimally Invasive Procedures: Patient preference and clinical benefits driving adoption.
- Increasing Prevalence of Chronic Diseases: Conditions like cardiovascular diseases require advanced treatment solutions.
- Aging Global Population: Leading to higher healthcare needs and demand for medical devices.
- Favorable Regulatory Environment for Novel Medical Devices: Approvals for effective and safe nitinol applications.
Challenges in the Nitinol Industry Sector
Despite its robust growth, the Nitinol industry faces several challenges. Regulatory hurdles, particularly the rigorous approval processes for medical devices, can be time-consuming and costly, impacting the speed of market entry for new products. Supply chain complexities, including the sourcing of high-purity nickel and titanium, can lead to price volatility and potential disruptions. Furthermore, intense competition among established players and emerging innovators necessitates continuous investment in R&D to maintain a competitive edge. The high cost of specialized manufacturing processes also presents a barrier to entry for smaller companies, limiting market accessibility.
- Stringent Regulatory Approvals: Lengthy and costly processes for new medical devices.
- Supply Chain Vulnerabilities: Sourcing of raw materials and manufacturing complexities.
- Intense Competitive Pressure: Need for continuous innovation and R&D investment.
- High Manufacturing Costs: Specialized processes contribute to overall product pricing.
- Material Purity and Consistency: Ensuring high-quality nitinol for medical applications.
Emerging Opportunities in Nitinol Industry
Emerging opportunities within the Nitinol industry are abundant, driven by ongoing research and the expansion of its application scope. The development of novel nitinol alloys with even greater biocompatibility and improved mechanical properties opens doors for new therapeutic areas. Advancements in additive manufacturing (3D printing) of nitinol components promise more intricate designs and customized implants. The growing markets in emerging economies, coupled with increasing healthcare investments, present significant expansion potential. Furthermore, exploring nitinol's use in non-medical fields, such as aerospace and robotics, could unlock entirely new revenue streams.
- New Alloy Development: Enhanced properties for advanced medical applications.
- Additive Manufacturing (3D Printing): Enables complex and customized nitinol components.
- Expansion into Emerging Markets: Growing healthcare infrastructure and demand.
- Non-Medical Applications: Potential in aerospace, robotics, and consumer electronics.
- Integration with Smart Technologies: Development of active implants and sensors.
Leading Players in the Nitinol Industry Market
- Cook Medical
- Arthrex Inc
- Merck KGaA
- Becton Dickinson & Company
- Zimmer Biomet
- Terumo Corporation
- EndoSmart GmbH
- W L Gore & Associate Inc
- Boston Scientific Corporation
- B Braun SE
Key Developments in Nitinol Industry Industry
- November 2022: Alleima acquired Endosmart Gesellschaft für Medizintechnik GmbH (Endosmart), a Germany-based manufacturer of medical devices and components made of the shape-memory alloy nitinol. The product offering includes kidney stone retrieval baskets and snares, breast cancer tumor markers, as well as surgical instruments. This acquisition strengthens Alleima's position in the medical device component market and expands its expertise in nitinol.
- May 2022: Stryker Corporation launched its EasyFuse Dynamic Compression System, which uses the nickel-titanium alloy metal Nitinol. The material's strength and shape recovery, and its aim, are to reduce surgical complexity and waste in the operating room (OR). This launch highlights the increasing use of nitinol in orthopedic solutions for improved surgical outcomes.
Future Outlook for Nitinol Industry Market
The future outlook for the Nitinol industry is exceptionally promising, with sustained growth anticipated throughout the forecast period. The relentless pursuit of minimally invasive procedures, coupled with the unique and highly advantageous properties of nitinol, will continue to drive demand. Innovations in alloy development and manufacturing techniques will expand its application spectrum into more complex and critical medical interventions. The increasing global healthcare expenditure, particularly in emerging economies, presents significant untapped market potential. Strategic partnerships, mergers, and acquisitions will likely continue to shape the market landscape, fostering consolidation and driving technological advancements. The industry is poised for substantial expansion, with a projected market value exceeding billions of dollars by 2033, solidifying its role as a cornerstone material in modern medicine.
Nitinol Industry Segmentation
-
1. Product Type
- 1.1. Stents
- 1.2. Baskets
- 1.3. Guidewires
- 1.4. Other Products
-
2. Application
- 2.1. Cardiovascular
- 2.2. Urology
- 2.3. Dentistry
- 2.4. Other Products
Nitinol Industry Segmentation By Geography
-
1. North America
- 1.1. United States
- 1.2. Canada
- 1.3. Mexico
-
2. Europe
- 2.1. Germany
- 2.2. United Kingdom
- 2.3. France
- 2.4. Italy
- 2.5. Spain
- 2.6. Rest of Europe
-
3. Asia Pacific
- 3.1. China
- 3.2. Japan
- 3.3. India
- 3.4. Australia
- 3.5. South Korea
- 3.6. Rest of Asia Pacific
-
4. Middle East and Africa
- 4.1. GCC
- 4.2. South Africa
- 4.3. Rest of Middle East and Africa
-
5. South America
- 5.1. Brazil
- 5.2. Argentina
- 5.3. Rest of South America
Nitinol Industry Regional Market Share
Geographic Coverage of Nitinol Industry
Nitinol Industry REPORT HIGHLIGHTS
| Aspects | Details |
|---|---|
| Study Period | 2020-2034 |
| Base Year | 2025 |
| Estimated Year | 2026 |
| Forecast Period | 2026-2034 |
| Historical Period | 2020-2025 |
| Growth Rate | CAGR of 7.1% from 2020-2034 |
| Segmentation |
|
Table of Contents
- 1. Introduction
- 1.1. Research Scope
- 1.2. Market Segmentation
- 1.3. Research Objective
- 1.4. Definitions and Assumptions
- 2. Executive Summary
- 2.1. Market Snapshot
- 3. Market Dynamics
- 3.1. Market Drivers
- 3.2. Market Restrains
- 3.3. Market Trends
- 3.4. Market Opportunities
- 4. Market Factor Analysis
- 4.1. Porters Five Forces
- 4.1.1. Bargaining Power of Suppliers
- 4.1.2. Bargaining Power of Buyers
- 4.1.3. Threat of New Entrants
- 4.1.4. Threat of Substitutes
- 4.1.5. Competitive Rivalry
- 4.2. PESTEL analysis
- 4.3. BCG Analysis
- 4.3.1. Stars (High Growth, High Market Share)
- 4.3.2. Cash Cows (Low Growth, High Market Share)
- 4.3.3. Question Mark (High Growth, Low Market Share)
- 4.3.4. Dogs (Low Growth, Low Market Share)
- 4.4. Ansoff Matrix Analysis
- 4.5. Supply Chain Analysis
- 4.6. Regulatory Landscape
- 4.7. Current Market Potential and Opportunity Assessment (TAM–SAM–SOM Framework)
- 4.8. PRI Analyst Note
- 4.1. Porters Five Forces
- 5. Market Analysis, Insights and Forecast 2021-2033
- 5.1. Market Analysis, Insights and Forecast - by Product Type
- 5.1.1. Stents
- 5.1.2. Baskets
- 5.1.3. Guidewires
- 5.1.4. Other Products
- 5.2. Market Analysis, Insights and Forecast - by Application
- 5.2.1. Cardiovascular
- 5.2.2. Urology
- 5.2.3. Dentistry
- 5.2.4. Other Products
- 5.3. Market Analysis, Insights and Forecast - by Region
- 5.3.1. North America
- 5.3.2. Europe
- 5.3.3. Asia Pacific
- 5.3.4. Middle East and Africa
- 5.3.5. South America
- 5.1. Market Analysis, Insights and Forecast - by Product Type
- 6. Global Nitinol Industry Analysis, Insights and Forecast, 2021-2033
- 6.1. Market Analysis, Insights and Forecast - by Product Type
- 6.1.1. Stents
- 6.1.2. Baskets
- 6.1.3. Guidewires
- 6.1.4. Other Products
- 6.2. Market Analysis, Insights and Forecast - by Application
- 6.2.1. Cardiovascular
- 6.2.2. Urology
- 6.2.3. Dentistry
- 6.2.4. Other Products
- 6.1. Market Analysis, Insights and Forecast - by Product Type
- 7. North America Nitinol Industry Analysis, Insights and Forecast, 2020-2032
- 7.1. Market Analysis, Insights and Forecast - by Product Type
- 7.1.1. Stents
- 7.1.2. Baskets
- 7.1.3. Guidewires
- 7.1.4. Other Products
- 7.2. Market Analysis, Insights and Forecast - by Application
- 7.2.1. Cardiovascular
- 7.2.2. Urology
- 7.2.3. Dentistry
- 7.2.4. Other Products
- 7.1. Market Analysis, Insights and Forecast - by Product Type
- 8. Europe Nitinol Industry Analysis, Insights and Forecast, 2020-2032
- 8.1. Market Analysis, Insights and Forecast - by Product Type
- 8.1.1. Stents
- 8.1.2. Baskets
- 8.1.3. Guidewires
- 8.1.4. Other Products
- 8.2. Market Analysis, Insights and Forecast - by Application
- 8.2.1. Cardiovascular
- 8.2.2. Urology
- 8.2.3. Dentistry
- 8.2.4. Other Products
- 8.1. Market Analysis, Insights and Forecast - by Product Type
- 9. Asia Pacific Nitinol Industry Analysis, Insights and Forecast, 2020-2032
- 9.1. Market Analysis, Insights and Forecast - by Product Type
- 9.1.1. Stents
- 9.1.2. Baskets
- 9.1.3. Guidewires
- 9.1.4. Other Products
- 9.2. Market Analysis, Insights and Forecast - by Application
- 9.2.1. Cardiovascular
- 9.2.2. Urology
- 9.2.3. Dentistry
- 9.2.4. Other Products
- 9.1. Market Analysis, Insights and Forecast - by Product Type
- 10. Middle East and Africa Nitinol Industry Analysis, Insights and Forecast, 2020-2032
- 10.1. Market Analysis, Insights and Forecast - by Product Type
- 10.1.1. Stents
- 10.1.2. Baskets
- 10.1.3. Guidewires
- 10.1.4. Other Products
- 10.2. Market Analysis, Insights and Forecast - by Application
- 10.2.1. Cardiovascular
- 10.2.2. Urology
- 10.2.3. Dentistry
- 10.2.4. Other Products
- 10.1. Market Analysis, Insights and Forecast - by Product Type
- 11. South America Nitinol Industry Analysis, Insights and Forecast, 2020-2032
- 11.1. Market Analysis, Insights and Forecast - by Product Type
- 11.1.1. Stents
- 11.1.2. Baskets
- 11.1.3. Guidewires
- 11.1.4. Other Products
- 11.2. Market Analysis, Insights and Forecast - by Application
- 11.2.1. Cardiovascular
- 11.2.2. Urology
- 11.2.3. Dentistry
- 11.2.4. Other Products
- 11.1. Market Analysis, Insights and Forecast - by Product Type
- 12. Competitive Analysis
- 12.1. Company Profiles
- 12.1.1 Cook Medical
- 12.1.1.1. Company Overview
- 12.1.1.2. Products
- 12.1.1.3. Company Financials
- 12.1.1.4. SWOT Analysis
- 12.1.2 Arthrex Inc
- 12.1.2.1. Company Overview
- 12.1.2.2. Products
- 12.1.2.3. Company Financials
- 12.1.2.4. SWOT Analysis
- 12.1.3 Merck KGaA
- 12.1.3.1. Company Overview
- 12.1.3.2. Products
- 12.1.3.3. Company Financials
- 12.1.3.4. SWOT Analysis
- 12.1.4 Becton Dickinson & Company
- 12.1.4.1. Company Overview
- 12.1.4.2. Products
- 12.1.4.3. Company Financials
- 12.1.4.4. SWOT Analysis
- 12.1.5 Zimmer Biomet
- 12.1.5.1. Company Overview
- 12.1.5.2. Products
- 12.1.5.3. Company Financials
- 12.1.5.4. SWOT Analysis
- 12.1.6 Terumo Corporation
- 12.1.6.1. Company Overview
- 12.1.6.2. Products
- 12.1.6.3. Company Financials
- 12.1.6.4. SWOT Analysis
- 12.1.7 EndoSmart GmbH
- 12.1.7.1. Company Overview
- 12.1.7.2. Products
- 12.1.7.3. Company Financials
- 12.1.7.4. SWOT Analysis
- 12.1.8 W L Gore & Associate Inc
- 12.1.8.1. Company Overview
- 12.1.8.2. Products
- 12.1.8.3. Company Financials
- 12.1.8.4. SWOT Analysis
- 12.1.9 Boston Scientific Corporation
- 12.1.9.1. Company Overview
- 12.1.9.2. Products
- 12.1.9.3. Company Financials
- 12.1.9.4. SWOT Analysis
- 12.1.10 B Braun SE
- 12.1.10.1. Company Overview
- 12.1.10.2. Products
- 12.1.10.3. Company Financials
- 12.1.10.4. SWOT Analysis
- 12.1.1 Cook Medical
- 12.2. Market Entropy
- 12.2.1 Company's Key Areas Served
- 12.2.2 Recent Developments
- 12.3. Company Market Share Analysis 2025
- 12.3.1 Top 5 Companies Market Share Analysis
- 12.3.2 Top 3 Companies Market Share Analysis
- 12.4. List of Potential Customers
- 13. Research Methodology
List of Figures
- Figure 1: Global Nitinol Industry Revenue Breakdown (billion, %) by Region 2025 & 2033
- Figure 2: Global Nitinol Industry Volume Breakdown (K Unit, %) by Region 2025 & 2033
- Figure 3: North America Nitinol Industry Revenue (billion), by Product Type 2025 & 2033
- Figure 4: North America Nitinol Industry Volume (K Unit), by Product Type 2025 & 2033
- Figure 5: North America Nitinol Industry Revenue Share (%), by Product Type 2025 & 2033
- Figure 6: North America Nitinol Industry Volume Share (%), by Product Type 2025 & 2033
- Figure 7: North America Nitinol Industry Revenue (billion), by Application 2025 & 2033
- Figure 8: North America Nitinol Industry Volume (K Unit), by Application 2025 & 2033
- Figure 9: North America Nitinol Industry Revenue Share (%), by Application 2025 & 2033
- Figure 10: North America Nitinol Industry Volume Share (%), by Application 2025 & 2033
- Figure 11: North America Nitinol Industry Revenue (billion), by Country 2025 & 2033
- Figure 12: North America Nitinol Industry Volume (K Unit), by Country 2025 & 2033
- Figure 13: North America Nitinol Industry Revenue Share (%), by Country 2025 & 2033
- Figure 14: North America Nitinol Industry Volume Share (%), by Country 2025 & 2033
- Figure 15: Europe Nitinol Industry Revenue (billion), by Product Type 2025 & 2033
- Figure 16: Europe Nitinol Industry Volume (K Unit), by Product Type 2025 & 2033
- Figure 17: Europe Nitinol Industry Revenue Share (%), by Product Type 2025 & 2033
- Figure 18: Europe Nitinol Industry Volume Share (%), by Product Type 2025 & 2033
- Figure 19: Europe Nitinol Industry Revenue (billion), by Application 2025 & 2033
- Figure 20: Europe Nitinol Industry Volume (K Unit), by Application 2025 & 2033
- Figure 21: Europe Nitinol Industry Revenue Share (%), by Application 2025 & 2033
- Figure 22: Europe Nitinol Industry Volume Share (%), by Application 2025 & 2033
- Figure 23: Europe Nitinol Industry Revenue (billion), by Country 2025 & 2033
- Figure 24: Europe Nitinol Industry Volume (K Unit), by Country 2025 & 2033
- Figure 25: Europe Nitinol Industry Revenue Share (%), by Country 2025 & 2033
- Figure 26: Europe Nitinol Industry Volume Share (%), by Country 2025 & 2033
- Figure 27: Asia Pacific Nitinol Industry Revenue (billion), by Product Type 2025 & 2033
- Figure 28: Asia Pacific Nitinol Industry Volume (K Unit), by Product Type 2025 & 2033
- Figure 29: Asia Pacific Nitinol Industry Revenue Share (%), by Product Type 2025 & 2033
- Figure 30: Asia Pacific Nitinol Industry Volume Share (%), by Product Type 2025 & 2033
- Figure 31: Asia Pacific Nitinol Industry Revenue (billion), by Application 2025 & 2033
- Figure 32: Asia Pacific Nitinol Industry Volume (K Unit), by Application 2025 & 2033
- Figure 33: Asia Pacific Nitinol Industry Revenue Share (%), by Application 2025 & 2033
- Figure 34: Asia Pacific Nitinol Industry Volume Share (%), by Application 2025 & 2033
- Figure 35: Asia Pacific Nitinol Industry Revenue (billion), by Country 2025 & 2033
- Figure 36: Asia Pacific Nitinol Industry Volume (K Unit), by Country 2025 & 2033
- Figure 37: Asia Pacific Nitinol Industry Revenue Share (%), by Country 2025 & 2033
- Figure 38: Asia Pacific Nitinol Industry Volume Share (%), by Country 2025 & 2033
- Figure 39: Middle East and Africa Nitinol Industry Revenue (billion), by Product Type 2025 & 2033
- Figure 40: Middle East and Africa Nitinol Industry Volume (K Unit), by Product Type 2025 & 2033
- Figure 41: Middle East and Africa Nitinol Industry Revenue Share (%), by Product Type 2025 & 2033
- Figure 42: Middle East and Africa Nitinol Industry Volume Share (%), by Product Type 2025 & 2033
- Figure 43: Middle East and Africa Nitinol Industry Revenue (billion), by Application 2025 & 2033
- Figure 44: Middle East and Africa Nitinol Industry Volume (K Unit), by Application 2025 & 2033
- Figure 45: Middle East and Africa Nitinol Industry Revenue Share (%), by Application 2025 & 2033
- Figure 46: Middle East and Africa Nitinol Industry Volume Share (%), by Application 2025 & 2033
- Figure 47: Middle East and Africa Nitinol Industry Revenue (billion), by Country 2025 & 2033
- Figure 48: Middle East and Africa Nitinol Industry Volume (K Unit), by Country 2025 & 2033
- Figure 49: Middle East and Africa Nitinol Industry Revenue Share (%), by Country 2025 & 2033
- Figure 50: Middle East and Africa Nitinol Industry Volume Share (%), by Country 2025 & 2033
- Figure 51: South America Nitinol Industry Revenue (billion), by Product Type 2025 & 2033
- Figure 52: South America Nitinol Industry Volume (K Unit), by Product Type 2025 & 2033
- Figure 53: South America Nitinol Industry Revenue Share (%), by Product Type 2025 & 2033
- Figure 54: South America Nitinol Industry Volume Share (%), by Product Type 2025 & 2033
- Figure 55: South America Nitinol Industry Revenue (billion), by Application 2025 & 2033
- Figure 56: South America Nitinol Industry Volume (K Unit), by Application 2025 & 2033
- Figure 57: South America Nitinol Industry Revenue Share (%), by Application 2025 & 2033
- Figure 58: South America Nitinol Industry Volume Share (%), by Application 2025 & 2033
- Figure 59: South America Nitinol Industry Revenue (billion), by Country 2025 & 2033
- Figure 60: South America Nitinol Industry Volume (K Unit), by Country 2025 & 2033
- Figure 61: South America Nitinol Industry Revenue Share (%), by Country 2025 & 2033
- Figure 62: South America Nitinol Industry Volume Share (%), by Country 2025 & 2033
List of Tables
- Table 1: Global Nitinol Industry Revenue billion Forecast, by Product Type 2020 & 2033
- Table 2: Global Nitinol Industry Volume K Unit Forecast, by Product Type 2020 & 2033
- Table 3: Global Nitinol Industry Revenue billion Forecast, by Application 2020 & 2033
- Table 4: Global Nitinol Industry Volume K Unit Forecast, by Application 2020 & 2033
- Table 5: Global Nitinol Industry Revenue billion Forecast, by Region 2020 & 2033
- Table 6: Global Nitinol Industry Volume K Unit Forecast, by Region 2020 & 2033
- Table 7: Global Nitinol Industry Revenue billion Forecast, by Product Type 2020 & 2033
- Table 8: Global Nitinol Industry Volume K Unit Forecast, by Product Type 2020 & 2033
- Table 9: Global Nitinol Industry Revenue billion Forecast, by Application 2020 & 2033
- Table 10: Global Nitinol Industry Volume K Unit Forecast, by Application 2020 & 2033
- Table 11: Global Nitinol Industry Revenue billion Forecast, by Country 2020 & 2033
- Table 12: Global Nitinol Industry Volume K Unit Forecast, by Country 2020 & 2033
- Table 13: United States Nitinol Industry Revenue (billion) Forecast, by Application 2020 & 2033
- Table 14: United States Nitinol Industry Volume (K Unit) Forecast, by Application 2020 & 2033
- Table 15: Canada Nitinol Industry Revenue (billion) Forecast, by Application 2020 & 2033
- Table 16: Canada Nitinol Industry Volume (K Unit) Forecast, by Application 2020 & 2033
- Table 17: Mexico Nitinol Industry Revenue (billion) Forecast, by Application 2020 & 2033
- Table 18: Mexico Nitinol Industry Volume (K Unit) Forecast, by Application 2020 & 2033
- Table 19: Global Nitinol Industry Revenue billion Forecast, by Product Type 2020 & 2033
- Table 20: Global Nitinol Industry Volume K Unit Forecast, by Product Type 2020 & 2033
- Table 21: Global Nitinol Industry Revenue billion Forecast, by Application 2020 & 2033
- Table 22: Global Nitinol Industry Volume K Unit Forecast, by Application 2020 & 2033
- Table 23: Global Nitinol Industry Revenue billion Forecast, by Country 2020 & 2033
- Table 24: Global Nitinol Industry Volume K Unit Forecast, by Country 2020 & 2033
- Table 25: Germany Nitinol Industry Revenue (billion) Forecast, by Application 2020 & 2033
- Table 26: Germany Nitinol Industry Volume (K Unit) Forecast, by Application 2020 & 2033
- Table 27: United Kingdom Nitinol Industry Revenue (billion) Forecast, by Application 2020 & 2033
- Table 28: United Kingdom Nitinol Industry Volume (K Unit) Forecast, by Application 2020 & 2033
- Table 29: France Nitinol Industry Revenue (billion) Forecast, by Application 2020 & 2033
- Table 30: France Nitinol Industry Volume (K Unit) Forecast, by Application 2020 & 2033
- Table 31: Italy Nitinol Industry Revenue (billion) Forecast, by Application 2020 & 2033
- Table 32: Italy Nitinol Industry Volume (K Unit) Forecast, by Application 2020 & 2033
- Table 33: Spain Nitinol Industry Revenue (billion) Forecast, by Application 2020 & 2033
- Table 34: Spain Nitinol Industry Volume (K Unit) Forecast, by Application 2020 & 2033
- Table 35: Rest of Europe Nitinol Industry Revenue (billion) Forecast, by Application 2020 & 2033
- Table 36: Rest of Europe Nitinol Industry Volume (K Unit) Forecast, by Application 2020 & 2033
- Table 37: Global Nitinol Industry Revenue billion Forecast, by Product Type 2020 & 2033
- Table 38: Global Nitinol Industry Volume K Unit Forecast, by Product Type 2020 & 2033
- Table 39: Global Nitinol Industry Revenue billion Forecast, by Application 2020 & 2033
- Table 40: Global Nitinol Industry Volume K Unit Forecast, by Application 2020 & 2033
- Table 41: Global Nitinol Industry Revenue billion Forecast, by Country 2020 & 2033
- Table 42: Global Nitinol Industry Volume K Unit Forecast, by Country 2020 & 2033
- Table 43: China Nitinol Industry Revenue (billion) Forecast, by Application 2020 & 2033
- Table 44: China Nitinol Industry Volume (K Unit) Forecast, by Application 2020 & 2033
- Table 45: Japan Nitinol Industry Revenue (billion) Forecast, by Application 2020 & 2033
- Table 46: Japan Nitinol Industry Volume (K Unit) Forecast, by Application 2020 & 2033
- Table 47: India Nitinol Industry Revenue (billion) Forecast, by Application 2020 & 2033
- Table 48: India Nitinol Industry Volume (K Unit) Forecast, by Application 2020 & 2033
- Table 49: Australia Nitinol Industry Revenue (billion) Forecast, by Application 2020 & 2033
- Table 50: Australia Nitinol Industry Volume (K Unit) Forecast, by Application 2020 & 2033
- Table 51: South Korea Nitinol Industry Revenue (billion) Forecast, by Application 2020 & 2033
- Table 52: South Korea Nitinol Industry Volume (K Unit) Forecast, by Application 2020 & 2033
- Table 53: Rest of Asia Pacific Nitinol Industry Revenue (billion) Forecast, by Application 2020 & 2033
- Table 54: Rest of Asia Pacific Nitinol Industry Volume (K Unit) Forecast, by Application 2020 & 2033
- Table 55: Global Nitinol Industry Revenue billion Forecast, by Product Type 2020 & 2033
- Table 56: Global Nitinol Industry Volume K Unit Forecast, by Product Type 2020 & 2033
- Table 57: Global Nitinol Industry Revenue billion Forecast, by Application 2020 & 2033
- Table 58: Global Nitinol Industry Volume K Unit Forecast, by Application 2020 & 2033
- Table 59: Global Nitinol Industry Revenue billion Forecast, by Country 2020 & 2033
- Table 60: Global Nitinol Industry Volume K Unit Forecast, by Country 2020 & 2033
- Table 61: GCC Nitinol Industry Revenue (billion) Forecast, by Application 2020 & 2033
- Table 62: GCC Nitinol Industry Volume (K Unit) Forecast, by Application 2020 & 2033
- Table 63: South Africa Nitinol Industry Revenue (billion) Forecast, by Application 2020 & 2033
- Table 64: South Africa Nitinol Industry Volume (K Unit) Forecast, by Application 2020 & 2033
- Table 65: Rest of Middle East and Africa Nitinol Industry Revenue (billion) Forecast, by Application 2020 & 2033
- Table 66: Rest of Middle East and Africa Nitinol Industry Volume (K Unit) Forecast, by Application 2020 & 2033
- Table 67: Global Nitinol Industry Revenue billion Forecast, by Product Type 2020 & 2033
- Table 68: Global Nitinol Industry Volume K Unit Forecast, by Product Type 2020 & 2033
- Table 69: Global Nitinol Industry Revenue billion Forecast, by Application 2020 & 2033
- Table 70: Global Nitinol Industry Volume K Unit Forecast, by Application 2020 & 2033
- Table 71: Global Nitinol Industry Revenue billion Forecast, by Country 2020 & 2033
- Table 72: Global Nitinol Industry Volume K Unit Forecast, by Country 2020 & 2033
- Table 73: Brazil Nitinol Industry Revenue (billion) Forecast, by Application 2020 & 2033
- Table 74: Brazil Nitinol Industry Volume (K Unit) Forecast, by Application 2020 & 2033
- Table 75: Argentina Nitinol Industry Revenue (billion) Forecast, by Application 2020 & 2033
- Table 76: Argentina Nitinol Industry Volume (K Unit) Forecast, by Application 2020 & 2033
- Table 77: Rest of South America Nitinol Industry Revenue (billion) Forecast, by Application 2020 & 2033
- Table 78: Rest of South America Nitinol Industry Volume (K Unit) Forecast, by Application 2020 & 2033
Frequently Asked Questions
1. What is the projected Compound Annual Growth Rate (CAGR) of the Nitinol Industry?
The projected CAGR is approximately 7.1%.
2. Which companies are prominent players in the Nitinol Industry?
Key companies in the market include Cook Medical, Arthrex Inc, Merck KGaA, Becton Dickinson & Company, Zimmer Biomet, Terumo Corporation, EndoSmart GmbH, W L Gore & Associate Inc, Boston Scientific Corporation, B Braun SE.
3. What are the main segments of the Nitinol Industry?
The market segments include Product Type, Application.
4. Can you provide details about the market size?
The market size is estimated to be USD 7.68 billion as of 2022.
5. What are some drivers contributing to market growth?
Growing Burden of Chronic Diseases; Rising Preference for Minimally Invasive Surgeries.
6. What are the notable trends driving market growth?
Stents Segment to Witness Significant Growth over the Forecast Period..
7. Are there any restraints impacting market growth?
High-cost of Devices; Presence of Alternative Devices.
8. Can you provide examples of recent developments in the market?
November 2022: Alleima acquired Endosmart Gesellschaft für Medizintechnik GmbH (Endosmart), a Germany-based manufacturer of medical devices and components made of the shape-memory alloy nitinol. The product offering includes kidney stone retrieval baskets and snares, breast cancer tumor markers, as well as surgical instruments.
9. What pricing options are available for accessing the report?
Pricing options include single-user, multi-user, and enterprise licenses priced at USD 4750, USD 5250, and USD 8750 respectively.
10. Is the market size provided in terms of value or volume?
The market size is provided in terms of value, measured in billion and volume, measured in K Unit.
11. Are there any specific market keywords associated with the report?
Yes, the market keyword associated with the report is "Nitinol Industry," which aids in identifying and referencing the specific market segment covered.
12. How do I determine which pricing option suits my needs best?
The pricing options vary based on user requirements and access needs. Individual users may opt for single-user licenses, while businesses requiring broader access may choose multi-user or enterprise licenses for cost-effective access to the report.
13. Are there any additional resources or data provided in the Nitinol Industry report?
While the report offers comprehensive insights, it's advisable to review the specific contents or supplementary materials provided to ascertain if additional resources or data are available.
14. How can I stay updated on further developments or reports in the Nitinol Industry?
To stay informed about further developments, trends, and reports in the Nitinol Industry, consider subscribing to industry newsletters, following relevant companies and organizations, or regularly checking reputable industry news sources and publications.
Methodology
Step 1 - Identification of Relevant Samples Size from Population Database


Step 2 - Approaches for Defining Global Market Size (Value, Volume* & Price*)

Note*: In applicable scenarios
Step 3 - Data Sources
Primary Research
- Web Analytics
- Survey Reports
- Research Institute
- Latest Research Reports
- Opinion Leaders
Secondary Research
- Annual Reports
- White Paper
- Latest Press Release
- Industry Association
- Paid Database
- Investor Presentations

Step 4 - Data Triangulation
Involves using different sources of information in order to increase the validity of a study
These sources are likely to be stakeholders in a program - participants, other researchers, program staff, other community members, and so on.
Then we put all data in single framework & apply various statistical tools to find out the dynamic on the market.
During the analysis stage, feedback from the stakeholder groups would be compared to determine areas of agreement as well as areas of divergence