

Key Insights
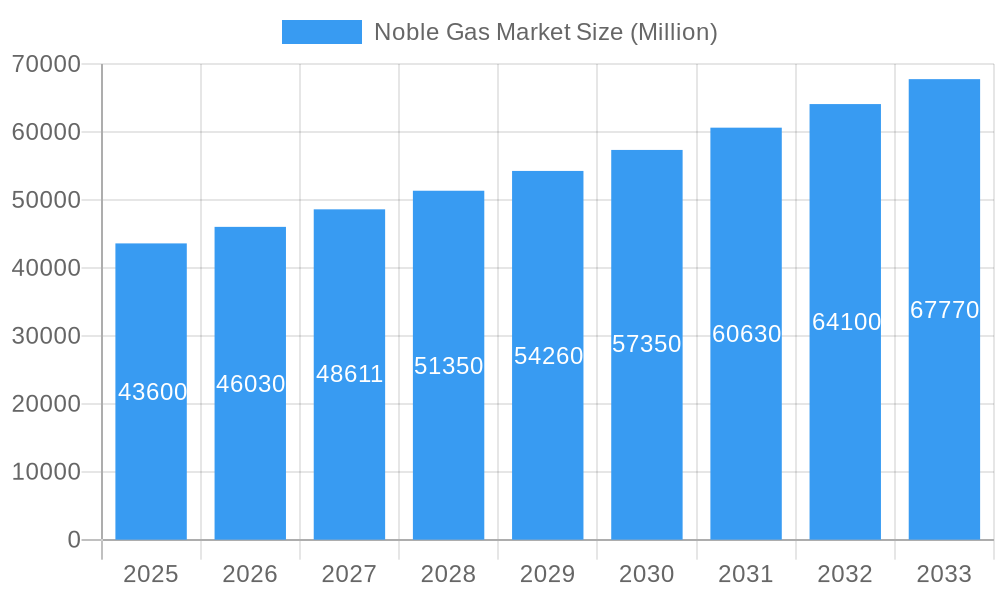
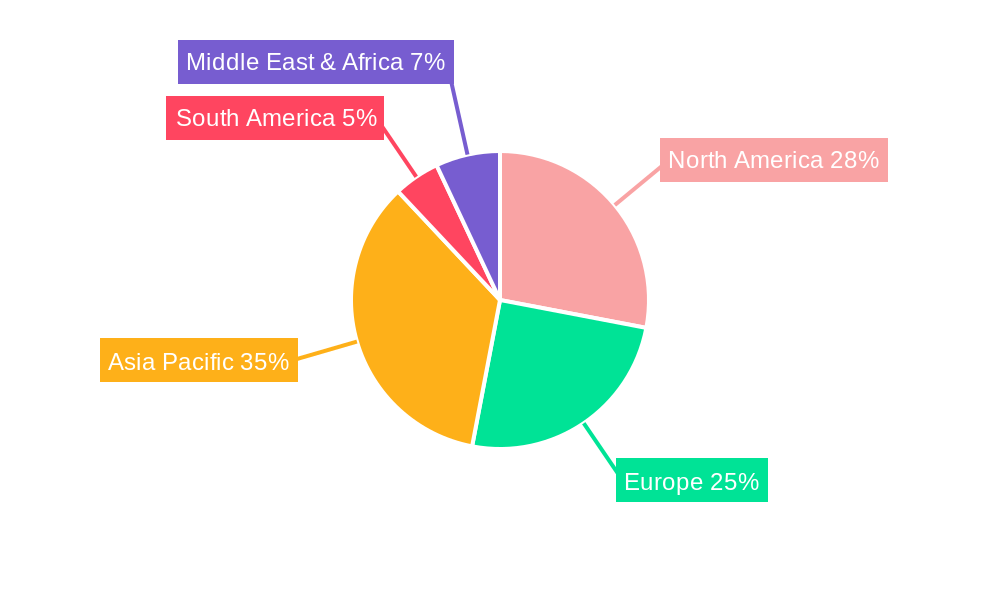
The global noble gas market, valued at $43,600 million in 2025, is projected to experience robust growth, exceeding a 5% CAGR from 2025 to 2033. This expansion is driven by increasing demand across diverse sectors. The healthcare industry, particularly in medical imaging (Picture Projection) and anesthesia, is a significant driver. Furthermore, the burgeoning oil and gas exploration and extraction, along with advancements in welding and lighting technologies, fuel market growth. The rise of energy-efficient solutions and the growing adoption of noble gases in advanced manufacturing processes like semiconductor production further contribute to this positive outlook. Segment-wise, Helium and Argon are anticipated to dominate due to their extensive applications in various industries. However, the market faces challenges such as price volatility, particularly for Helium, due to limited global supply and increasing demand. Stringent regulatory frameworks concerning the handling and disposal of radioactive Radon also impose restraints. Geographically, the Asia-Pacific region, led by China and India, is expected to exhibit significant growth potential due to rapid industrialization and infrastructure development. North America and Europe, while mature markets, will continue to contribute substantially, driven by ongoing technological advancements and innovations.
Noble Gas Market Market Size (In Billion)
The competitive landscape is characterized by the presence of major players like Air Products and Chemicals Inc., Linde plc, and Air Liquide, among others. These companies are continuously investing in research and development to enhance product offerings and expand their market reach. Strategic partnerships, mergers, and acquisitions are expected to shape the competitive dynamics in the coming years. The increasing focus on sustainable practices and the development of environmentally friendly noble gas applications will also play a key role in shaping the future of this market. Overall, the noble gas market is poised for considerable expansion, fueled by diverse applications and technological advancements, while also facing challenges that need to be strategically addressed.
Noble Gas Market Company Market Share
This comprehensive report provides a detailed analysis of the Noble Gas Market, offering actionable insights for industry professionals. Covering the period 2019-2033, with a focus on 2025, this study delivers a thorough understanding of market dynamics, growth drivers, and future opportunities.
Noble Gas Market Market Structure & Innovation Trends
The Noble Gas market exhibits a moderately concentrated structure, with several major players holding significant market share. Air Liquide, Linde plc, Air Products and Chemicals Inc., and Messer Group collectively account for an estimated xx% of the global market in 2025. Innovation is driven by advancements in cryogenic technologies, particularly for efficient separation and purification of noble gases. Regulatory frameworks concerning environmental impact and safety standards play a significant role, influencing production methods and market access. Product substitutes are limited due to the unique properties of noble gases, although competition arises from alternative technologies in specific applications. The market has witnessed a few significant M&A activities in recent years, with deal values exceeding USD xx Million in the past five years. End-user demographics are diverse, spanning various industries with varying demands and preferences.
- Market Concentration: High (xx% market share held by top 4 players in 2025)
- Innovation Drivers: Cryogenic technology advancements, improved purification techniques.
- Regulatory Framework: Stringent safety and environmental regulations.
- M&A Activity: USD xx Million in deal value over the past five years.
Noble Gas Market Market Dynamics & Trends
The Noble Gas market is projected to experience robust growth, with a CAGR of xx% during the forecast period (2025-2033). Key growth drivers include the increasing demand from diverse end-use sectors such as healthcare (medical imaging and anesthesia), industrial applications (welding and shielding gases), and emerging technologies (semiconductor manufacturing and quantum computing). Technological disruptions are centered on the development of more efficient separation and purification methods, resulting in lower production costs and increased availability of noble gases. Consumer preferences are primarily driven by quality, reliability, and cost-effectiveness. Competitive dynamics are characterized by intense rivalry amongst major players, focusing on pricing strategies, technological innovations, and market expansion efforts. Market penetration varies significantly across different noble gas types and applications, with Helium currently dominating the market due to its versatile applications.
Dominant Regions & Segments in Noble Gas Market
The North American region is currently the leading market for noble gases, driven by strong demand from the healthcare, aerospace, and industrial sectors. Within this region, the United States holds the largest market share.
Key Drivers by Region:
- North America: Strong industrial base, technological advancements, supportive government policies.
- Europe: Growing healthcare sector, stringent environmental regulations driving innovation.
- Asia-Pacific: Rapid industrialization, increasing energy consumption, rising disposable incomes.
Dominant Segments:
- By Type: Helium dominates due to its widespread applications, followed by Argon and Neon.
- By Application: Welding and shielding gases account for a significant market share, driven by the construction and manufacturing industries. Medical applications (anesthesia and MRI) show robust growth potential.
Noble Gas Market Product Innovations
Recent product innovations have focused on developing more efficient and cost-effective separation and purification technologies for noble gases. This includes advancements in cryogenic distillation, membrane separation, and adsorption techniques. New applications for noble gases are continually emerging, particularly in advanced technologies like quantum computing and laser applications. These innovations are enhancing the overall market competitiveness and meeting the evolving needs of diverse end-use sectors.
Report Scope & Segmentation Analysis
This report comprehensively analyzes the Noble Gas Market across various segments:
- By Type: Helium, Neon, Argon, Krypton, Xenon, Radioactive Radon – each segment’s market size, growth projections and competitive dynamics are detailed.
- By Application: Picture Projection, Anesthetic, Welding, Insulation, Lighting, Television Tubes, Advertising, Refrigerant, Working Fluid, Chemical Analysis – Each application’s growth rate and market share are extensively covered.
- By End-user Industry: Oil and Gas, Mining, Healthcare, Aerospace, Construction, Energy and Power – The report dissects each end-user industry’s influence on market growth.
Growth projections for each segment are provided for the forecast period (2025-2033), along with detailed competitive landscape analysis.
Key Drivers of Noble Gas Market Growth
Several factors drive growth in the noble gas market:
- Technological advancements: Innovations in cryogenic separation and purification techniques.
- Rising demand: Growth in healthcare, industrial, and technological sectors driving demand.
- Government support: Policies and initiatives supporting research and development in relevant fields.
Challenges in the Noble Gas Market Sector
The Noble Gas market faces challenges, including:
- Price volatility: Fluctuations in raw material costs and energy prices affect profitability.
- Supply chain disruptions: Geopolitical factors and natural resource constraints can disrupt supply.
- Stringent regulations: Environmental and safety regulations increase production costs.
Emerging Opportunities in Noble Gas Market
Emerging opportunities lie in:
- New applications: Growth in advanced technologies like quantum computing and semiconductor manufacturing creates new demand.
- Regional expansion: Growth potential in developing economies with expanding industrial sectors.
- Sustainable practices: Development of environmentally friendly production and purification methods offers competitive advantages.
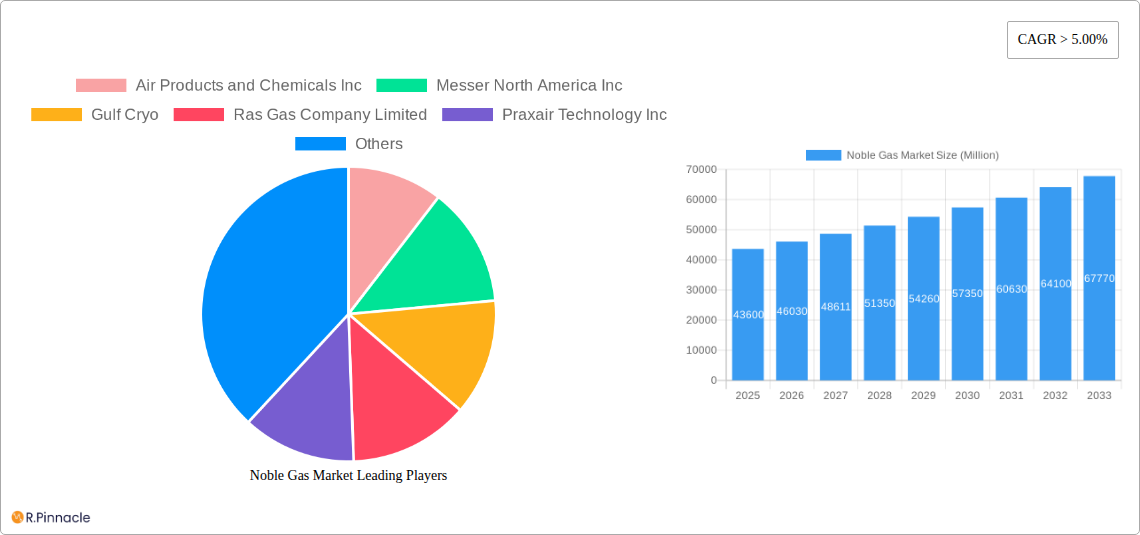
Leading Players in the Noble Gas Market Market
- Air Products and Chemicals Inc. (Air Products)
- Messer North America Inc.
- Gulf Cryo
- Ras Gas Company Limited
- Praxair Technology Inc.
- BASF SE (BASF)
- ITM Power
- Linde plc (Linde)
- American Gas
- TAIYO NIPPON SANSO CORPORATION
- Royal Dutch Shell PLC (Shell)
- Buzwair Industrial Gases Factories
- Air Liquide (Air Liquide)
- Airgas Inc.
Key Developments in Noble Gas Market Industry
- April 2022: Linde signed an off-take agreement to recover helium from Freeport LNG's Texas production site and construct a helium processing plant in the US. This significantly expands Linde's helium production capacity and strengthens its market position.
- November 2022: Air Products secured USD 1.07 billion in contracts to supply 33 million liters of liquid helium to NASA's Kennedy Space Center. This substantial contract highlights the crucial role of helium in aerospace applications and underscores Air Products' dominance in the market.
Future Outlook for Noble Gas Market Market
The Noble Gas market is poised for continued growth, driven by technological advancements, increasing demand from diverse sectors, and the emergence of novel applications. Strategic opportunities exist for companies focusing on innovation, sustainable practices, and expansion into new geographical markets. The market's future is promising, with significant potential for expansion and increased profitability.
Noble Gas Market Segmentation
-
1. Type
- 1.1. Helium
- 1.2. Krypton
- 1.3. Argon
- 1.4. Neon
- 1.5. Xenon
- 1.6. Radioactive Radon
-
2. Application
- 2.1. Picture Projection
- 2.2. Anesthetic
- 2.3. Welding
- 2.4. Insulation
- 2.5. Lighting
- 2.6. Television Tubes
- 2.7. Advertising
- 2.8. Refrigerant
- 2.9. Working Fluid
- 2.10. Chemical Analysis
-
3. End-user Industry
- 3.1. Oil and Gas
- 3.2. Mining
- 3.3. Healthcare
- 3.4. Aerospace
- 3.5. Construction
- 3.6. Energy and Power
Noble Gas Market Segmentation By Geography
-
1. Asia Pacific
- 1.1. China
- 1.2. India
- 1.3. Japan
- 1.4. South Korea
- 1.5. Rest of Asia Pacific
-
2. North America
- 2.1. United States
- 2.2. Canada
- 2.3. Mexico
-
3. Europe
- 3.1. Germany
- 3.2. United Kingdom
- 3.3. Italy
- 3.4. France
- 3.5. Rest of Europe
-
4. South America
- 4.1. Brazil
- 4.2. Argentina
- 4.3. Rest of South America
- 5. Middle East
-
6. Saudi Arabia
- 6.1. South Africa
- 6.2. Rest of Middle East
Noble Gas Market Regional Market Share
Geographic Coverage of Noble Gas Market
Noble Gas Market REPORT HIGHLIGHTS
| Aspects | Details |
|---|---|
| Study Period | 2020-2034 |
| Base Year | 2025 |
| Estimated Year | 2026 |
| Forecast Period | 2026-2034 |
| Historical Period | 2020-2025 |
| Growth Rate | CAGR of > 5.00% from 2020-2034 |
| Segmentation |
|
Table of Contents
- 1. Introduction
- 1.1. Research Scope
- 1.2. Market Segmentation
- 1.3. Research Objective
- 1.4. Definitions and Assumptions
- 2. Executive Summary
- 2.1. Market Snapshot
- 3. Market Dynamics
- 3.1. Market Drivers
- 3.2. Market Restrains
- 3.3. Market Trends
- 3.4. Market Opportunities
- 4. Market Factor Analysis
- 4.1. Porters Five Forces
- 4.1.1. Bargaining Power of Suppliers
- 4.1.2. Bargaining Power of Buyers
- 4.1.3. Threat of New Entrants
- 4.1.4. Threat of Substitutes
- 4.1.5. Competitive Rivalry
- 4.2. PESTEL analysis
- 4.3. BCG Analysis
- 4.3.1. Stars (High Growth, High Market Share)
- 4.3.2. Cash Cows (Low Growth, High Market Share)
- 4.3.3. Question Mark (High Growth, Low Market Share)
- 4.3.4. Dogs (Low Growth, Low Market Share)
- 4.4. Ansoff Matrix Analysis
- 4.5. Supply Chain Analysis
- 4.6. Regulatory Landscape
- 4.7. Current Market Potential and Opportunity Assessment (TAM–SAM–SOM Framework)
- 4.8. PRI Analyst Note
- 4.1. Porters Five Forces
- 5. Market Analysis, Insights and Forecast 2021-2033
- 5.1. Market Analysis, Insights and Forecast - by Type
- 5.1.1. Helium
- 5.1.2. Krypton
- 5.1.3. Argon
- 5.1.4. Neon
- 5.1.5. Xenon
- 5.1.6. Radioactive Radon
- 5.2. Market Analysis, Insights and Forecast - by Application
- 5.2.1. Picture Projection
- 5.2.2. Anesthetic
- 5.2.3. Welding
- 5.2.4. Insulation
- 5.2.5. Lighting
- 5.2.6. Television Tubes
- 5.2.7. Advertising
- 5.2.8. Refrigerant
- 5.2.9. Working Fluid
- 5.2.10. Chemical Analysis
- 5.3. Market Analysis, Insights and Forecast - by End-user Industry
- 5.3.1. Oil and Gas
- 5.3.2. Mining
- 5.3.3. Healthcare
- 5.3.4. Aerospace
- 5.3.5. Construction
- 5.3.6. Energy and Power
- 5.4. Market Analysis, Insights and Forecast - by Region
- 5.4.1. Asia Pacific
- 5.4.2. North America
- 5.4.3. Europe
- 5.4.4. South America
- 5.4.5. Middle East
- 5.4.6. Saudi Arabia
- 5.1. Market Analysis, Insights and Forecast - by Type
- 6. Global Noble Gas Market Analysis, Insights and Forecast, 2021-2033
- 6.1. Market Analysis, Insights and Forecast - by Type
- 6.1.1. Helium
- 6.1.2. Krypton
- 6.1.3. Argon
- 6.1.4. Neon
- 6.1.5. Xenon
- 6.1.6. Radioactive Radon
- 6.2. Market Analysis, Insights and Forecast - by Application
- 6.2.1. Picture Projection
- 6.2.2. Anesthetic
- 6.2.3. Welding
- 6.2.4. Insulation
- 6.2.5. Lighting
- 6.2.6. Television Tubes
- 6.2.7. Advertising
- 6.2.8. Refrigerant
- 6.2.9. Working Fluid
- 6.2.10. Chemical Analysis
- 6.3. Market Analysis, Insights and Forecast - by End-user Industry
- 6.3.1. Oil and Gas
- 6.3.2. Mining
- 6.3.3. Healthcare
- 6.3.4. Aerospace
- 6.3.5. Construction
- 6.3.6. Energy and Power
- 6.1. Market Analysis, Insights and Forecast - by Type
- 7. Asia Pacific Noble Gas Market Analysis, Insights and Forecast, 2020-2032
- 7.1. Market Analysis, Insights and Forecast - by Type
- 7.1.1. Helium
- 7.1.2. Krypton
- 7.1.3. Argon
- 7.1.4. Neon
- 7.1.5. Xenon
- 7.1.6. Radioactive Radon
- 7.2. Market Analysis, Insights and Forecast - by Application
- 7.2.1. Picture Projection
- 7.2.2. Anesthetic
- 7.2.3. Welding
- 7.2.4. Insulation
- 7.2.5. Lighting
- 7.2.6. Television Tubes
- 7.2.7. Advertising
- 7.2.8. Refrigerant
- 7.2.9. Working Fluid
- 7.2.10. Chemical Analysis
- 7.3. Market Analysis, Insights and Forecast - by End-user Industry
- 7.3.1. Oil and Gas
- 7.3.2. Mining
- 7.3.3. Healthcare
- 7.3.4. Aerospace
- 7.3.5. Construction
- 7.3.6. Energy and Power
- 7.1. Market Analysis, Insights and Forecast - by Type
- 8. North America Noble Gas Market Analysis, Insights and Forecast, 2020-2032
- 8.1. Market Analysis, Insights and Forecast - by Type
- 8.1.1. Helium
- 8.1.2. Krypton
- 8.1.3. Argon
- 8.1.4. Neon
- 8.1.5. Xenon
- 8.1.6. Radioactive Radon
- 8.2. Market Analysis, Insights and Forecast - by Application
- 8.2.1. Picture Projection
- 8.2.2. Anesthetic
- 8.2.3. Welding
- 8.2.4. Insulation
- 8.2.5. Lighting
- 8.2.6. Television Tubes
- 8.2.7. Advertising
- 8.2.8. Refrigerant
- 8.2.9. Working Fluid
- 8.2.10. Chemical Analysis
- 8.3. Market Analysis, Insights and Forecast - by End-user Industry
- 8.3.1. Oil and Gas
- 8.3.2. Mining
- 8.3.3. Healthcare
- 8.3.4. Aerospace
- 8.3.5. Construction
- 8.3.6. Energy and Power
- 8.1. Market Analysis, Insights and Forecast - by Type
- 9. Europe Noble Gas Market Analysis, Insights and Forecast, 2020-2032
- 9.1. Market Analysis, Insights and Forecast - by Type
- 9.1.1. Helium
- 9.1.2. Krypton
- 9.1.3. Argon
- 9.1.4. Neon
- 9.1.5. Xenon
- 9.1.6. Radioactive Radon
- 9.2. Market Analysis, Insights and Forecast - by Application
- 9.2.1. Picture Projection
- 9.2.2. Anesthetic
- 9.2.3. Welding
- 9.2.4. Insulation
- 9.2.5. Lighting
- 9.2.6. Television Tubes
- 9.2.7. Advertising
- 9.2.8. Refrigerant
- 9.2.9. Working Fluid
- 9.2.10. Chemical Analysis
- 9.3. Market Analysis, Insights and Forecast - by End-user Industry
- 9.3.1. Oil and Gas
- 9.3.2. Mining
- 9.3.3. Healthcare
- 9.3.4. Aerospace
- 9.3.5. Construction
- 9.3.6. Energy and Power
- 9.1. Market Analysis, Insights and Forecast - by Type
- 10. South America Noble Gas Market Analysis, Insights and Forecast, 2020-2032
- 10.1. Market Analysis, Insights and Forecast - by Type
- 10.1.1. Helium
- 10.1.2. Krypton
- 10.1.3. Argon
- 10.1.4. Neon
- 10.1.5. Xenon
- 10.1.6. Radioactive Radon
- 10.2. Market Analysis, Insights and Forecast - by Application
- 10.2.1. Picture Projection
- 10.2.2. Anesthetic
- 10.2.3. Welding
- 10.2.4. Insulation
- 10.2.5. Lighting
- 10.2.6. Television Tubes
- 10.2.7. Advertising
- 10.2.8. Refrigerant
- 10.2.9. Working Fluid
- 10.2.10. Chemical Analysis
- 10.3. Market Analysis, Insights and Forecast - by End-user Industry
- 10.3.1. Oil and Gas
- 10.3.2. Mining
- 10.3.3. Healthcare
- 10.3.4. Aerospace
- 10.3.5. Construction
- 10.3.6. Energy and Power
- 10.1. Market Analysis, Insights and Forecast - by Type
- 11. Middle East Noble Gas Market Analysis, Insights and Forecast, 2020-2032
- 11.1. Market Analysis, Insights and Forecast - by Type
- 11.1.1. Helium
- 11.1.2. Krypton
- 11.1.3. Argon
- 11.1.4. Neon
- 11.1.5. Xenon
- 11.1.6. Radioactive Radon
- 11.2. Market Analysis, Insights and Forecast - by Application
- 11.2.1. Picture Projection
- 11.2.2. Anesthetic
- 11.2.3. Welding
- 11.2.4. Insulation
- 11.2.5. Lighting
- 11.2.6. Television Tubes
- 11.2.7. Advertising
- 11.2.8. Refrigerant
- 11.2.9. Working Fluid
- 11.2.10. Chemical Analysis
- 11.3. Market Analysis, Insights and Forecast - by End-user Industry
- 11.3.1. Oil and Gas
- 11.3.2. Mining
- 11.3.3. Healthcare
- 11.3.4. Aerospace
- 11.3.5. Construction
- 11.3.6. Energy and Power
- 11.1. Market Analysis, Insights and Forecast - by Type
- 12. Saudi Arabia Noble Gas Market Analysis, Insights and Forecast, 2020-2032
- 12.1. Market Analysis, Insights and Forecast - by Type
- 12.1.1. Helium
- 12.1.2. Krypton
- 12.1.3. Argon
- 12.1.4. Neon
- 12.1.5. Xenon
- 12.1.6. Radioactive Radon
- 12.2. Market Analysis, Insights and Forecast - by Application
- 12.2.1. Picture Projection
- 12.2.2. Anesthetic
- 12.2.3. Welding
- 12.2.4. Insulation
- 12.2.5. Lighting
- 12.2.6. Television Tubes
- 12.2.7. Advertising
- 12.2.8. Refrigerant
- 12.2.9. Working Fluid
- 12.2.10. Chemical Analysis
- 12.3. Market Analysis, Insights and Forecast - by End-user Industry
- 12.3.1. Oil and Gas
- 12.3.2. Mining
- 12.3.3. Healthcare
- 12.3.4. Aerospace
- 12.3.5. Construction
- 12.3.6. Energy and Power
- 12.1. Market Analysis, Insights and Forecast - by Type
- 13. Competitive Analysis
- 13.1. Company Profiles
- 13.1.1 Air Products and Chemicals Inc
- 13.1.1.1. Company Overview
- 13.1.1.2. Products
- 13.1.1.3. Company Financials
- 13.1.1.4. SWOT Analysis
- 13.1.2 Messer North America Inc
- 13.1.2.1. Company Overview
- 13.1.2.2. Products
- 13.1.2.3. Company Financials
- 13.1.2.4. SWOT Analysis
- 13.1.3 Gulf Cryo
- 13.1.3.1. Company Overview
- 13.1.3.2. Products
- 13.1.3.3. Company Financials
- 13.1.3.4. SWOT Analysis
- 13.1.4 Ras Gas Company Limited
- 13.1.4.1. Company Overview
- 13.1.4.2. Products
- 13.1.4.3. Company Financials
- 13.1.4.4. SWOT Analysis
- 13.1.5 Praxair Technology Inc
- 13.1.5.1. Company Overview
- 13.1.5.2. Products
- 13.1.5.3. Company Financials
- 13.1.5.4. SWOT Analysis
- 13.1.6 BASF SE
- 13.1.6.1. Company Overview
- 13.1.6.2. Products
- 13.1.6.3. Company Financials
- 13.1.6.4. SWOT Analysis
- 13.1.7 ITM Power
- 13.1.7.1. Company Overview
- 13.1.7.2. Products
- 13.1.7.3. Company Financials
- 13.1.7.4. SWOT Analysis
- 13.1.8 Linde plc
- 13.1.8.1. Company Overview
- 13.1.8.2. Products
- 13.1.8.3. Company Financials
- 13.1.8.4. SWOT Analysis
- 13.1.9 American Gas
- 13.1.9.1. Company Overview
- 13.1.9.2. Products
- 13.1.9.3. Company Financials
- 13.1.9.4. SWOT Analysis
- 13.1.10 TAIYO NIPPON SANSO CORPORATION*List Not Exhaustive
- 13.1.10.1. Company Overview
- 13.1.10.2. Products
- 13.1.10.3. Company Financials
- 13.1.10.4. SWOT Analysis
- 13.1.11 Royal Dutch Shell PLC
- 13.1.11.1. Company Overview
- 13.1.11.2. Products
- 13.1.11.3. Company Financials
- 13.1.11.4. SWOT Analysis
- 13.1.12 Buzwair Industrial Gases Factories
- 13.1.12.1. Company Overview
- 13.1.12.2. Products
- 13.1.12.3. Company Financials
- 13.1.12.4. SWOT Analysis
- 13.1.13 Air Liquide
- 13.1.13.1. Company Overview
- 13.1.13.2. Products
- 13.1.13.3. Company Financials
- 13.1.13.4. SWOT Analysis
- 13.1.14 Airgas Inc
- 13.1.14.1. Company Overview
- 13.1.14.2. Products
- 13.1.14.3. Company Financials
- 13.1.14.4. SWOT Analysis
- 13.1.1 Air Products and Chemicals Inc
- 13.2. Market Entropy
- 13.2.1 Company's Key Areas Served
- 13.2.2 Recent Developments
- 13.3. Company Market Share Analysis 2025
- 13.3.1 Top 5 Companies Market Share Analysis
- 13.3.2 Top 3 Companies Market Share Analysis
- 13.4. List of Potential Customers
- 14. Research Methodology
List of Figures
- Figure 1: Global Noble Gas Market Revenue Breakdown (Million, %) by Region 2025 & 2033
- Figure 2: Global Noble Gas Market Volume Breakdown (K Tons, %) by Region 2025 & 2033
- Figure 3: Asia Pacific Noble Gas Market Revenue (Million), by Type 2025 & 2033
- Figure 4: Asia Pacific Noble Gas Market Volume (K Tons), by Type 2025 & 2033
- Figure 5: Asia Pacific Noble Gas Market Revenue Share (%), by Type 2025 & 2033
- Figure 6: Asia Pacific Noble Gas Market Volume Share (%), by Type 2025 & 2033
- Figure 7: Asia Pacific Noble Gas Market Revenue (Million), by Application 2025 & 2033
- Figure 8: Asia Pacific Noble Gas Market Volume (K Tons), by Application 2025 & 2033
- Figure 9: Asia Pacific Noble Gas Market Revenue Share (%), by Application 2025 & 2033
- Figure 10: Asia Pacific Noble Gas Market Volume Share (%), by Application 2025 & 2033
- Figure 11: Asia Pacific Noble Gas Market Revenue (Million), by End-user Industry 2025 & 2033
- Figure 12: Asia Pacific Noble Gas Market Volume (K Tons), by End-user Industry 2025 & 2033
- Figure 13: Asia Pacific Noble Gas Market Revenue Share (%), by End-user Industry 2025 & 2033
- Figure 14: Asia Pacific Noble Gas Market Volume Share (%), by End-user Industry 2025 & 2033
- Figure 15: Asia Pacific Noble Gas Market Revenue (Million), by Country 2025 & 2033
- Figure 16: Asia Pacific Noble Gas Market Volume (K Tons), by Country 2025 & 2033
- Figure 17: Asia Pacific Noble Gas Market Revenue Share (%), by Country 2025 & 2033
- Figure 18: Asia Pacific Noble Gas Market Volume Share (%), by Country 2025 & 2033
- Figure 19: North America Noble Gas Market Revenue (Million), by Type 2025 & 2033
- Figure 20: North America Noble Gas Market Volume (K Tons), by Type 2025 & 2033
- Figure 21: North America Noble Gas Market Revenue Share (%), by Type 2025 & 2033
- Figure 22: North America Noble Gas Market Volume Share (%), by Type 2025 & 2033
- Figure 23: North America Noble Gas Market Revenue (Million), by Application 2025 & 2033
- Figure 24: North America Noble Gas Market Volume (K Tons), by Application 2025 & 2033
- Figure 25: North America Noble Gas Market Revenue Share (%), by Application 2025 & 2033
- Figure 26: North America Noble Gas Market Volume Share (%), by Application 2025 & 2033
- Figure 27: North America Noble Gas Market Revenue (Million), by End-user Industry 2025 & 2033
- Figure 28: North America Noble Gas Market Volume (K Tons), by End-user Industry 2025 & 2033
- Figure 29: North America Noble Gas Market Revenue Share (%), by End-user Industry 2025 & 2033
- Figure 30: North America Noble Gas Market Volume Share (%), by End-user Industry 2025 & 2033
- Figure 31: North America Noble Gas Market Revenue (Million), by Country 2025 & 2033
- Figure 32: North America Noble Gas Market Volume (K Tons), by Country 2025 & 2033
- Figure 33: North America Noble Gas Market Revenue Share (%), by Country 2025 & 2033
- Figure 34: North America Noble Gas Market Volume Share (%), by Country 2025 & 2033
- Figure 35: Europe Noble Gas Market Revenue (Million), by Type 2025 & 2033
- Figure 36: Europe Noble Gas Market Volume (K Tons), by Type 2025 & 2033
- Figure 37: Europe Noble Gas Market Revenue Share (%), by Type 2025 & 2033
- Figure 38: Europe Noble Gas Market Volume Share (%), by Type 2025 & 2033
- Figure 39: Europe Noble Gas Market Revenue (Million), by Application 2025 & 2033
- Figure 40: Europe Noble Gas Market Volume (K Tons), by Application 2025 & 2033
- Figure 41: Europe Noble Gas Market Revenue Share (%), by Application 2025 & 2033
- Figure 42: Europe Noble Gas Market Volume Share (%), by Application 2025 & 2033
- Figure 43: Europe Noble Gas Market Revenue (Million), by End-user Industry 2025 & 2033
- Figure 44: Europe Noble Gas Market Volume (K Tons), by End-user Industry 2025 & 2033
- Figure 45: Europe Noble Gas Market Revenue Share (%), by End-user Industry 2025 & 2033
- Figure 46: Europe Noble Gas Market Volume Share (%), by End-user Industry 2025 & 2033
- Figure 47: Europe Noble Gas Market Revenue (Million), by Country 2025 & 2033
- Figure 48: Europe Noble Gas Market Volume (K Tons), by Country 2025 & 2033
- Figure 49: Europe Noble Gas Market Revenue Share (%), by Country 2025 & 2033
- Figure 50: Europe Noble Gas Market Volume Share (%), by Country 2025 & 2033
- Figure 51: South America Noble Gas Market Revenue (Million), by Type 2025 & 2033
- Figure 52: South America Noble Gas Market Volume (K Tons), by Type 2025 & 2033
- Figure 53: South America Noble Gas Market Revenue Share (%), by Type 2025 & 2033
- Figure 54: South America Noble Gas Market Volume Share (%), by Type 2025 & 2033
- Figure 55: South America Noble Gas Market Revenue (Million), by Application 2025 & 2033
- Figure 56: South America Noble Gas Market Volume (K Tons), by Application 2025 & 2033
- Figure 57: South America Noble Gas Market Revenue Share (%), by Application 2025 & 2033
- Figure 58: South America Noble Gas Market Volume Share (%), by Application 2025 & 2033
- Figure 59: South America Noble Gas Market Revenue (Million), by End-user Industry 2025 & 2033
- Figure 60: South America Noble Gas Market Volume (K Tons), by End-user Industry 2025 & 2033
- Figure 61: South America Noble Gas Market Revenue Share (%), by End-user Industry 2025 & 2033
- Figure 62: South America Noble Gas Market Volume Share (%), by End-user Industry 2025 & 2033
- Figure 63: South America Noble Gas Market Revenue (Million), by Country 2025 & 2033
- Figure 64: South America Noble Gas Market Volume (K Tons), by Country 2025 & 2033
- Figure 65: South America Noble Gas Market Revenue Share (%), by Country 2025 & 2033
- Figure 66: South America Noble Gas Market Volume Share (%), by Country 2025 & 2033
- Figure 67: Middle East Noble Gas Market Revenue (Million), by Type 2025 & 2033
- Figure 68: Middle East Noble Gas Market Volume (K Tons), by Type 2025 & 2033
- Figure 69: Middle East Noble Gas Market Revenue Share (%), by Type 2025 & 2033
- Figure 70: Middle East Noble Gas Market Volume Share (%), by Type 2025 & 2033
- Figure 71: Middle East Noble Gas Market Revenue (Million), by Application 2025 & 2033
- Figure 72: Middle East Noble Gas Market Volume (K Tons), by Application 2025 & 2033
- Figure 73: Middle East Noble Gas Market Revenue Share (%), by Application 2025 & 2033
- Figure 74: Middle East Noble Gas Market Volume Share (%), by Application 2025 & 2033
- Figure 75: Middle East Noble Gas Market Revenue (Million), by End-user Industry 2025 & 2033
- Figure 76: Middle East Noble Gas Market Volume (K Tons), by End-user Industry 2025 & 2033
- Figure 77: Middle East Noble Gas Market Revenue Share (%), by End-user Industry 2025 & 2033
- Figure 78: Middle East Noble Gas Market Volume Share (%), by End-user Industry 2025 & 2033
- Figure 79: Middle East Noble Gas Market Revenue (Million), by Country 2025 & 2033
- Figure 80: Middle East Noble Gas Market Volume (K Tons), by Country 2025 & 2033
- Figure 81: Middle East Noble Gas Market Revenue Share (%), by Country 2025 & 2033
- Figure 82: Middle East Noble Gas Market Volume Share (%), by Country 2025 & 2033
- Figure 83: Saudi Arabia Noble Gas Market Revenue (Million), by Type 2025 & 2033
- Figure 84: Saudi Arabia Noble Gas Market Volume (K Tons), by Type 2025 & 2033
- Figure 85: Saudi Arabia Noble Gas Market Revenue Share (%), by Type 2025 & 2033
- Figure 86: Saudi Arabia Noble Gas Market Volume Share (%), by Type 2025 & 2033
- Figure 87: Saudi Arabia Noble Gas Market Revenue (Million), by Application 2025 & 2033
- Figure 88: Saudi Arabia Noble Gas Market Volume (K Tons), by Application 2025 & 2033
- Figure 89: Saudi Arabia Noble Gas Market Revenue Share (%), by Application 2025 & 2033
- Figure 90: Saudi Arabia Noble Gas Market Volume Share (%), by Application 2025 & 2033
- Figure 91: Saudi Arabia Noble Gas Market Revenue (Million), by End-user Industry 2025 & 2033
- Figure 92: Saudi Arabia Noble Gas Market Volume (K Tons), by End-user Industry 2025 & 2033
- Figure 93: Saudi Arabia Noble Gas Market Revenue Share (%), by End-user Industry 2025 & 2033
- Figure 94: Saudi Arabia Noble Gas Market Volume Share (%), by End-user Industry 2025 & 2033
- Figure 95: Saudi Arabia Noble Gas Market Revenue (Million), by Country 2025 & 2033
- Figure 96: Saudi Arabia Noble Gas Market Volume (K Tons), by Country 2025 & 2033
- Figure 97: Saudi Arabia Noble Gas Market Revenue Share (%), by Country 2025 & 2033
- Figure 98: Saudi Arabia Noble Gas Market Volume Share (%), by Country 2025 & 2033
List of Tables
- Table 1: Global Noble Gas Market Revenue Million Forecast, by Type 2020 & 2033
- Table 2: Global Noble Gas Market Volume K Tons Forecast, by Type 2020 & 2033
- Table 3: Global Noble Gas Market Revenue Million Forecast, by Application 2020 & 2033
- Table 4: Global Noble Gas Market Volume K Tons Forecast, by Application 2020 & 2033
- Table 5: Global Noble Gas Market Revenue Million Forecast, by End-user Industry 2020 & 2033
- Table 6: Global Noble Gas Market Volume K Tons Forecast, by End-user Industry 2020 & 2033
- Table 7: Global Noble Gas Market Revenue Million Forecast, by Region 2020 & 2033
- Table 8: Global Noble Gas Market Volume K Tons Forecast, by Region 2020 & 2033
- Table 9: Global Noble Gas Market Revenue Million Forecast, by Type 2020 & 2033
- Table 10: Global Noble Gas Market Volume K Tons Forecast, by Type 2020 & 2033
- Table 11: Global Noble Gas Market Revenue Million Forecast, by Application 2020 & 2033
- Table 12: Global Noble Gas Market Volume K Tons Forecast, by Application 2020 & 2033
- Table 13: Global Noble Gas Market Revenue Million Forecast, by End-user Industry 2020 & 2033
- Table 14: Global Noble Gas Market Volume K Tons Forecast, by End-user Industry 2020 & 2033
- Table 15: Global Noble Gas Market Revenue Million Forecast, by Country 2020 & 2033
- Table 16: Global Noble Gas Market Volume K Tons Forecast, by Country 2020 & 2033
- Table 17: China Noble Gas Market Revenue (Million) Forecast, by Application 2020 & 2033
- Table 18: China Noble Gas Market Volume (K Tons) Forecast, by Application 2020 & 2033
- Table 19: India Noble Gas Market Revenue (Million) Forecast, by Application 2020 & 2033
- Table 20: India Noble Gas Market Volume (K Tons) Forecast, by Application 2020 & 2033
- Table 21: Japan Noble Gas Market Revenue (Million) Forecast, by Application 2020 & 2033
- Table 22: Japan Noble Gas Market Volume (K Tons) Forecast, by Application 2020 & 2033
- Table 23: South Korea Noble Gas Market Revenue (Million) Forecast, by Application 2020 & 2033
- Table 24: South Korea Noble Gas Market Volume (K Tons) Forecast, by Application 2020 & 2033
- Table 25: Rest of Asia Pacific Noble Gas Market Revenue (Million) Forecast, by Application 2020 & 2033
- Table 26: Rest of Asia Pacific Noble Gas Market Volume (K Tons) Forecast, by Application 2020 & 2033
- Table 27: Global Noble Gas Market Revenue Million Forecast, by Type 2020 & 2033
- Table 28: Global Noble Gas Market Volume K Tons Forecast, by Type 2020 & 2033
- Table 29: Global Noble Gas Market Revenue Million Forecast, by Application 2020 & 2033
- Table 30: Global Noble Gas Market Volume K Tons Forecast, by Application 2020 & 2033
- Table 31: Global Noble Gas Market Revenue Million Forecast, by End-user Industry 2020 & 2033
- Table 32: Global Noble Gas Market Volume K Tons Forecast, by End-user Industry 2020 & 2033
- Table 33: Global Noble Gas Market Revenue Million Forecast, by Country 2020 & 2033
- Table 34: Global Noble Gas Market Volume K Tons Forecast, by Country 2020 & 2033
- Table 35: United States Noble Gas Market Revenue (Million) Forecast, by Application 2020 & 2033
- Table 36: United States Noble Gas Market Volume (K Tons) Forecast, by Application 2020 & 2033
- Table 37: Canada Noble Gas Market Revenue (Million) Forecast, by Application 2020 & 2033
- Table 38: Canada Noble Gas Market Volume (K Tons) Forecast, by Application 2020 & 2033
- Table 39: Mexico Noble Gas Market Revenue (Million) Forecast, by Application 2020 & 2033
- Table 40: Mexico Noble Gas Market Volume (K Tons) Forecast, by Application 2020 & 2033
- Table 41: Global Noble Gas Market Revenue Million Forecast, by Type 2020 & 2033
- Table 42: Global Noble Gas Market Volume K Tons Forecast, by Type 2020 & 2033
- Table 43: Global Noble Gas Market Revenue Million Forecast, by Application 2020 & 2033
- Table 44: Global Noble Gas Market Volume K Tons Forecast, by Application 2020 & 2033
- Table 45: Global Noble Gas Market Revenue Million Forecast, by End-user Industry 2020 & 2033
- Table 46: Global Noble Gas Market Volume K Tons Forecast, by End-user Industry 2020 & 2033
- Table 47: Global Noble Gas Market Revenue Million Forecast, by Country 2020 & 2033
- Table 48: Global Noble Gas Market Volume K Tons Forecast, by Country 2020 & 2033
- Table 49: Germany Noble Gas Market Revenue (Million) Forecast, by Application 2020 & 2033
- Table 50: Germany Noble Gas Market Volume (K Tons) Forecast, by Application 2020 & 2033
- Table 51: United Kingdom Noble Gas Market Revenue (Million) Forecast, by Application 2020 & 2033
- Table 52: United Kingdom Noble Gas Market Volume (K Tons) Forecast, by Application 2020 & 2033
- Table 53: Italy Noble Gas Market Revenue (Million) Forecast, by Application 2020 & 2033
- Table 54: Italy Noble Gas Market Volume (K Tons) Forecast, by Application 2020 & 2033
- Table 55: France Noble Gas Market Revenue (Million) Forecast, by Application 2020 & 2033
- Table 56: France Noble Gas Market Volume (K Tons) Forecast, by Application 2020 & 2033
- Table 57: Rest of Europe Noble Gas Market Revenue (Million) Forecast, by Application 2020 & 2033
- Table 58: Rest of Europe Noble Gas Market Volume (K Tons) Forecast, by Application 2020 & 2033
- Table 59: Global Noble Gas Market Revenue Million Forecast, by Type 2020 & 2033
- Table 60: Global Noble Gas Market Volume K Tons Forecast, by Type 2020 & 2033
- Table 61: Global Noble Gas Market Revenue Million Forecast, by Application 2020 & 2033
- Table 62: Global Noble Gas Market Volume K Tons Forecast, by Application 2020 & 2033
- Table 63: Global Noble Gas Market Revenue Million Forecast, by End-user Industry 2020 & 2033
- Table 64: Global Noble Gas Market Volume K Tons Forecast, by End-user Industry 2020 & 2033
- Table 65: Global Noble Gas Market Revenue Million Forecast, by Country 2020 & 2033
- Table 66: Global Noble Gas Market Volume K Tons Forecast, by Country 2020 & 2033
- Table 67: Brazil Noble Gas Market Revenue (Million) Forecast, by Application 2020 & 2033
- Table 68: Brazil Noble Gas Market Volume (K Tons) Forecast, by Application 2020 & 2033
- Table 69: Argentina Noble Gas Market Revenue (Million) Forecast, by Application 2020 & 2033
- Table 70: Argentina Noble Gas Market Volume (K Tons) Forecast, by Application 2020 & 2033
- Table 71: Rest of South America Noble Gas Market Revenue (Million) Forecast, by Application 2020 & 2033
- Table 72: Rest of South America Noble Gas Market Volume (K Tons) Forecast, by Application 2020 & 2033
- Table 73: Global Noble Gas Market Revenue Million Forecast, by Type 2020 & 2033
- Table 74: Global Noble Gas Market Volume K Tons Forecast, by Type 2020 & 2033
- Table 75: Global Noble Gas Market Revenue Million Forecast, by Application 2020 & 2033
- Table 76: Global Noble Gas Market Volume K Tons Forecast, by Application 2020 & 2033
- Table 77: Global Noble Gas Market Revenue Million Forecast, by End-user Industry 2020 & 2033
- Table 78: Global Noble Gas Market Volume K Tons Forecast, by End-user Industry 2020 & 2033
- Table 79: Global Noble Gas Market Revenue Million Forecast, by Country 2020 & 2033
- Table 80: Global Noble Gas Market Volume K Tons Forecast, by Country 2020 & 2033
- Table 81: Global Noble Gas Market Revenue Million Forecast, by Type 2020 & 2033
- Table 82: Global Noble Gas Market Volume K Tons Forecast, by Type 2020 & 2033
- Table 83: Global Noble Gas Market Revenue Million Forecast, by Application 2020 & 2033
- Table 84: Global Noble Gas Market Volume K Tons Forecast, by Application 2020 & 2033
- Table 85: Global Noble Gas Market Revenue Million Forecast, by End-user Industry 2020 & 2033
- Table 86: Global Noble Gas Market Volume K Tons Forecast, by End-user Industry 2020 & 2033
- Table 87: Global Noble Gas Market Revenue Million Forecast, by Country 2020 & 2033
- Table 88: Global Noble Gas Market Volume K Tons Forecast, by Country 2020 & 2033
- Table 89: South Africa Noble Gas Market Revenue (Million) Forecast, by Application 2020 & 2033
- Table 90: South Africa Noble Gas Market Volume (K Tons) Forecast, by Application 2020 & 2033
- Table 91: Rest of Middle East Noble Gas Market Revenue (Million) Forecast, by Application 2020 & 2033
- Table 92: Rest of Middle East Noble Gas Market Volume (K Tons) Forecast, by Application 2020 & 2033
Frequently Asked Questions
1. What is the projected Compound Annual Growth Rate (CAGR) of the Noble Gas Market?
The projected CAGR is approximately > 5.00%.
2. Which companies are prominent players in the Noble Gas Market?
Key companies in the market include Air Products and Chemicals Inc, Messer North America Inc, Gulf Cryo, Ras Gas Company Limited, Praxair Technology Inc, BASF SE, ITM Power, Linde plc, American Gas, TAIYO NIPPON SANSO CORPORATION*List Not Exhaustive, Royal Dutch Shell PLC, Buzwair Industrial Gases Factories, Air Liquide, Airgas Inc.
3. What are the main segments of the Noble Gas Market?
The market segments include Type, Application, End-user Industry.
4. Can you provide details about the market size?
The market size is estimated to be USD 43600 Million as of 2022.
5. What are some drivers contributing to market growth?
Growing Demand in the Healthcare Industry; Expansion of Steel and Automotive industry.
6. What are the notable trends driving market growth?
Increasing Demand from the Healthcare Industry.
7. Are there any restraints impacting market growth?
Fluctuating Prices of Noble gases; Need of high-efficient gas extracting method.
8. Can you provide examples of recent developments in the market?
April 2022: Linde signed an off-take agreement to recover the helium contained in Freeport LNG's production site in Texas (United States). Linde will also construct a helium processing plant for liquid helium in the United States.
9. What pricing options are available for accessing the report?
Pricing options include single-user, multi-user, and enterprise licenses priced at USD 4750, USD 5250, and USD 8750 respectively.
10. Is the market size provided in terms of value or volume?
The market size is provided in terms of value, measured in Million and volume, measured in K Tons.
11. Are there any specific market keywords associated with the report?
Yes, the market keyword associated with the report is "Noble Gas Market," which aids in identifying and referencing the specific market segment covered.
12. How do I determine which pricing option suits my needs best?
The pricing options vary based on user requirements and access needs. Individual users may opt for single-user licenses, while businesses requiring broader access may choose multi-user or enterprise licenses for cost-effective access to the report.
13. Are there any additional resources or data provided in the Noble Gas Market report?
While the report offers comprehensive insights, it's advisable to review the specific contents or supplementary materials provided to ascertain if additional resources or data are available.
14. How can I stay updated on further developments or reports in the Noble Gas Market?
To stay informed about further developments, trends, and reports in the Noble Gas Market, consider subscribing to industry newsletters, following relevant companies and organizations, or regularly checking reputable industry news sources and publications.
Methodology
Step 1 - Identification of Relevant Samples Size from Population Database


Step 2 - Approaches for Defining Global Market Size (Value, Volume* & Price*)

Note*: In applicable scenarios
Step 3 - Data Sources
Primary Research
- Web Analytics
- Survey Reports
- Research Institute
- Latest Research Reports
- Opinion Leaders
Secondary Research
- Annual Reports
- White Paper
- Latest Press Release
- Industry Association
- Paid Database
- Investor Presentations

Step 4 - Data Triangulation
Involves using different sources of information in order to increase the validity of a study
These sources are likely to be stakeholders in a program - participants, other researchers, program staff, other community members, and so on.
Then we put all data in single framework & apply various statistical tools to find out the dynamic on the market.
During the analysis stage, feedback from the stakeholder groups would be compared to determine areas of agreement as well as areas of divergence