

Key Insights
The global non-aeronautical airport services market is projected for substantial expansion, with a projected Compound Annual Growth Rate (CAGR) of 14.75%. This growth is propelled by escalating passenger traffic and a heightened demand for a comprehensive suite of airport-based services. The market is expected to reach a size of $9.17 billion by 2025. Key growth drivers include ongoing airport infrastructure development to accommodate rising passenger volumes and an increasing emphasis on enhancing the passenger experience through superior amenities and services. The escalating popularity of air travel, particularly in emerging economies, is fueling demand for retail, food and beverage, and other ancillary services. Technological advancements in baggage handling and passenger processing are further optimizing operations and efficiency, contributing to market growth.
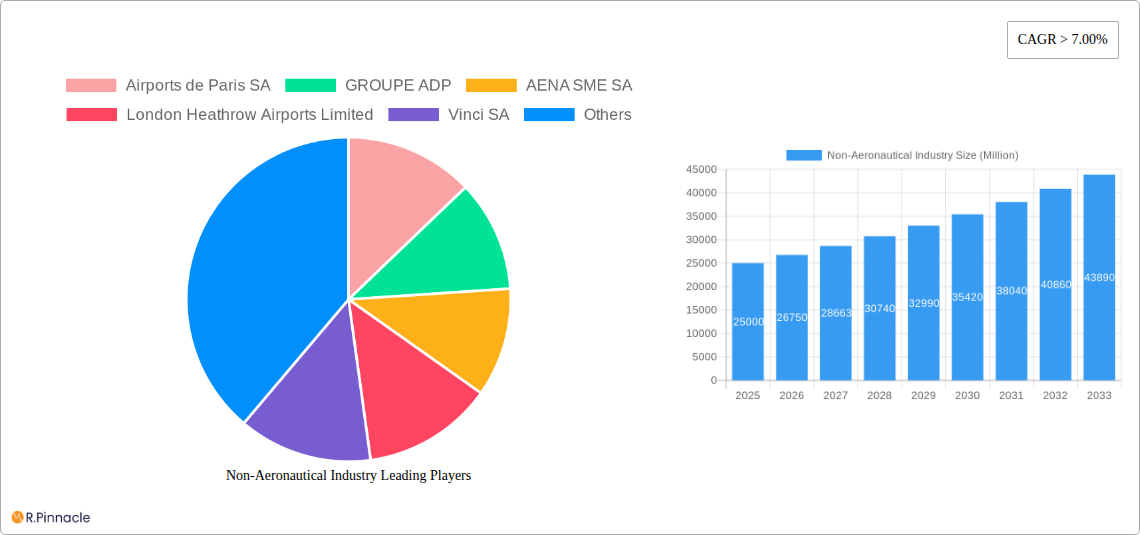
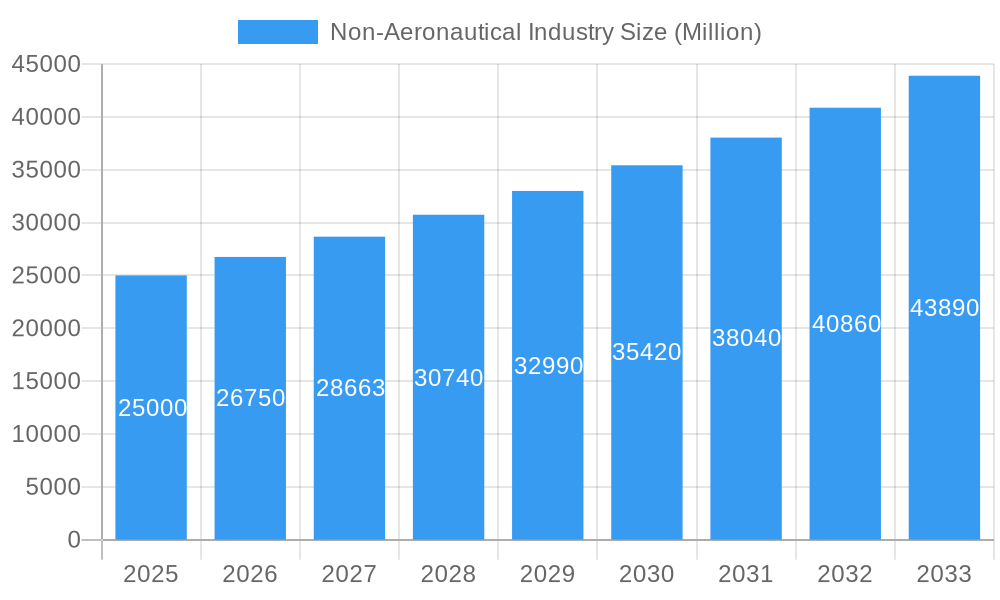
Non-Aeronautical Industry Market Size (In Billion)
The market exhibits significant contributions from food services and car rentals, alongside robust performance from baggage handling systems and other specialized services. Leading entities such as Airports de Paris SA, AENA SME SA, and Fraport Group are actively pursuing strategic investments in infrastructure and service diversification to leverage these opportunities. Geographically, North America and Europe currently dominate due to established infrastructure and high passenger volumes. However, the Asia-Pacific region is poised for rapid growth, driven by rising disposable incomes and a burgeoning middle class in key economies like China and India, supported by extensive airport expansion initiatives.
Non-Aeronautical Industry Company Market Share
While economic fluctuations and security concerns present potential challenges, the overall market outlook remains optimistic. The inherent necessity of airport services contributes to market resilience and long-term growth potential. Strategic partnerships and mergers & acquisitions are anticipated to influence the competitive landscape and market dynamics in the forthcoming period.
Non-Aeronautical Industry Market Report: 2019-2033 Forecast
Unlocking Growth Opportunities in the Thriving Non-Aeronautical Revenue Streams at Airports Globally
This comprehensive report provides an in-depth analysis of the global non-aeronautical industry, projecting a market valuation of $XX Million by 2033. The study period spans 2019-2033, with a base year of 2025 and a forecast period of 2025-2033. It offers actionable insights for industry professionals, investors, and stakeholders seeking to capitalize on the significant growth potential within this dynamic sector. The report covers key players like Airports de Paris SA, GROUPE ADP, AENA SME SA, London Heathrow Airports Limited, Vinci SA, Fraport Group, Korea Airports Corp, Airports of Thailand Plc, Airport Authority Hong Kong, and Japan Airport Terminal Co Ltd, analyzing their strategies and market positions.
Non-Aeronautical Industry Market Structure & Innovation Trends
The non-aeronautical industry exhibits a moderately concentrated market structure, with a few large players holding significant market share. For example, Airports de Paris SA and GROUPE ADP together hold an estimated xx% of the market in 2025. Innovation is driven by the need to enhance passenger experience, improve operational efficiency, and generate higher revenue streams. Key drivers include technological advancements (e.g., AI-powered passenger services, automated baggage handling), evolving consumer preferences (e.g., demand for personalized experiences, seamless digital integration), and increasing competition. Regulatory frameworks, including airport concessions and licensing policies, significantly influence market dynamics. Product substitution is limited, with service differentiation being the primary competitive strategy. M&A activity has been significant, with deal values exceeding $XX Million in the past five years, driven by a consolidation trend and expansion into new markets.
- Market Share (2025): Airports de Paris SA (xx%), GROUPE ADP (xx%), AENA SME SA (xx%), Others (xx%)
- M&A Deal Value (2019-2024): $XX Million
Non-Aeronautical Industry Market Dynamics & Trends
The non-aeronautical market is characterized by robust growth, driven primarily by increasing passenger traffic, rising disposable incomes, and the expansion of airport infrastructure globally. The market is expected to experience a Compound Annual Growth Rate (CAGR) of xx% during the forecast period (2025-2033). Technological disruptions, such as the adoption of mobile payments and self-service kiosks, are enhancing passenger convenience and operational efficiency. Consumer preferences are shifting toward personalized experiences and a seamless digital journey through the airport. Competitive dynamics are intensifying, with companies vying for market share through service innovation, strategic partnerships, and operational excellence. Market penetration of non-aeronautical revenue as a percentage of total airport revenue is projected to reach xx% by 2033.
Dominant Regions & Segments in Non-Aeronautical Industry
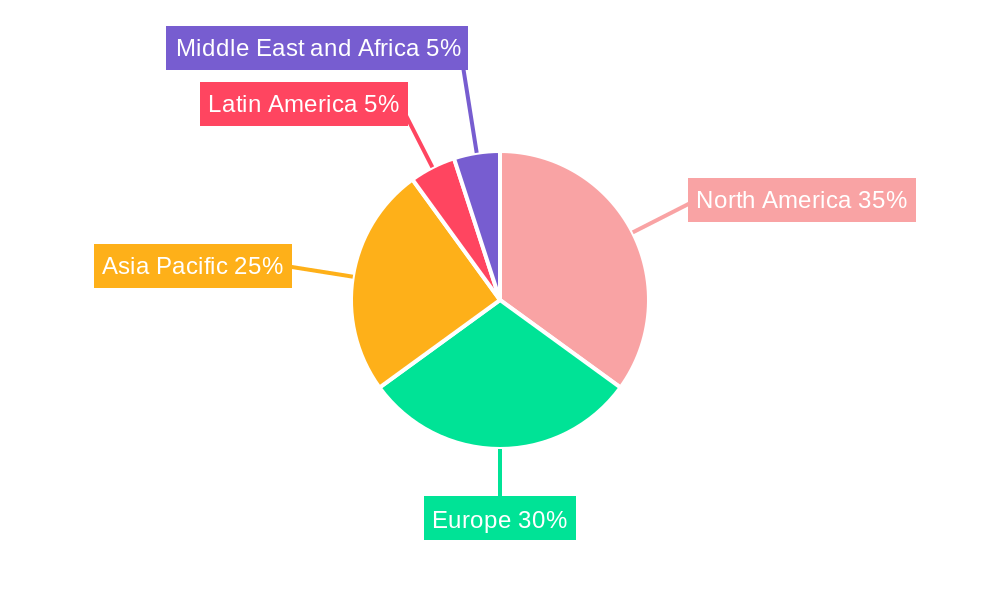
The North American and European regions currently dominate the non-aeronautical market, driven by high passenger volumes, well-developed airport infrastructure, and a strong focus on enhancing passenger experience. Within segments, Food Services and Car Rentals are the largest contributors to non-aeronautical revenue.
Key Drivers of Regional Dominance:
- North America: High disposable incomes, advanced technology adoption, large airport hubs.
- Europe: High tourist traffic, well-established airport infrastructure, robust regulatory frameworks.
Segment Analysis:
- Food Services: High demand for diverse dining options, increasing preference for branded restaurants.
- Car Rentals: High convenience for travelers, increasing car rental penetration rates.
- Baggage Handling Systems: Demand for efficient and reliable baggage handling, driven by increasing passenger traffic and technological advancements.
- Other Services: Growth is driven by a wide range of services catering to diverse passenger needs, such as retail, duty-free shops, and lounges. This segment is projected to experience the fastest growth due to its diversity and potential for innovation.
Non-Aeronautical Industry Product Innovations
Significant product innovations are shaping the non-aeronautical landscape, with a focus on enhancing passenger experience through technology. Biometric-based security systems, AI-powered customer service platforms, and personalized retail experiences are gaining traction. The integration of mobile technology for seamless payments and access to airport services is also transforming the customer journey, with a strong focus on sustainability and environmental responsibility.
Report Scope & Segmentation Analysis
This report segments the non-aeronautical market by services: Food Services, Car Rentals, Baggage Handling Systems, and Other Services. Each segment is analyzed based on market size, growth projections, and competitive dynamics. The Food Services segment is expected to dominate in terms of revenue, followed by Car Rentals and Baggage Handling Systems. The "Other Services" segment demonstrates significant growth potential due to its diverse nature and evolving consumer preferences.
Key Drivers of Non-Aeronautical Industry Growth
The non-aeronautical industry is experiencing robust growth fueled by several factors: increasing air passenger traffic, rising disposable incomes, advancements in technology (e.g., AI, mobile technology), the expansion of airport infrastructure, and government initiatives promoting tourism and economic development. Furthermore, increasing demand for convenience and personalized experiences amongst passengers drives growth across many segments.
Challenges in the Non-Aeronautical Industry Sector
The sector faces challenges such as stringent regulatory requirements, supply chain disruptions impacting product availability and pricing, and intense competition among service providers. These factors can lead to decreased profitability and hinder growth if not adequately managed. For example, unexpected increases in the costs of food imports, due to supply chain disruptions, could significantly impact the profitability of Food Services.
Emerging Opportunities in Non-Aeronautical Industry
Emerging opportunities abound, including the expansion into new markets, particularly in developing economies. The adoption of innovative technologies like AI, IoT, and Big Data analytics offers considerable potential for improving operational efficiency, enhancing customer experience, and developing new revenue streams. Sustainability initiatives are also gaining traction, presenting opportunities for environmentally friendly services and products.
Leading Players in the Non-Aeronautical Industry Market
- Airports de Paris SA
- GROUPE ADP
- AENA SME SA
- London Heathrow Airports Limited
- Vinci SA
- Fraport Group
- Korea Airports Corp
- Airports of Thailand Plc
- Airport Authority Hong Kong
- Japan Airport Terminal Co Ltd
Key Developments in Non-Aeronautical Industry Industry
- 2022 Q4: Launch of a new AI-powered passenger assistance system by Airports de Paris SA.
- 2023 Q1: Acquisition of a regional food services company by GROUPE ADP.
- 2023 Q3: Implementation of a new baggage handling system using robotics technology at London Heathrow.
Future Outlook for Non-Aeronautical Industry Market
The non-aeronautical industry is poised for continued growth, driven by the confluence of technological advancements, rising passenger traffic, and evolving consumer preferences. Strategic partnerships, investments in innovation, and a focus on sustainability will be crucial for companies seeking to capture market share and maximize returns in the coming years. The growing focus on creating seamless and personalized passenger journeys presents exciting growth avenues for the foreseeable future.
Non-Aeronautical Industry Segmentation
-
1. Services
- 1.1. Food Services
- 1.2. Car Rentals
- 1.3. Baggage Handling Systems
- 1.4. Other Services
Non-Aeronautical Industry Segmentation By Geography
-
1. North America
- 1.1. United States
- 1.2. Canada
-
2. Europe
- 2.1. Germany
- 2.2. United Kingdom
- 2.3. France
- 2.4. Russia
- 2.5. Rest of Europe
-
3. Asia Pacific
- 3.1. India
- 3.2. China
- 3.3. Japan
- 3.4. Rest of Asia Pacific
-
4. Latin America
- 4.1. Brazil
- 4.2. Rest of Latin America
-
5. Middle East and Africa
- 5.1. United Arab Emirates
- 5.2. Saudi Arabia
- 5.3. South Africa
- 5.4. Rest of Middle East and Africa
Non-Aeronautical Industry Regional Market Share
Geographic Coverage of Non-Aeronautical Industry
Non-Aeronautical Industry REPORT HIGHLIGHTS
| Aspects | Details |
|---|---|
| Study Period | 2020-2034 |
| Base Year | 2025 |
| Estimated Year | 2026 |
| Forecast Period | 2026-2034 |
| Historical Period | 2020-2025 |
| Growth Rate | CAGR of 14.75% from 2020-2034 |
| Segmentation |
|
Table of Contents
- 1. Introduction
- 1.1. Research Scope
- 1.2. Market Segmentation
- 1.3. Research Objective
- 1.4. Definitions and Assumptions
- 2. Executive Summary
- 2.1. Market Snapshot
- 3. Market Dynamics
- 3.1. Market Drivers
- 3.2. Market Restrains
- 3.3. Market Trends
- 3.4. Market Opportunities
- 4. Market Factor Analysis
- 4.1. Porters Five Forces
- 4.1.1. Bargaining Power of Suppliers
- 4.1.2. Bargaining Power of Buyers
- 4.1.3. Threat of New Entrants
- 4.1.4. Threat of Substitutes
- 4.1.5. Competitive Rivalry
- 4.2. PESTEL analysis
- 4.3. BCG Analysis
- 4.3.1. Stars (High Growth, High Market Share)
- 4.3.2. Cash Cows (Low Growth, High Market Share)
- 4.3.3. Question Mark (High Growth, Low Market Share)
- 4.3.4. Dogs (Low Growth, Low Market Share)
- 4.4. Ansoff Matrix Analysis
- 4.5. Supply Chain Analysis
- 4.6. Regulatory Landscape
- 4.7. Current Market Potential and Opportunity Assessment (TAM–SAM–SOM Framework)
- 4.8. PRI Analyst Note
- 4.1. Porters Five Forces
- 5. Market Analysis, Insights and Forecast 2021-2033
- 5.1. Market Analysis, Insights and Forecast - by Services
- 5.1.1. Food Services
- 5.1.2. Car Rentals
- 5.1.3. Baggage Handling Systems
- 5.1.4. Other Services
- 5.2. Market Analysis, Insights and Forecast - by Region
- 5.2.1. North America
- 5.2.2. Europe
- 5.2.3. Asia Pacific
- 5.2.4. Latin America
- 5.2.5. Middle East and Africa
- 5.1. Market Analysis, Insights and Forecast - by Services
- 6. Global Non-Aeronautical Industry Analysis, Insights and Forecast, 2021-2033
- 6.1. Market Analysis, Insights and Forecast - by Services
- 6.1.1. Food Services
- 6.1.2. Car Rentals
- 6.1.3. Baggage Handling Systems
- 6.1.4. Other Services
- 6.1. Market Analysis, Insights and Forecast - by Services
- 7. North America Non-Aeronautical Industry Analysis, Insights and Forecast, 2020-2032
- 7.1. Market Analysis, Insights and Forecast - by Services
- 7.1.1. Food Services
- 7.1.2. Car Rentals
- 7.1.3. Baggage Handling Systems
- 7.1.4. Other Services
- 7.1. Market Analysis, Insights and Forecast - by Services
- 8. Europe Non-Aeronautical Industry Analysis, Insights and Forecast, 2020-2032
- 8.1. Market Analysis, Insights and Forecast - by Services
- 8.1.1. Food Services
- 8.1.2. Car Rentals
- 8.1.3. Baggage Handling Systems
- 8.1.4. Other Services
- 8.1. Market Analysis, Insights and Forecast - by Services
- 9. Asia Pacific Non-Aeronautical Industry Analysis, Insights and Forecast, 2020-2032
- 9.1. Market Analysis, Insights and Forecast - by Services
- 9.1.1. Food Services
- 9.1.2. Car Rentals
- 9.1.3. Baggage Handling Systems
- 9.1.4. Other Services
- 9.1. Market Analysis, Insights and Forecast - by Services
- 10. Latin America Non-Aeronautical Industry Analysis, Insights and Forecast, 2020-2032
- 10.1. Market Analysis, Insights and Forecast - by Services
- 10.1.1. Food Services
- 10.1.2. Car Rentals
- 10.1.3. Baggage Handling Systems
- 10.1.4. Other Services
- 10.1. Market Analysis, Insights and Forecast - by Services
- 11. Middle East and Africa Non-Aeronautical Industry Analysis, Insights and Forecast, 2020-2032
- 11.1. Market Analysis, Insights and Forecast - by Services
- 11.1.1. Food Services
- 11.1.2. Car Rentals
- 11.1.3. Baggage Handling Systems
- 11.1.4. Other Services
- 11.1. Market Analysis, Insights and Forecast - by Services
- 12. Competitive Analysis
- 12.1. Company Profiles
- 12.1.1 Airports de Paris SA
- 12.1.1.1. Company Overview
- 12.1.1.2. Products
- 12.1.1.3. Company Financials
- 12.1.1.4. SWOT Analysis
- 12.1.2 GROUPE ADP
- 12.1.2.1. Company Overview
- 12.1.2.2. Products
- 12.1.2.3. Company Financials
- 12.1.2.4. SWOT Analysis
- 12.1.3 AENA SME SA
- 12.1.3.1. Company Overview
- 12.1.3.2. Products
- 12.1.3.3. Company Financials
- 12.1.3.4. SWOT Analysis
- 12.1.4 London Heathrow Airports Limited
- 12.1.4.1. Company Overview
- 12.1.4.2. Products
- 12.1.4.3. Company Financials
- 12.1.4.4. SWOT Analysis
- 12.1.5 Vinci SA
- 12.1.5.1. Company Overview
- 12.1.5.2. Products
- 12.1.5.3. Company Financials
- 12.1.5.4. SWOT Analysis
- 12.1.6 Fraport Group
- 12.1.6.1. Company Overview
- 12.1.6.2. Products
- 12.1.6.3. Company Financials
- 12.1.6.4. SWOT Analysis
- 12.1.7 Korea Airports Cor
- 12.1.7.1. Company Overview
- 12.1.7.2. Products
- 12.1.7.3. Company Financials
- 12.1.7.4. SWOT Analysis
- 12.1.8 Airports of Thailand Plc
- 12.1.8.1. Company Overview
- 12.1.8.2. Products
- 12.1.8.3. Company Financials
- 12.1.8.4. SWOT Analysis
- 12.1.9 Airport Authority Hong Kong
- 12.1.9.1. Company Overview
- 12.1.9.2. Products
- 12.1.9.3. Company Financials
- 12.1.9.4. SWOT Analysis
- 12.1.10 Japan Airport Terminal Co Ltd
- 12.1.10.1. Company Overview
- 12.1.10.2. Products
- 12.1.10.3. Company Financials
- 12.1.10.4. SWOT Analysis
- 12.1.1 Airports de Paris SA
- 12.2. Market Entropy
- 12.2.1 Company's Key Areas Served
- 12.2.2 Recent Developments
- 12.3. Company Market Share Analysis 2025
- 12.3.1 Top 5 Companies Market Share Analysis
- 12.3.2 Top 3 Companies Market Share Analysis
- 12.4. List of Potential Customers
- 13. Research Methodology
List of Figures
- Figure 1: Global Non-Aeronautical Industry Revenue Breakdown (billion, %) by Region 2025 & 2033
- Figure 2: North America Non-Aeronautical Industry Revenue (billion), by Services 2025 & 2033
- Figure 3: North America Non-Aeronautical Industry Revenue Share (%), by Services 2025 & 2033
- Figure 4: North America Non-Aeronautical Industry Revenue (billion), by Country 2025 & 2033
- Figure 5: North America Non-Aeronautical Industry Revenue Share (%), by Country 2025 & 2033
- Figure 6: Europe Non-Aeronautical Industry Revenue (billion), by Services 2025 & 2033
- Figure 7: Europe Non-Aeronautical Industry Revenue Share (%), by Services 2025 & 2033
- Figure 8: Europe Non-Aeronautical Industry Revenue (billion), by Country 2025 & 2033
- Figure 9: Europe Non-Aeronautical Industry Revenue Share (%), by Country 2025 & 2033
- Figure 10: Asia Pacific Non-Aeronautical Industry Revenue (billion), by Services 2025 & 2033
- Figure 11: Asia Pacific Non-Aeronautical Industry Revenue Share (%), by Services 2025 & 2033
- Figure 12: Asia Pacific Non-Aeronautical Industry Revenue (billion), by Country 2025 & 2033
- Figure 13: Asia Pacific Non-Aeronautical Industry Revenue Share (%), by Country 2025 & 2033
- Figure 14: Latin America Non-Aeronautical Industry Revenue (billion), by Services 2025 & 2033
- Figure 15: Latin America Non-Aeronautical Industry Revenue Share (%), by Services 2025 & 2033
- Figure 16: Latin America Non-Aeronautical Industry Revenue (billion), by Country 2025 & 2033
- Figure 17: Latin America Non-Aeronautical Industry Revenue Share (%), by Country 2025 & 2033
- Figure 18: Middle East and Africa Non-Aeronautical Industry Revenue (billion), by Services 2025 & 2033
- Figure 19: Middle East and Africa Non-Aeronautical Industry Revenue Share (%), by Services 2025 & 2033
- Figure 20: Middle East and Africa Non-Aeronautical Industry Revenue (billion), by Country 2025 & 2033
- Figure 21: Middle East and Africa Non-Aeronautical Industry Revenue Share (%), by Country 2025 & 2033
List of Tables
- Table 1: Global Non-Aeronautical Industry Revenue billion Forecast, by Services 2020 & 2033
- Table 2: Global Non-Aeronautical Industry Revenue billion Forecast, by Region 2020 & 2033
- Table 3: Global Non-Aeronautical Industry Revenue billion Forecast, by Services 2020 & 2033
- Table 4: Global Non-Aeronautical Industry Revenue billion Forecast, by Country 2020 & 2033
- Table 5: United States Non-Aeronautical Industry Revenue (billion) Forecast, by Application 2020 & 2033
- Table 6: Canada Non-Aeronautical Industry Revenue (billion) Forecast, by Application 2020 & 2033
- Table 7: Global Non-Aeronautical Industry Revenue billion Forecast, by Services 2020 & 2033
- Table 8: Global Non-Aeronautical Industry Revenue billion Forecast, by Country 2020 & 2033
- Table 9: Germany Non-Aeronautical Industry Revenue (billion) Forecast, by Application 2020 & 2033
- Table 10: United Kingdom Non-Aeronautical Industry Revenue (billion) Forecast, by Application 2020 & 2033
- Table 11: France Non-Aeronautical Industry Revenue (billion) Forecast, by Application 2020 & 2033
- Table 12: Russia Non-Aeronautical Industry Revenue (billion) Forecast, by Application 2020 & 2033
- Table 13: Rest of Europe Non-Aeronautical Industry Revenue (billion) Forecast, by Application 2020 & 2033
- Table 14: Global Non-Aeronautical Industry Revenue billion Forecast, by Services 2020 & 2033
- Table 15: Global Non-Aeronautical Industry Revenue billion Forecast, by Country 2020 & 2033
- Table 16: India Non-Aeronautical Industry Revenue (billion) Forecast, by Application 2020 & 2033
- Table 17: China Non-Aeronautical Industry Revenue (billion) Forecast, by Application 2020 & 2033
- Table 18: Japan Non-Aeronautical Industry Revenue (billion) Forecast, by Application 2020 & 2033
- Table 19: Rest of Asia Pacific Non-Aeronautical Industry Revenue (billion) Forecast, by Application 2020 & 2033
- Table 20: Global Non-Aeronautical Industry Revenue billion Forecast, by Services 2020 & 2033
- Table 21: Global Non-Aeronautical Industry Revenue billion Forecast, by Country 2020 & 2033
- Table 22: Brazil Non-Aeronautical Industry Revenue (billion) Forecast, by Application 2020 & 2033
- Table 23: Rest of Latin America Non-Aeronautical Industry Revenue (billion) Forecast, by Application 2020 & 2033
- Table 24: Global Non-Aeronautical Industry Revenue billion Forecast, by Services 2020 & 2033
- Table 25: Global Non-Aeronautical Industry Revenue billion Forecast, by Country 2020 & 2033
- Table 26: United Arab Emirates Non-Aeronautical Industry Revenue (billion) Forecast, by Application 2020 & 2033
- Table 27: Saudi Arabia Non-Aeronautical Industry Revenue (billion) Forecast, by Application 2020 & 2033
- Table 28: South Africa Non-Aeronautical Industry Revenue (billion) Forecast, by Application 2020 & 2033
- Table 29: Rest of Middle East and Africa Non-Aeronautical Industry Revenue (billion) Forecast, by Application 2020 & 2033
Frequently Asked Questions
1. What is the projected Compound Annual Growth Rate (CAGR) of the Non-Aeronautical Industry?
The projected CAGR is approximately 14.75%.
2. Which companies are prominent players in the Non-Aeronautical Industry?
Key companies in the market include Airports de Paris SA, GROUPE ADP, AENA SME SA, London Heathrow Airports Limited, Vinci SA, Fraport Group, Korea Airports Cor, Airports of Thailand Plc, Airport Authority Hong Kong, Japan Airport Terminal Co Ltd.
3. What are the main segments of the Non-Aeronautical Industry?
The market segments include Services.
4. Can you provide details about the market size?
The market size is estimated to be USD 9.17 billion as of 2022.
5. What are some drivers contributing to market growth?
N/A
6. What are the notable trends driving market growth?
Ground Handling Systems Will Showcase Significant Growth During the Forecast Period.
7. Are there any restraints impacting market growth?
N/A
8. Can you provide examples of recent developments in the market?
N/A
9. What pricing options are available for accessing the report?
Pricing options include single-user, multi-user, and enterprise licenses priced at USD 4750, USD 5250, and USD 8750 respectively.
10. Is the market size provided in terms of value or volume?
The market size is provided in terms of value, measured in billion.
11. Are there any specific market keywords associated with the report?
Yes, the market keyword associated with the report is "Non-Aeronautical Industry," which aids in identifying and referencing the specific market segment covered.
12. How do I determine which pricing option suits my needs best?
The pricing options vary based on user requirements and access needs. Individual users may opt for single-user licenses, while businesses requiring broader access may choose multi-user or enterprise licenses for cost-effective access to the report.
13. Are there any additional resources or data provided in the Non-Aeronautical Industry report?
While the report offers comprehensive insights, it's advisable to review the specific contents or supplementary materials provided to ascertain if additional resources or data are available.
14. How can I stay updated on further developments or reports in the Non-Aeronautical Industry?
To stay informed about further developments, trends, and reports in the Non-Aeronautical Industry, consider subscribing to industry newsletters, following relevant companies and organizations, or regularly checking reputable industry news sources and publications.
Methodology
Step 1 - Identification of Relevant Samples Size from Population Database


Step 2 - Approaches for Defining Global Market Size (Value, Volume* & Price*)

Note*: In applicable scenarios
Step 3 - Data Sources
Primary Research
- Web Analytics
- Survey Reports
- Research Institute
- Latest Research Reports
- Opinion Leaders
Secondary Research
- Annual Reports
- White Paper
- Latest Press Release
- Industry Association
- Paid Database
- Investor Presentations

Step 4 - Data Triangulation
Involves using different sources of information in order to increase the validity of a study
These sources are likely to be stakeholders in a program - participants, other researchers, program staff, other community members, and so on.
Then we put all data in single framework & apply various statistical tools to find out the dynamic on the market.
During the analysis stage, feedback from the stakeholder groups would be compared to determine areas of agreement as well as areas of divergence