

Key Insights
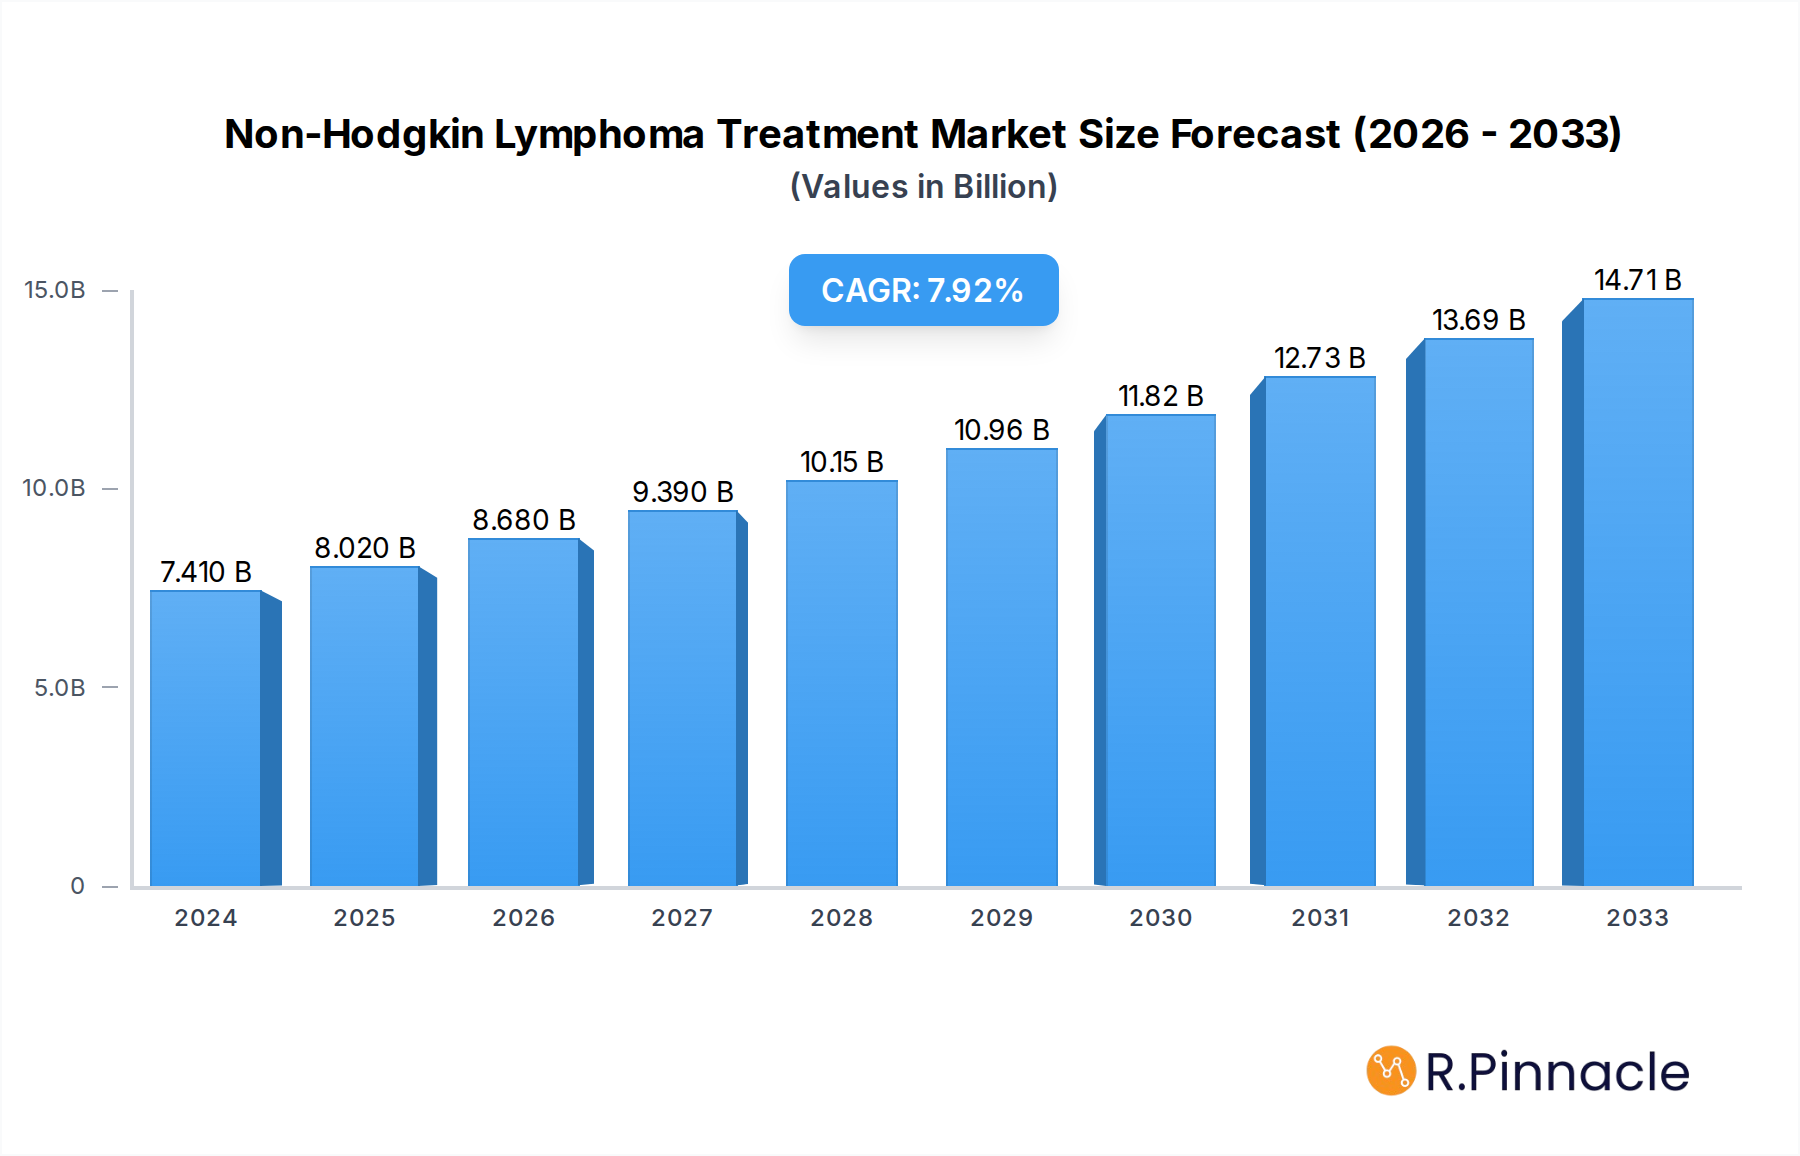
The Non-Hodgkin Lymphoma (NHL) treatment market is experiencing robust expansion, fueled by advancements in therapeutic modalities and a growing incidence of the disease globally. The market size was valued at approximately $7.41 billion in 2024, with a projected Compound Annual Growth Rate (CAGR) of 8.3% from 2025 to 2033. This impressive growth trajectory is primarily driven by the increasing adoption of targeted therapies and immunotherapies, which offer improved efficacy and reduced side effects compared to traditional chemotherapy. Technological innovations in diagnostics are also contributing to earlier and more accurate detection of NHL, leading to timely treatment initiation and better patient outcomes. Furthermore, a rising global cancer burden, coupled with increased healthcare expenditure and greater access to advanced medical treatments in emerging economies, are significant growth enablers. The development of novel drug delivery systems and personalized medicine approaches is also poised to further accelerate market expansion.

Non-Hodgkin Lymphoma Treatment Market Size (In Billion)
The NHL treatment landscape is being reshaped by evolving treatment paradigms and a focus on patient-centric care. While chemotherapy remains a cornerstone, the market is witnessing a significant shift towards more precise and less toxic treatments like immunotherapy (e.g., CAR T-cell therapy, monoclonal antibodies) and targeted therapy. These advanced treatments are demonstrating promising results in managing relapsed and refractory NHL. The market is segmented by application, with hospital pharmacies currently dominating due to complex treatment protocols and the need for specialized care, followed by retail and online pharmacies as accessibility and convenience become more critical. Key players like Takeda Pharmaceutical, AstraZeneca, Novartis, and Roche are heavily investing in research and development, focusing on pipeline expansion and strategic collaborations to capture market share. However, high treatment costs and the emergence of generic alternatives for older drugs could pose some challenges, although the introduction of innovative therapies is expected to outweigh these restraints, ensuring sustained market growth through 2033.
Non-Hodgkin Lymphoma Treatment Company Market Share
Unlocking the Future of Non-Hodgkin Lymphoma Treatment: A Comprehensive Market Analysis (2019–2033)
This in-depth report provides an indispensable analysis of the global Non-Hodgkin Lymphoma (NHL) treatment market, forecasting a robust growth trajectory driven by groundbreaking research, expanding treatment modalities, and increasing patient access. Covering the period from 2019 to 2033, with a base year of 2025, this report delves into the intricate dynamics, innovations, and strategic imperatives shaping this critical therapeutic area. Industry professionals will find actionable insights and data to inform strategic decision-making in an evolving healthcare landscape. The estimated market size for NHL treatments is projected to reach several billion dollars by 2025, with significant growth anticipated throughout the forecast period.
Non-Hodgkin Lymphoma Treatment Market Structure & Innovation Trends
The Non-Hodgkin Lymphoma treatment market is characterized by a moderate to high level of concentration, with key players like Takeda Pharmaceutical Company Limited, AstraZeneca, Novartis AG, Roche, and Bristol Myers Squibb Company holding substantial market shares, collectively representing billions in annual revenue. Innovation is a primary driver, fueled by advancements in immunotherapy and targeted therapy, leading to novel drug development pipelines and improved patient outcomes. Regulatory frameworks, overseen by bodies such as the FDA and EMA, play a crucial role in drug approval and market access, impacting the pace of innovation and the introduction of new therapies. Product substitutes, while evolving, primarily include different classes of chemotherapy and older forms of treatment, though their dominance is gradually diminishing with the advent of more effective novel agents. End-user demographics reveal a growing patient population, particularly in aging demographics, and increasing awareness of advanced treatment options. Mergers and acquisitions (M&A) activities are a significant aspect of market consolidation, with deal values in the billions of dollars as companies seek to expand their portfolios and market reach, securing their competitive positioning in this multi-billion dollar sector.
Non-Hodgkin Lymphoma Treatment Market Dynamics & Trends
The global Non-Hodgkin Lymphoma (NHL) treatment market is experiencing dynamic growth, projected to expand at a Compound Annual Growth Rate (CAGR) of over xx% from 2025 to 2033, reaching a market valuation in the billions. This surge is primarily propelled by a confluence of factors including the increasing global incidence of NHL, driven by an aging population and improved diagnostic capabilities. Advances in scientific understanding of lymphoma pathogenesis have paved the way for the development of highly effective immunotherapies, such as CAR T-cell therapy and monoclonal antibodies, which are revolutionizing treatment paradigms and offering significant improvements in survival rates and quality of life for patients. Targeted therapies, designed to attack specific molecular pathways crucial for cancer cell growth and survival, are also gaining considerable traction, offering more precise and less toxic treatment options compared to traditional chemotherapy.
Technological disruptions are at the forefront of this evolution. The integration of artificial intelligence (AI) and machine learning in drug discovery and development is accelerating the identification of novel therapeutic targets and the optimization of treatment regimens. Furthermore, personalized medicine approaches, leveraging genomic profiling of tumors, are becoming increasingly prevalent, enabling oncologists to tailor treatment strategies to individual patient profiles, thereby maximizing efficacy and minimizing side effects. This shift towards precision oncology is a key differentiator in the competitive landscape.
Consumer preferences are increasingly leaning towards treatments that offer better tolerability, convenience, and improved long-term outcomes. Patients and their caregivers are actively seeking information about the latest advancements and are playing a more active role in treatment decisions. This growing patient empowerment, coupled with the expanding reach of online health platforms and patient advocacy groups, is influencing market demand for innovative and less invasive therapies.
The competitive dynamics within the NHL treatment market are intense, characterized by significant R&D investments from major pharmaceutical and biotechnology companies. Strategic partnerships, licensing agreements, and mergers and acquisitions are common as companies vie for market leadership and expand their therapeutic portfolios. The market penetration of novel therapies, particularly immunotherapies and targeted agents, is steadily increasing, displacing older treatment modalities and contributing to the overall market expansion in the billions. The development of combination therapies, integrating different treatment classes, is also a significant trend, aiming to overcome resistance mechanisms and improve therapeutic response rates in complex NHL subtypes. The growing emphasis on real-world evidence generation to support the value proposition of new treatments is another crucial trend shaping market dynamics and influencing reimbursement decisions, further solidifying the market's multi-billion dollar valuation.
Dominant Regions & Segments in Non-Hodgkin Lymphoma Treatment
North America currently dominates the Non-Hodgkin Lymphoma (NHL) treatment market, with the United States leading in terms of market share and revenue, estimated to be in the billions. This dominance is attributed to several key drivers, including a high prevalence of NHL, advanced healthcare infrastructure, significant R&D investments in pharmaceutical innovation, and robust reimbursement policies that facilitate patient access to cutting-edge therapies. Economic policies in the region strongly support the development and commercialization of novel treatments, further bolstering market growth.
Key Drivers of Dominance in North America:
- Advanced Healthcare Infrastructure: The presence of world-class cancer research centers, hospitals, and specialized oncology clinics ensures high standards of care and access to the latest treatment modalities.
- High R&D Investment: Pharmaceutical and biotechnology companies in North America invest billions in research and development, leading to a continuous pipeline of innovative NHL treatments.
- Reimbursement Policies: Favorable reimbursement landscapes, particularly in the US, allow for broader patient access to expensive but highly effective novel therapies.
- Increased Awareness and Diagnosis: Growing patient awareness and sophisticated diagnostic tools contribute to earlier and more accurate diagnosis, leading to increased treatment initiation.
In terms of therapeutic types, Immunotherapy and Targeted Therapy are the fastest-growing and most dominant segments within the NHL treatment market, collectively accounting for billions in sales. These novel approaches are increasingly favored over traditional chemotherapy due to their enhanced efficacy and improved safety profiles.
Immunotherapy: This segment includes CAR T-cell therapies, monoclonal antibodies (e.g., rituximab, obinutuzumab), and checkpoint inhibitors. Their ability to harness the patient's immune system to fight cancer cells has led to remarkable clinical responses and long-term remissions in many NHL subtypes. The market for these therapies is experiencing exponential growth, driven by ongoing clinical trials and approvals for new indications.
Targeted Therapy: This segment encompasses drugs that target specific molecular pathways essential for the survival and proliferation of lymphoma cells. Examples include BTK inhibitors (e.g., ibrutinib, acalabrutinib) and BCL-2 inhibitors (e.g., venetoclax). These therapies offer a more personalized and less toxic approach to treatment, significantly improving patient outcomes and contributing billions to the market.
Within the Application segment, Hospital Pharmacies remain the primary distribution channel for NHL treatments, accounting for the largest share of the market, estimated in the billions. This is due to the complex nature of these treatments, often requiring specialized administration, monitoring, and management by healthcare professionals in an inpatient or outpatient hospital setting. Retail pharmacies and online pharmacies are increasingly playing a role in the distribution of oral chemotherapy and supportive care medications, but the advanced biologics and cell therapies predominantly find their home in hospital settings.
Non-Hodgkin Lymphoma Treatment Product Innovations
Recent product innovations in Non-Hodgkin Lymphoma (NHL) treatment are primarily focused on enhancing efficacy and minimizing toxicity. The development of novel CAR T-cell therapies with improved safety profiles and broader applicability across different NHL subtypes is a significant trend. Furthermore, advancements in antibody-drug conjugates (ADCs) and bispecific antibodies are offering new ways to target cancer cells with greater precision. These innovations are crucial for improving patient responses, achieving durable remissions, and addressing unmet needs in refractory or relapsed cases, thereby strengthening the market's multi-billion dollar valuation.
Report Scope & Segmentation Analysis
This report meticulously segments the Non-Hodgkin Lymphoma (NHL) treatment market by Application and Type. The Application segment encompasses Hospital Pharmacies, Retail Pharmacies, Online Pharmacies, and Others. Hospital Pharmacies are projected to hold the largest market share, driven by the administration of complex therapies. Retail Pharmacies and Online Pharmacies will see steady growth for oral medications and supportive care. The Type segment includes Immunotherapy, Targeted Therapy, Chemotherapy, and Others. Immunotherapy and Targeted Therapy are expected to exhibit the highest growth rates, with market sizes in the billions, due to their increasing clinical utility and improved patient outcomes. Chemotherapy will continue to be a significant segment but will experience a gradual decline in market share as novel agents become more prevalent.
Key Drivers of Non-Hodgkin Lymphoma Treatment Growth
The Non-Hodgkin Lymphoma (NHL) treatment market's significant growth, projected in the billions, is propelled by several key factors. Increasing global incidence rates of NHL, particularly in aging populations, directly translate to a larger patient pool requiring treatment. Advances in understanding lymphoma biology have led to a surge in R&D, resulting in the development of highly effective immunotherapies and targeted therapies that offer superior efficacy and improved tolerability compared to traditional chemotherapy. Favorable regulatory environments in major markets, coupled with robust reimbursement policies, facilitate market access for these innovative and often high-cost treatments. Furthermore, growing patient awareness and demand for personalized treatment approaches are influencing market dynamics.
Challenges in the Non-Hodgkin Lymphoma Treatment Sector
Despite its robust growth, the Non-Hodgkin Lymphoma (NHL) treatment sector faces several challenges that could impact its multi-billion dollar expansion. The high cost of novel therapies, particularly immunotherapies and CAR T-cell treatments, poses a significant barrier to access for many patients and healthcare systems, leading to debates around cost-effectiveness and value-based pricing. Stringent regulatory hurdles and lengthy approval processes for new drugs can delay market entry. Supply chain complexities for advanced biologics and the need for specialized manufacturing and cold chain logistics add to operational challenges. Intense competition among pharmaceutical companies, coupled with the looming threat of patent expirations and the rise of biosimil competition for established therapies, creates pricing pressures.
Emerging Opportunities in Non-Hodgkin Lymphoma Treatment
Emerging opportunities in the Non-Hodgkin Lymphoma (NHL) treatment market are poised to fuel its future growth into the billions. The development of novel combination therapies, synergistically integrating existing and emerging treatments, holds immense potential for improving outcomes in difficult-to-treat NHL subtypes. Expansion into emerging markets in Asia-Pacific and Latin America, where the incidence of NHL is rising and healthcare infrastructure is developing, presents significant untapped potential. Advances in liquid biopsy and companion diagnostics are enabling more precise patient stratification and personalized treatment selection, opening avenues for specialized therapies. Furthermore, the exploration of novel drug delivery systems and treatment modalities beyond traditional systemic therapies, such as localized treatments or combination with advanced radiation techniques, represents exciting future directions.
Leading Players in the Non-Hodgkin Lymphoma Treatment Market
- Takeda Pharmaceutical Company Limited
- AstraZeneca
- Bayer
- Novartis AG
- Gilead Sciences
- Spectrum Pharmaceuticals
- Teva Pharmaceutical Industries Ltd.
- Bristol Myers Squibb Company
- Janssen Pharmaceuticals
- Roche
- CELGENE CORPORATION (Bristol Myers Squibb Company)
- Merck & Co.,Inc.
- Kyowa Kirin Co.,Ltd.
- AbbVie
- Sanofi
Key Developments in Non-Hodgkin Lymphoma Treatment Industry
- 2023/2024: Approval of novel CAR T-cell therapies for additional relapsed or refractory NHL subtypes, expanding treatment options and market reach.
- 2023: Significant investments in R&D for next-generation bispecific antibodies and antibody-drug conjugates targeting various NHL cell surface markers.
- 2023: Launch of new oral targeted therapies for specific NHL genetic mutations, improving patient convenience and accessibility.
- 2022/2023: Mergers and acquisitions focused on consolidating portfolios of immunotherapy and targeted therapy assets, indicating strategic consolidation in the multi-billion dollar market.
- 2022: Increased focus on real-world evidence generation to demonstrate the long-term value and cost-effectiveness of advanced NHL treatments.
- 2021/2022: Advancements in combination therapies, exploring synergistic effects of different drug classes to overcome treatment resistance.
- 2021: Growing penetration of biosimil rituximab in key markets, impacting pricing dynamics and market share of originator products.
Future Outlook for Non-Hodgkin Lymphoma Treatment Market
The future outlook for the Non-Hodgkin Lymphoma (NHL) treatment market is exceptionally bright, with continued strong growth anticipated to push its valuation into the multi-billions. The sustained development of innovative immunotherapies and targeted therapies, coupled with personalized medicine approaches, will remain central to this expansion. The increasing adoption of these advanced treatments in emerging markets and the exploration of novel combination strategies to address treatment resistance will further accelerate market growth. Investments in R&D, strategic collaborations, and a focus on improving patient access and affordability will be critical for sustained success in this dynamic and life-saving therapeutic area.
Non-Hodgkin Lymphoma Treatment Segmentation
-
1. Application
- 1.1. Hospital Pharmacies
- 1.2. Retail Pharmacies
- 1.3. Online Pharmacies
- 1.4. Others
-
2. Types
- 2.1. Immunotherapy
- 2.2. Targeted Therapy
- 2.3. Chemotherapy
- 2.4. Others
Non-Hodgkin Lymphoma Treatment Segmentation By Geography
-
1. North America
- 1.1. United States
- 1.2. Canada
- 1.3. Mexico
-
2. South America
- 2.1. Brazil
- 2.2. Argentina
- 2.3. Rest of South America
-
3. Europe
- 3.1. United Kingdom
- 3.2. Germany
- 3.3. France
- 3.4. Italy
- 3.5. Spain
- 3.6. Russia
- 3.7. Benelux
- 3.8. Nordics
- 3.9. Rest of Europe
-
4. Middle East & Africa
- 4.1. Turkey
- 4.2. Israel
- 4.3. GCC
- 4.4. North Africa
- 4.5. South Africa
- 4.6. Rest of Middle East & Africa
-
5. Asia Pacific
- 5.1. China
- 5.2. India
- 5.3. Japan
- 5.4. South Korea
- 5.5. ASEAN
- 5.6. Oceania
- 5.7. Rest of Asia Pacific

Non-Hodgkin Lymphoma Treatment Regional Market Share
Geographic Coverage of Non-Hodgkin Lymphoma Treatment
Non-Hodgkin Lymphoma Treatment REPORT HIGHLIGHTS
| Aspects | Details |
|---|---|
| Study Period | 2020-2034 |
| Base Year | 2025 |
| Estimated Year | 2026 |
| Forecast Period | 2026-2034 |
| Historical Period | 2020-2025 |
| Growth Rate | CAGR of 8.3% from 2020-2034 |
| Segmentation |
|
Table of Contents
- 1. Introduction
- 1.1. Research Scope
- 1.2. Market Segmentation
- 1.3. Research Methodology
- 1.4. Definitions and Assumptions
- 2. Executive Summary
- 2.1. Introduction
- 3. Market Dynamics
- 3.1. Introduction
- 3.2. Market Drivers
- 3.3. Market Restrains
- 3.4. Market Trends
- 4. Market Factor Analysis
- 4.1. Porters Five Forces
- 4.2. Supply/Value Chain
- 4.3. PESTEL analysis
- 4.4. Market Entropy
- 4.5. Patent/Trademark Analysis
- 5. Global Non-Hodgkin Lymphoma Treatment Analysis, Insights and Forecast, 2020-2032
- 5.1. Market Analysis, Insights and Forecast - by Application
- 5.1.1. Hospital Pharmacies
- 5.1.2. Retail Pharmacies
- 5.1.3. Online Pharmacies
- 5.1.4. Others
- 5.2. Market Analysis, Insights and Forecast - by Types
- 5.2.1. Immunotherapy
- 5.2.2. Targeted Therapy
- 5.2.3. Chemotherapy
- 5.2.4. Others
- 5.3. Market Analysis, Insights and Forecast - by Region
- 5.3.1. North America
- 5.3.2. South America
- 5.3.3. Europe
- 5.3.4. Middle East & Africa
- 5.3.5. Asia Pacific
- 5.1. Market Analysis, Insights and Forecast - by Application
- 6. North America Non-Hodgkin Lymphoma Treatment Analysis, Insights and Forecast, 2020-2032
- 6.1. Market Analysis, Insights and Forecast - by Application
- 6.1.1. Hospital Pharmacies
- 6.1.2. Retail Pharmacies
- 6.1.3. Online Pharmacies
- 6.1.4. Others
- 6.2. Market Analysis, Insights and Forecast - by Types
- 6.2.1. Immunotherapy
- 6.2.2. Targeted Therapy
- 6.2.3. Chemotherapy
- 6.2.4. Others
- 6.1. Market Analysis, Insights and Forecast - by Application
- 7. South America Non-Hodgkin Lymphoma Treatment Analysis, Insights and Forecast, 2020-2032
- 7.1. Market Analysis, Insights and Forecast - by Application
- 7.1.1. Hospital Pharmacies
- 7.1.2. Retail Pharmacies
- 7.1.3. Online Pharmacies
- 7.1.4. Others
- 7.2. Market Analysis, Insights and Forecast - by Types
- 7.2.1. Immunotherapy
- 7.2.2. Targeted Therapy
- 7.2.3. Chemotherapy
- 7.2.4. Others
- 7.1. Market Analysis, Insights and Forecast - by Application
- 8. Europe Non-Hodgkin Lymphoma Treatment Analysis, Insights and Forecast, 2020-2032
- 8.1. Market Analysis, Insights and Forecast - by Application
- 8.1.1. Hospital Pharmacies
- 8.1.2. Retail Pharmacies
- 8.1.3. Online Pharmacies
- 8.1.4. Others
- 8.2. Market Analysis, Insights and Forecast - by Types
- 8.2.1. Immunotherapy
- 8.2.2. Targeted Therapy
- 8.2.3. Chemotherapy
- 8.2.4. Others
- 8.1. Market Analysis, Insights and Forecast - by Application
- 9. Middle East & Africa Non-Hodgkin Lymphoma Treatment Analysis, Insights and Forecast, 2020-2032
- 9.1. Market Analysis, Insights and Forecast - by Application
- 9.1.1. Hospital Pharmacies
- 9.1.2. Retail Pharmacies
- 9.1.3. Online Pharmacies
- 9.1.4. Others
- 9.2. Market Analysis, Insights and Forecast - by Types
- 9.2.1. Immunotherapy
- 9.2.2. Targeted Therapy
- 9.2.3. Chemotherapy
- 9.2.4. Others
- 9.1. Market Analysis, Insights and Forecast - by Application
- 10. Asia Pacific Non-Hodgkin Lymphoma Treatment Analysis, Insights and Forecast, 2020-2032
- 10.1. Market Analysis, Insights and Forecast - by Application
- 10.1.1. Hospital Pharmacies
- 10.1.2. Retail Pharmacies
- 10.1.3. Online Pharmacies
- 10.1.4. Others
- 10.2. Market Analysis, Insights and Forecast - by Types
- 10.2.1. Immunotherapy
- 10.2.2. Targeted Therapy
- 10.2.3. Chemotherapy
- 10.2.4. Others
- 10.1. Market Analysis, Insights and Forecast - by Application
- 11. Competitive Analysis
- 11.1. Global Market Share Analysis 2025
- 11.2. Company Profiles
- 11.2.1 Takeda Pharmaceutical Company Limited
- 11.2.1.1. Overview
- 11.2.1.2. Products
- 11.2.1.3. SWOT Analysis
- 11.2.1.4. Recent Developments
- 11.2.1.5. Financials (Based on Availability)
- 11.2.2 AstraZeneca
- 11.2.2.1. Overview
- 11.2.2.2. Products
- 11.2.2.3. SWOT Analysis
- 11.2.2.4. Recent Developments
- 11.2.2.5. Financials (Based on Availability)
- 11.2.3 Bayer
- 11.2.3.1. Overview
- 11.2.3.2. Products
- 11.2.3.3. SWOT Analysis
- 11.2.3.4. Recent Developments
- 11.2.3.5. Financials (Based on Availability)
- 11.2.4 Novartis AG
- 11.2.4.1. Overview
- 11.2.4.2. Products
- 11.2.4.3. SWOT Analysis
- 11.2.4.4. Recent Developments
- 11.2.4.5. Financials (Based on Availability)
- 11.2.5 Gilead Sciences
- 11.2.5.1. Overview
- 11.2.5.2. Products
- 11.2.5.3. SWOT Analysis
- 11.2.5.4. Recent Developments
- 11.2.5.5. Financials (Based on Availability)
- 11.2.6 Spectrum Pharmaceuticals
- 11.2.6.1. Overview
- 11.2.6.2. Products
- 11.2.6.3. SWOT Analysis
- 11.2.6.4. Recent Developments
- 11.2.6.5. Financials (Based on Availability)
- 11.2.7 Teva Pharmaceutical Industries Ltd.
- 11.2.7.1. Overview
- 11.2.7.2. Products
- 11.2.7.3. SWOT Analysis
- 11.2.7.4. Recent Developments
- 11.2.7.5. Financials (Based on Availability)
- 11.2.8 Bristol Myers Squibb Company
- 11.2.8.1. Overview
- 11.2.8.2. Products
- 11.2.8.3. SWOT Analysis
- 11.2.8.4. Recent Developments
- 11.2.8.5. Financials (Based on Availability)
- 11.2.9 Janssen Pharmaceuticals
- 11.2.9.1. Overview
- 11.2.9.2. Products
- 11.2.9.3. SWOT Analysis
- 11.2.9.4. Recent Developments
- 11.2.9.5. Financials (Based on Availability)
- 11.2.10 Roche
- 11.2.10.1. Overview
- 11.2.10.2. Products
- 11.2.10.3. SWOT Analysis
- 11.2.10.4. Recent Developments
- 11.2.10.5. Financials (Based on Availability)
- 11.2.11 CELGENE CORPORATION (Bristol Myers Squibb Company)
- 11.2.11.1. Overview
- 11.2.11.2. Products
- 11.2.11.3. SWOT Analysis
- 11.2.11.4. Recent Developments
- 11.2.11.5. Financials (Based on Availability)
- 11.2.12 Merck & Co.
- 11.2.12.1. Overview
- 11.2.12.2. Products
- 11.2.12.3. SWOT Analysis
- 11.2.12.4. Recent Developments
- 11.2.12.5. Financials (Based on Availability)
- 11.2.13 Inc.
- 11.2.13.1. Overview
- 11.2.13.2. Products
- 11.2.13.3. SWOT Analysis
- 11.2.13.4. Recent Developments
- 11.2.13.5. Financials (Based on Availability)
- 11.2.14 Kyowa Kirin Co.
- 11.2.14.1. Overview
- 11.2.14.2. Products
- 11.2.14.3. SWOT Analysis
- 11.2.14.4. Recent Developments
- 11.2.14.5. Financials (Based on Availability)
- 11.2.15 Ltd.
- 11.2.15.1. Overview
- 11.2.15.2. Products
- 11.2.15.3. SWOT Analysis
- 11.2.15.4. Recent Developments
- 11.2.15.5. Financials (Based on Availability)
- 11.2.16 AbbVie
- 11.2.16.1. Overview
- 11.2.16.2. Products
- 11.2.16.3. SWOT Analysis
- 11.2.16.4. Recent Developments
- 11.2.16.5. Financials (Based on Availability)
- 11.2.17 Sanofi
- 11.2.17.1. Overview
- 11.2.17.2. Products
- 11.2.17.3. SWOT Analysis
- 11.2.17.4. Recent Developments
- 11.2.17.5. Financials (Based on Availability)
- 11.2.1 Takeda Pharmaceutical Company Limited
List of Figures
- Figure 1: Global Non-Hodgkin Lymphoma Treatment Revenue Breakdown (undefined, %) by Region 2025 & 2033
- Figure 2: North America Non-Hodgkin Lymphoma Treatment Revenue (undefined), by Application 2025 & 2033
- Figure 3: North America Non-Hodgkin Lymphoma Treatment Revenue Share (%), by Application 2025 & 2033
- Figure 4: North America Non-Hodgkin Lymphoma Treatment Revenue (undefined), by Types 2025 & 2033
- Figure 5: North America Non-Hodgkin Lymphoma Treatment Revenue Share (%), by Types 2025 & 2033
- Figure 6: North America Non-Hodgkin Lymphoma Treatment Revenue (undefined), by Country 2025 & 2033
- Figure 7: North America Non-Hodgkin Lymphoma Treatment Revenue Share (%), by Country 2025 & 2033
- Figure 8: South America Non-Hodgkin Lymphoma Treatment Revenue (undefined), by Application 2025 & 2033
- Figure 9: South America Non-Hodgkin Lymphoma Treatment Revenue Share (%), by Application 2025 & 2033
- Figure 10: South America Non-Hodgkin Lymphoma Treatment Revenue (undefined), by Types 2025 & 2033
- Figure 11: South America Non-Hodgkin Lymphoma Treatment Revenue Share (%), by Types 2025 & 2033
- Figure 12: South America Non-Hodgkin Lymphoma Treatment Revenue (undefined), by Country 2025 & 2033
- Figure 13: South America Non-Hodgkin Lymphoma Treatment Revenue Share (%), by Country 2025 & 2033
- Figure 14: Europe Non-Hodgkin Lymphoma Treatment Revenue (undefined), by Application 2025 & 2033
- Figure 15: Europe Non-Hodgkin Lymphoma Treatment Revenue Share (%), by Application 2025 & 2033
- Figure 16: Europe Non-Hodgkin Lymphoma Treatment Revenue (undefined), by Types 2025 & 2033
- Figure 17: Europe Non-Hodgkin Lymphoma Treatment Revenue Share (%), by Types 2025 & 2033
- Figure 18: Europe Non-Hodgkin Lymphoma Treatment Revenue (undefined), by Country 2025 & 2033
- Figure 19: Europe Non-Hodgkin Lymphoma Treatment Revenue Share (%), by Country 2025 & 2033
- Figure 20: Middle East & Africa Non-Hodgkin Lymphoma Treatment Revenue (undefined), by Application 2025 & 2033
- Figure 21: Middle East & Africa Non-Hodgkin Lymphoma Treatment Revenue Share (%), by Application 2025 & 2033
- Figure 22: Middle East & Africa Non-Hodgkin Lymphoma Treatment Revenue (undefined), by Types 2025 & 2033
- Figure 23: Middle East & Africa Non-Hodgkin Lymphoma Treatment Revenue Share (%), by Types 2025 & 2033
- Figure 24: Middle East & Africa Non-Hodgkin Lymphoma Treatment Revenue (undefined), by Country 2025 & 2033
- Figure 25: Middle East & Africa Non-Hodgkin Lymphoma Treatment Revenue Share (%), by Country 2025 & 2033
- Figure 26: Asia Pacific Non-Hodgkin Lymphoma Treatment Revenue (undefined), by Application 2025 & 2033
- Figure 27: Asia Pacific Non-Hodgkin Lymphoma Treatment Revenue Share (%), by Application 2025 & 2033
- Figure 28: Asia Pacific Non-Hodgkin Lymphoma Treatment Revenue (undefined), by Types 2025 & 2033
- Figure 29: Asia Pacific Non-Hodgkin Lymphoma Treatment Revenue Share (%), by Types 2025 & 2033
- Figure 30: Asia Pacific Non-Hodgkin Lymphoma Treatment Revenue (undefined), by Country 2025 & 2033
- Figure 31: Asia Pacific Non-Hodgkin Lymphoma Treatment Revenue Share (%), by Country 2025 & 2033
List of Tables
- Table 1: Global Non-Hodgkin Lymphoma Treatment Revenue undefined Forecast, by Application 2020 & 2033
- Table 2: Global Non-Hodgkin Lymphoma Treatment Revenue undefined Forecast, by Types 2020 & 2033
- Table 3: Global Non-Hodgkin Lymphoma Treatment Revenue undefined Forecast, by Region 2020 & 2033
- Table 4: Global Non-Hodgkin Lymphoma Treatment Revenue undefined Forecast, by Application 2020 & 2033
- Table 5: Global Non-Hodgkin Lymphoma Treatment Revenue undefined Forecast, by Types 2020 & 2033
- Table 6: Global Non-Hodgkin Lymphoma Treatment Revenue undefined Forecast, by Country 2020 & 2033
- Table 7: United States Non-Hodgkin Lymphoma Treatment Revenue (undefined) Forecast, by Application 2020 & 2033
- Table 8: Canada Non-Hodgkin Lymphoma Treatment Revenue (undefined) Forecast, by Application 2020 & 2033
- Table 9: Mexico Non-Hodgkin Lymphoma Treatment Revenue (undefined) Forecast, by Application 2020 & 2033
- Table 10: Global Non-Hodgkin Lymphoma Treatment Revenue undefined Forecast, by Application 2020 & 2033
- Table 11: Global Non-Hodgkin Lymphoma Treatment Revenue undefined Forecast, by Types 2020 & 2033
- Table 12: Global Non-Hodgkin Lymphoma Treatment Revenue undefined Forecast, by Country 2020 & 2033
- Table 13: Brazil Non-Hodgkin Lymphoma Treatment Revenue (undefined) Forecast, by Application 2020 & 2033
- Table 14: Argentina Non-Hodgkin Lymphoma Treatment Revenue (undefined) Forecast, by Application 2020 & 2033
- Table 15: Rest of South America Non-Hodgkin Lymphoma Treatment Revenue (undefined) Forecast, by Application 2020 & 2033
- Table 16: Global Non-Hodgkin Lymphoma Treatment Revenue undefined Forecast, by Application 2020 & 2033
- Table 17: Global Non-Hodgkin Lymphoma Treatment Revenue undefined Forecast, by Types 2020 & 2033
- Table 18: Global Non-Hodgkin Lymphoma Treatment Revenue undefined Forecast, by Country 2020 & 2033
- Table 19: United Kingdom Non-Hodgkin Lymphoma Treatment Revenue (undefined) Forecast, by Application 2020 & 2033
- Table 20: Germany Non-Hodgkin Lymphoma Treatment Revenue (undefined) Forecast, by Application 2020 & 2033
- Table 21: France Non-Hodgkin Lymphoma Treatment Revenue (undefined) Forecast, by Application 2020 & 2033
- Table 22: Italy Non-Hodgkin Lymphoma Treatment Revenue (undefined) Forecast, by Application 2020 & 2033
- Table 23: Spain Non-Hodgkin Lymphoma Treatment Revenue (undefined) Forecast, by Application 2020 & 2033
- Table 24: Russia Non-Hodgkin Lymphoma Treatment Revenue (undefined) Forecast, by Application 2020 & 2033
- Table 25: Benelux Non-Hodgkin Lymphoma Treatment Revenue (undefined) Forecast, by Application 2020 & 2033
- Table 26: Nordics Non-Hodgkin Lymphoma Treatment Revenue (undefined) Forecast, by Application 2020 & 2033
- Table 27: Rest of Europe Non-Hodgkin Lymphoma Treatment Revenue (undefined) Forecast, by Application 2020 & 2033
- Table 28: Global Non-Hodgkin Lymphoma Treatment Revenue undefined Forecast, by Application 2020 & 2033
- Table 29: Global Non-Hodgkin Lymphoma Treatment Revenue undefined Forecast, by Types 2020 & 2033
- Table 30: Global Non-Hodgkin Lymphoma Treatment Revenue undefined Forecast, by Country 2020 & 2033
- Table 31: Turkey Non-Hodgkin Lymphoma Treatment Revenue (undefined) Forecast, by Application 2020 & 2033
- Table 32: Israel Non-Hodgkin Lymphoma Treatment Revenue (undefined) Forecast, by Application 2020 & 2033
- Table 33: GCC Non-Hodgkin Lymphoma Treatment Revenue (undefined) Forecast, by Application 2020 & 2033
- Table 34: North Africa Non-Hodgkin Lymphoma Treatment Revenue (undefined) Forecast, by Application 2020 & 2033
- Table 35: South Africa Non-Hodgkin Lymphoma Treatment Revenue (undefined) Forecast, by Application 2020 & 2033
- Table 36: Rest of Middle East & Africa Non-Hodgkin Lymphoma Treatment Revenue (undefined) Forecast, by Application 2020 & 2033
- Table 37: Global Non-Hodgkin Lymphoma Treatment Revenue undefined Forecast, by Application 2020 & 2033
- Table 38: Global Non-Hodgkin Lymphoma Treatment Revenue undefined Forecast, by Types 2020 & 2033
- Table 39: Global Non-Hodgkin Lymphoma Treatment Revenue undefined Forecast, by Country 2020 & 2033
- Table 40: China Non-Hodgkin Lymphoma Treatment Revenue (undefined) Forecast, by Application 2020 & 2033
- Table 41: India Non-Hodgkin Lymphoma Treatment Revenue (undefined) Forecast, by Application 2020 & 2033
- Table 42: Japan Non-Hodgkin Lymphoma Treatment Revenue (undefined) Forecast, by Application 2020 & 2033
- Table 43: South Korea Non-Hodgkin Lymphoma Treatment Revenue (undefined) Forecast, by Application 2020 & 2033
- Table 44: ASEAN Non-Hodgkin Lymphoma Treatment Revenue (undefined) Forecast, by Application 2020 & 2033
- Table 45: Oceania Non-Hodgkin Lymphoma Treatment Revenue (undefined) Forecast, by Application 2020 & 2033
- Table 46: Rest of Asia Pacific Non-Hodgkin Lymphoma Treatment Revenue (undefined) Forecast, by Application 2020 & 2033
Frequently Asked Questions
1. What is the projected Compound Annual Growth Rate (CAGR) of the Non-Hodgkin Lymphoma Treatment?
The projected CAGR is approximately 8.3%.
2. Which companies are prominent players in the Non-Hodgkin Lymphoma Treatment?
Key companies in the market include Takeda Pharmaceutical Company Limited, AstraZeneca, Bayer, Novartis AG, Gilead Sciences, Spectrum Pharmaceuticals, Teva Pharmaceutical Industries Ltd., Bristol Myers Squibb Company, Janssen Pharmaceuticals, Roche, CELGENE CORPORATION (Bristol Myers Squibb Company), Merck & Co., Inc., Kyowa Kirin Co., Ltd., AbbVie, Sanofi.
3. What are the main segments of the Non-Hodgkin Lymphoma Treatment?
The market segments include Application, Types.
4. Can you provide details about the market size?
The market size is estimated to be USD XXX N/A as of 2022.
5. What are some drivers contributing to market growth?
N/A
6. What are the notable trends driving market growth?
N/A
7. Are there any restraints impacting market growth?
N/A
8. Can you provide examples of recent developments in the market?
N/A
9. What pricing options are available for accessing the report?
Pricing options include single-user, multi-user, and enterprise licenses priced at USD 2900.00, USD 4350.00, and USD 5800.00 respectively.
10. Is the market size provided in terms of value or volume?
The market size is provided in terms of value, measured in N/A.
11. Are there any specific market keywords associated with the report?
Yes, the market keyword associated with the report is "Non-Hodgkin Lymphoma Treatment," which aids in identifying and referencing the specific market segment covered.
12. How do I determine which pricing option suits my needs best?
The pricing options vary based on user requirements and access needs. Individual users may opt for single-user licenses, while businesses requiring broader access may choose multi-user or enterprise licenses for cost-effective access to the report.
13. Are there any additional resources or data provided in the Non-Hodgkin Lymphoma Treatment report?
While the report offers comprehensive insights, it's advisable to review the specific contents or supplementary materials provided to ascertain if additional resources or data are available.
14. How can I stay updated on further developments or reports in the Non-Hodgkin Lymphoma Treatment?
To stay informed about further developments, trends, and reports in the Non-Hodgkin Lymphoma Treatment, consider subscribing to industry newsletters, following relevant companies and organizations, or regularly checking reputable industry news sources and publications.
Methodology
Step 1 - Identification of Relevant Samples Size from Population Database


Step 2 - Approaches for Defining Global Market Size (Value, Volume* & Price*)

Note*: In applicable scenarios
Step 3 - Data Sources
Primary Research
- Web Analytics
- Survey Reports
- Research Institute
- Latest Research Reports
- Opinion Leaders
Secondary Research
- Annual Reports
- White Paper
- Latest Press Release
- Industry Association
- Paid Database
- Investor Presentations

Step 4 - Data Triangulation
Involves using different sources of information in order to increase the validity of a study
These sources are likely to be stakeholders in a program - participants, other researchers, program staff, other community members, and so on.
Then we put all data in single framework & apply various statistical tools to find out the dynamic on the market.
During the analysis stage, feedback from the stakeholder groups would be compared to determine areas of agreement as well as areas of divergence