

Key Insights
The global Non-opioid Pain Patch market is poised for robust expansion, projected to reach an estimated $3.7 billion in 2025, with a healthy Compound Annual Growth Rate (CAGR) of 4.1% anticipated over the forecast period of 2025-2033. This growth is primarily fueled by the increasing global prevalence of chronic pain conditions, a growing preference for localized drug delivery systems that minimize systemic side effects, and a significant shift away from opioid-based pain management due to concerns over addiction and abuse. The market's dynamism is further propelled by continuous innovation in patch technology, offering enhanced drug permeation, patient comfort, and sustained release mechanisms. Advancements in formulations, including the incorporation of novel active ingredients and improved adhesive technologies, are also contributing to market buoyancy. The rising healthcare expenditure worldwide and expanding access to advanced pain management solutions in emerging economies are also significant drivers.
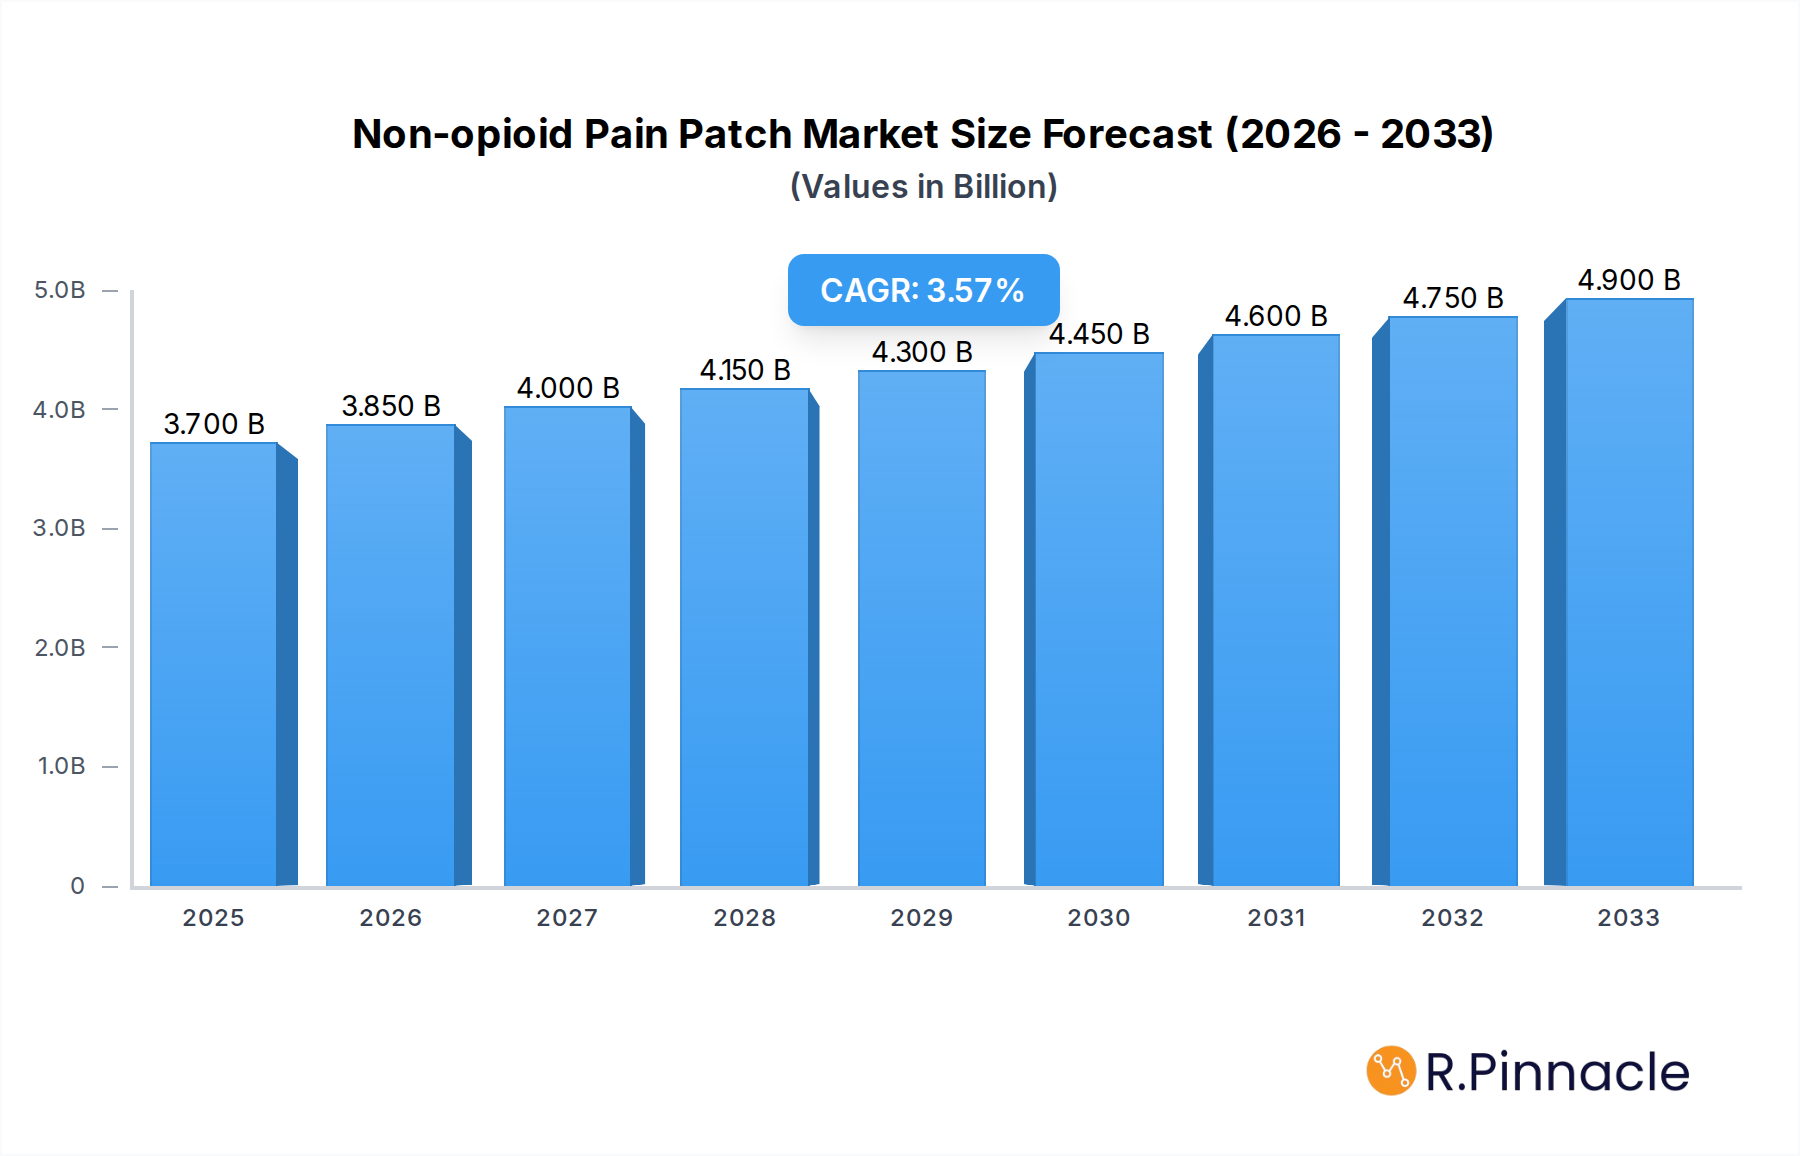
Non-opioid Pain Patch Market Size (In Billion)
The market is strategically segmented across various applications, including Over-the-Counter (OTC) and Prescription (Rx) products, catering to a broad spectrum of pain relief needs. Key product types dominating the landscape include Lidocaine Patches, Diclofenac Patches, Indomethacin Patches, and Counter-Irritant Patches, with emerging technologies and specialized formulations also finding their niche. Restraints, such as the high cost of research and development for new patch formulations and potential skin irritation issues, are being actively addressed through technological advancements and improved material science. Key players like Hisamitsu, Mylan, Johnson & Johnson, Sanofi, and Novartis are actively engaged in product development and strategic collaborations, aiming to capture a larger market share by offering diverse and effective pain relief solutions. The Asia Pacific region, driven by China and India, is expected to witness substantial growth due to a large patient pool and increasing healthcare infrastructure.

Non-opioid Pain Patch Company Market Share
This in-depth report provides a thorough analysis of the global non-opioid pain patch market, offering critical insights for stakeholders navigating this dynamic sector. Covering the historical period from 2019 to 2024 and projecting trends up to 2033, with a base and estimated year of 2025, this research delves into market structure, dynamics, regional dominance, product innovations, and future outlook. With an estimated market value of X billion in 2025, growing at a projected Compound Annual Growth Rate (CAGR) of XX%, this report offers actionable intelligence to drive strategic decision-making.
Non-opioid Pain Patch Market Structure & Innovation Trends
The non-opioid pain patch market exhibits a XX% market concentration, with a mix of established pharmaceutical giants and specialized players. Innovation drivers are primarily focused on enhancing drug delivery mechanisms, improving adhesion, and developing novel therapeutic compounds to address diverse pain conditions. Regulatory frameworks are increasingly emphasizing patient safety and efficacy, impacting product development and approval timelines. Product substitutes, including oral analgesics and other topical treatments, exert moderate competitive pressure. End-user demographics reveal a growing preference for non-invasive pain management solutions among aging populations and individuals seeking alternatives to opioids. Mergers & Acquisitions (M&A) activities are strategically focused on acquiring innovative technologies and expanding market reach, with XX billion in M&A deal values recorded during the historical period.
Non-opioid Pain Patch Market Dynamics & Trends
The global non-opioid pain patch market is experiencing robust growth, fueled by a confluence of compelling market growth drivers and transformative technological disruptions. The escalating prevalence of chronic pain conditions, such as osteoarthritis, back pain, and neuropathic pain, coupled with an aging global population, significantly amplifies the demand for effective and convenient pain management solutions. This trend is further bolstered by a growing awareness and preference among consumers for non-opioid alternatives due to concerns surrounding addiction, side effects, and the opioid crisis. Technological advancements in transdermal drug delivery systems are at the forefront, enabling enhanced drug permeation, sustained release, and improved patient compliance. These innovations include the development of advanced patch matrices, microneedle technologies, and iontophoresis systems, leading to more targeted and efficacious pain relief.
Consumer preferences are increasingly shifting towards self-care and at-home treatment options, making transdermal patches an attractive choice for their ease of application and discreet use. The market penetration of non-opioid pain patches is expected to surge as healthcare providers and patients alike seek safer and more sustainable pain management strategies. Competitive dynamics are characterized by intense innovation, strategic partnerships, and a growing emphasis on product differentiation based on therapeutic efficacy, safety profiles, and patient comfort. Pharmaceutical companies are investing heavily in research and development to introduce novel formulations and combination therapies, aiming to capture a larger share of this expanding market. The projected CAGR for the market is XX% during the forecast period, underscoring its significant growth trajectory.
Dominant Regions & Segments in Non-opioid Pain Patch
North America currently holds the dominant position in the global non-opioid pain patch market, driven by a high prevalence of chronic pain, a well-established healthcare infrastructure, and strong market penetration of advanced pain management therapies. Within North America, the United States spearheads market growth due to significant healthcare expenditure, a large aging population susceptible to chronic pain conditions, and a proactive regulatory environment that encourages the development and adoption of novel pain relief solutions.
Key Drivers of Dominance:
- Economic Policies: Favorable reimbursement policies and consistent healthcare spending in the US and Canada support the uptake of prescription and over-the-counter (OTC) pain management products.
- Healthcare Infrastructure: A robust network of hospitals, clinics, and pharmacies ensures widespread availability and accessibility of non-opioid pain patches.
- Research & Development Investment: Significant investments in pharmaceutical R&D by leading companies in the region foster continuous innovation and product diversification.
- Consumer Awareness and Demand: High public awareness of pain management options and a preference for non-opioid alternatives further propel market growth.
Segment Dominance Analysis:
- Application: The OTC segment is exhibiting significant growth, driven by increased accessibility and patient self-management of minor to moderate pain. However, the Rx segment remains a substantial contributor, particularly for severe chronic pain management requiring physician oversight and specialized formulations.
- Types: Lidocaine Patches and Diclofenac Patches currently dominate the market due to their widespread use in managing localized pain and inflammation. Their established efficacy, favorable safety profiles, and broad clinical applications contribute to their market leadership.
- Lidocaine Patches: Widely prescribed for neuropathic pain, post-herpetic neuralgia, and localized musculoskeletal pain.
- Diclofenac Patches: Commonly used for osteoarthritis and other inflammatory joint conditions, offering targeted pain relief with reduced systemic side effects.
- Indomethacin Patches, Counter-Irritant Patches, and Other categories are also gaining traction as therapeutic options diversify and patient needs become more specific. The market is also seeing a surge in the development of patches for specific conditions, indicating a trend towards personalized pain management.
Non-opioid Pain Patch Product Innovations
Product innovations in the non-opioid pain patch market are centered on improving therapeutic efficacy and patient experience. Developments include novel drug formulations for sustained and targeted release of active ingredients like lidocaine and diclofenac, enhancing their bioavailability and reducing application frequency. Advanced adhesive technologies are also a key focus, ensuring better skin compatibility, longer wear times, and reduced irritation. Furthermore, the integration of natural ingredients in counter-irritant patches and the exploration of combinations of analgesics and anti-inflammatories are offering competitive advantages by catering to diverse patient needs and preferences for natural or multi-modal pain relief.
Report Scope & Segmentation Analysis
The non-opioid pain patch market is meticulously segmented to provide granular insights. The Application segmentation divides the market into Over-the-Counter (OTC) and Prescription (Rx) categories, each addressing different pain severities and accessibility levels. The Types segmentation encompasses Lidocaine Patches, Diclofenac Patches, Indomethacin Patches, Counter-Irritant Patches, Fentanyl Patches (though often associated with opioids, some formulations are explored in non-opioid contexts or as alternatives), and Others, which include emerging formulations and niche product categories. Each segment presents distinct growth projections and market sizes, influenced by evolving treatment protocols, regulatory approvals, and consumer demand for specific pain relief mechanisms. Competitive dynamics within each segment are analyzed to understand market share, R&D focus, and strategic positioning.
Key Drivers of Non-opioid Pain Patch Growth
The growth of the non-opioid pain patch market is propelled by several interconnected factors. The global rise in the incidence of chronic pain conditions, such as arthritis and back pain, directly fuels demand for effective pain management solutions. A significant driver is the increasing global awareness and concern surrounding the opioid crisis, leading to a strong preference for safer, non-addictive pain relief alternatives. Technological advancements in transdermal drug delivery systems are crucial, enabling enhanced drug absorption, sustained release, and improved patient convenience. Furthermore, favorable reimbursement policies and supportive regulatory landscapes in key markets encourage the development and adoption of these products.
Challenges in the Non-opioid Pain Patch Sector
Despite its robust growth, the non-opioid pain patch sector faces several challenges. Regulatory hurdles and the rigorous approval processes for new drug formulations and delivery systems can lead to extended development timelines and significant R&D costs. Supply chain disruptions, particularly for specialized raw materials and manufacturing components, can impact production volumes and timely market availability. Intense competition from established oral pain relievers and other topical treatments necessitates continuous innovation and competitive pricing strategies. Additionally, ensuring optimal drug permeation and patient adherence, especially for localized pain management, remains an ongoing area of product development focus.
Emerging Opportunities in Non-opioid Pain Patch
Emerging opportunities in the non-opioid pain patch market are multifaceted. The development of patches incorporating novel therapeutic agents, such as cannabinoids or advanced anti-inflammatory compounds, presents significant potential. Expansion into emerging economies with growing middle classes and increasing healthcare access offers substantial untapped markets. The rise of personalized medicine is also creating opportunities for customized pain patch formulations tailored to individual patient needs and pain profiles. Furthermore, advancements in wearable technology and smart patches could integrate monitoring capabilities, enhancing patient engagement and treatment effectiveness.
Leading Players in the Non-opioid Pain Patch Market
- Hisamitsu
- Mylan
- Johnson & Johnson
- Actavis
- Lingrui
- Teikoku Seiyaku
- Sanofi
- Novartis
- Qizheng
- Endo
- Huarun 999
- GSK
- Haw Par
- Nichiban
- Mentholatum
- Laboratoires Genevrier
- BLUE-EMU
Key Developments in Non-opioid Pain Patch Industry
- 2024: Launch of advanced diclofenac patch with improved adhesion and extended wear time by Hisamitsu.
- 2023: Mylan announces strategic partnership to develop novel lidocaine patch formulations for neuropathic pain.
- 2023: Johnson & Johnson receives regulatory approval for a new counter-irritant patch targeting muscle and joint pain.
- 2022: Lingrui Pharmaceutical expands its pain management portfolio with a new indomethacin patch for inflammatory conditions.
- 2022: Teikoku Seiyaku introduces a microneedle-based pain patch for enhanced transdermal delivery.
- 2021: Sanofi invests in R&D for innovative topical analgesics to address the growing demand for non-opioid options.
- 2021: Novartis explores combination therapies in transdermal patches for chronic pain management.
- 2020: Qizheng Drug Company focuses on expanding its presence in the OTC pain relief patch market.
- 2020: Endo Pharmaceuticals enhances its pipeline with a focus on non-opioid pain management solutions.
- 2019: Huarun 999 strengthens its market position with the introduction of a new topical analgesic patch.
Future Outlook for Non-opioid Pain Patch Market
The future outlook for the non-opioid pain patch market is exceptionally promising, driven by sustained innovation and an increasing global imperative for safer pain management. Growth accelerators include the continuous development of more sophisticated drug delivery systems, the exploration of novel therapeutic compounds, and the expansion of product applications into niche pain indications. The market is poised for significant expansion in emerging economies as healthcare access improves and awareness of advanced pain management options grows. Strategic partnerships, mergers, and acquisitions will continue to shape the competitive landscape, enabling companies to leverage synergistic strengths and expand their global reach, ensuring robust market growth and improved patient outcomes in the years to come.
Non-opioid Pain Patch Segmentation
-
1. Application
- 1.1. OTC
- 1.2. Rx
-
2. Types
- 2.1. Lidocaine Patches
- 2.2. Diclofenac Patches
- 2.3. Indomethacin Patches
- 2.4. Counter-Irritant Patches
- 2.5. Fentanyl Patches
- 2.6. Others
Non-opioid Pain Patch Segmentation By Geography
-
1. North America
- 1.1. United States
- 1.2. Canada
- 1.3. Mexico
-
2. South America
- 2.1. Brazil
- 2.2. Argentina
- 2.3. Rest of South America
-
3. Europe
- 3.1. United Kingdom
- 3.2. Germany
- 3.3. France
- 3.4. Italy
- 3.5. Spain
- 3.6. Russia
- 3.7. Benelux
- 3.8. Nordics
- 3.9. Rest of Europe
-
4. Middle East & Africa
- 4.1. Turkey
- 4.2. Israel
- 4.3. GCC
- 4.4. North Africa
- 4.5. South Africa
- 4.6. Rest of Middle East & Africa
-
5. Asia Pacific
- 5.1. China
- 5.2. India
- 5.3. Japan
- 5.4. South Korea
- 5.5. ASEAN
- 5.6. Oceania
- 5.7. Rest of Asia Pacific
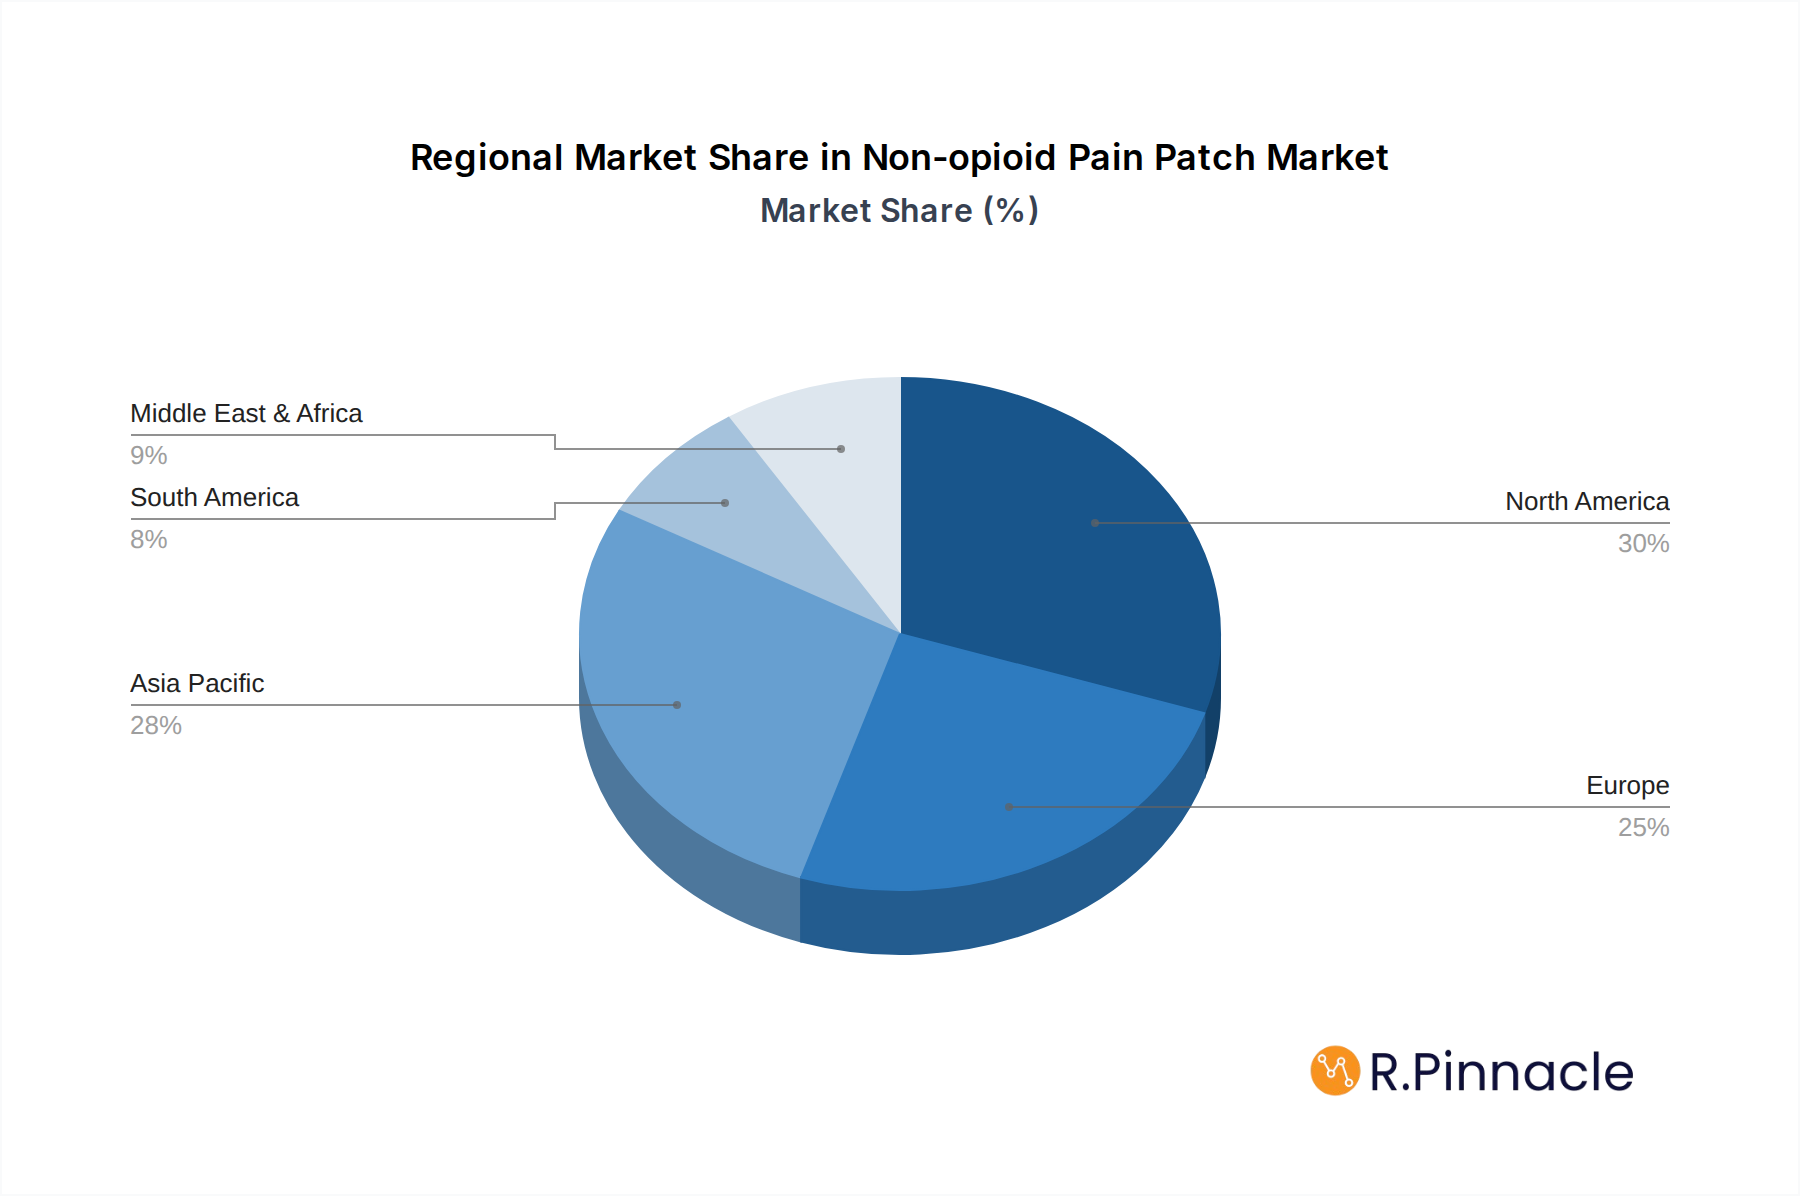
Non-opioid Pain Patch Regional Market Share
Geographic Coverage of Non-opioid Pain Patch
Non-opioid Pain Patch REPORT HIGHLIGHTS
| Aspects | Details |
|---|---|
| Study Period | 2020-2034 |
| Base Year | 2025 |
| Estimated Year | 2026 |
| Forecast Period | 2026-2034 |
| Historical Period | 2020-2025 |
| Growth Rate | CAGR of 4.1% from 2020-2034 |
| Segmentation |
|
Table of Contents
- 1. Introduction
- 1.1. Research Scope
- 1.2. Market Segmentation
- 1.3. Research Methodology
- 1.4. Definitions and Assumptions
- 2. Executive Summary
- 2.1. Introduction
- 3. Market Dynamics
- 3.1. Introduction
- 3.2. Market Drivers
- 3.3. Market Restrains
- 3.4. Market Trends
- 4. Market Factor Analysis
- 4.1. Porters Five Forces
- 4.2. Supply/Value Chain
- 4.3. PESTEL analysis
- 4.4. Market Entropy
- 4.5. Patent/Trademark Analysis
- 5. Global Non-opioid Pain Patch Analysis, Insights and Forecast, 2020-2032
- 5.1. Market Analysis, Insights and Forecast - by Application
- 5.1.1. OTC
- 5.1.2. Rx
- 5.2. Market Analysis, Insights and Forecast - by Types
- 5.2.1. Lidocaine Patches
- 5.2.2. Diclofenac Patches
- 5.2.3. Indomethacin Patches
- 5.2.4. Counter-Irritant Patches
- 5.2.5. Fentanyl Patches
- 5.2.6. Others
- 5.3. Market Analysis, Insights and Forecast - by Region
- 5.3.1. North America
- 5.3.2. South America
- 5.3.3. Europe
- 5.3.4. Middle East & Africa
- 5.3.5. Asia Pacific
- 5.1. Market Analysis, Insights and Forecast - by Application
- 6. North America Non-opioid Pain Patch Analysis, Insights and Forecast, 2020-2032
- 6.1. Market Analysis, Insights and Forecast - by Application
- 6.1.1. OTC
- 6.1.2. Rx
- 6.2. Market Analysis, Insights and Forecast - by Types
- 6.2.1. Lidocaine Patches
- 6.2.2. Diclofenac Patches
- 6.2.3. Indomethacin Patches
- 6.2.4. Counter-Irritant Patches
- 6.2.5. Fentanyl Patches
- 6.2.6. Others
- 6.1. Market Analysis, Insights and Forecast - by Application
- 7. South America Non-opioid Pain Patch Analysis, Insights and Forecast, 2020-2032
- 7.1. Market Analysis, Insights and Forecast - by Application
- 7.1.1. OTC
- 7.1.2. Rx
- 7.2. Market Analysis, Insights and Forecast - by Types
- 7.2.1. Lidocaine Patches
- 7.2.2. Diclofenac Patches
- 7.2.3. Indomethacin Patches
- 7.2.4. Counter-Irritant Patches
- 7.2.5. Fentanyl Patches
- 7.2.6. Others
- 7.1. Market Analysis, Insights and Forecast - by Application
- 8. Europe Non-opioid Pain Patch Analysis, Insights and Forecast, 2020-2032
- 8.1. Market Analysis, Insights and Forecast - by Application
- 8.1.1. OTC
- 8.1.2. Rx
- 8.2. Market Analysis, Insights and Forecast - by Types
- 8.2.1. Lidocaine Patches
- 8.2.2. Diclofenac Patches
- 8.2.3. Indomethacin Patches
- 8.2.4. Counter-Irritant Patches
- 8.2.5. Fentanyl Patches
- 8.2.6. Others
- 8.1. Market Analysis, Insights and Forecast - by Application
- 9. Middle East & Africa Non-opioid Pain Patch Analysis, Insights and Forecast, 2020-2032
- 9.1. Market Analysis, Insights and Forecast - by Application
- 9.1.1. OTC
- 9.1.2. Rx
- 9.2. Market Analysis, Insights and Forecast - by Types
- 9.2.1. Lidocaine Patches
- 9.2.2. Diclofenac Patches
- 9.2.3. Indomethacin Patches
- 9.2.4. Counter-Irritant Patches
- 9.2.5. Fentanyl Patches
- 9.2.6. Others
- 9.1. Market Analysis, Insights and Forecast - by Application
- 10. Asia Pacific Non-opioid Pain Patch Analysis, Insights and Forecast, 2020-2032
- 10.1. Market Analysis, Insights and Forecast - by Application
- 10.1.1. OTC
- 10.1.2. Rx
- 10.2. Market Analysis, Insights and Forecast - by Types
- 10.2.1. Lidocaine Patches
- 10.2.2. Diclofenac Patches
- 10.2.3. Indomethacin Patches
- 10.2.4. Counter-Irritant Patches
- 10.2.5. Fentanyl Patches
- 10.2.6. Others
- 10.1. Market Analysis, Insights and Forecast - by Application
- 11. Competitive Analysis
- 11.1. Global Market Share Analysis 2025
- 11.2. Company Profiles
- 11.2.1 Hisamitsu
- 11.2.1.1. Overview
- 11.2.1.2. Products
- 11.2.1.3. SWOT Analysis
- 11.2.1.4. Recent Developments
- 11.2.1.5. Financials (Based on Availability)
- 11.2.2 Mylan
- 11.2.2.1. Overview
- 11.2.2.2. Products
- 11.2.2.3. SWOT Analysis
- 11.2.2.4. Recent Developments
- 11.2.2.5. Financials (Based on Availability)
- 11.2.3 Johnson & Johnson
- 11.2.3.1. Overview
- 11.2.3.2. Products
- 11.2.3.3. SWOT Analysis
- 11.2.3.4. Recent Developments
- 11.2.3.5. Financials (Based on Availability)
- 11.2.4 Actavis
- 11.2.4.1. Overview
- 11.2.4.2. Products
- 11.2.4.3. SWOT Analysis
- 11.2.4.4. Recent Developments
- 11.2.4.5. Financials (Based on Availability)
- 11.2.5 Lingrui
- 11.2.5.1. Overview
- 11.2.5.2. Products
- 11.2.5.3. SWOT Analysis
- 11.2.5.4. Recent Developments
- 11.2.5.5. Financials (Based on Availability)
- 11.2.6 Teikoku Seiyaku
- 11.2.6.1. Overview
- 11.2.6.2. Products
- 11.2.6.3. SWOT Analysis
- 11.2.6.4. Recent Developments
- 11.2.6.5. Financials (Based on Availability)
- 11.2.7 Sanofi
- 11.2.7.1. Overview
- 11.2.7.2. Products
- 11.2.7.3. SWOT Analysis
- 11.2.7.4. Recent Developments
- 11.2.7.5. Financials (Based on Availability)
- 11.2.8 Novartis
- 11.2.8.1. Overview
- 11.2.8.2. Products
- 11.2.8.3. SWOT Analysis
- 11.2.8.4. Recent Developments
- 11.2.8.5. Financials (Based on Availability)
- 11.2.9 Qizheng
- 11.2.9.1. Overview
- 11.2.9.2. Products
- 11.2.9.3. SWOT Analysis
- 11.2.9.4. Recent Developments
- 11.2.9.5. Financials (Based on Availability)
- 11.2.10 Endo
- 11.2.10.1. Overview
- 11.2.10.2. Products
- 11.2.10.3. SWOT Analysis
- 11.2.10.4. Recent Developments
- 11.2.10.5. Financials (Based on Availability)
- 11.2.11 Huarun 999
- 11.2.11.1. Overview
- 11.2.11.2. Products
- 11.2.11.3. SWOT Analysis
- 11.2.11.4. Recent Developments
- 11.2.11.5. Financials (Based on Availability)
- 11.2.12 GSK
- 11.2.12.1. Overview
- 11.2.12.2. Products
- 11.2.12.3. SWOT Analysis
- 11.2.12.4. Recent Developments
- 11.2.12.5. Financials (Based on Availability)
- 11.2.13 Haw Par
- 11.2.13.1. Overview
- 11.2.13.2. Products
- 11.2.13.3. SWOT Analysis
- 11.2.13.4. Recent Developments
- 11.2.13.5. Financials (Based on Availability)
- 11.2.14 Nichiban
- 11.2.14.1. Overview
- 11.2.14.2. Products
- 11.2.14.3. SWOT Analysis
- 11.2.14.4. Recent Developments
- 11.2.14.5. Financials (Based on Availability)
- 11.2.15 Mentholatum
- 11.2.15.1. Overview
- 11.2.15.2. Products
- 11.2.15.3. SWOT Analysis
- 11.2.15.4. Recent Developments
- 11.2.15.5. Financials (Based on Availability)
- 11.2.16 Laboratoires Genevrier
- 11.2.16.1. Overview
- 11.2.16.2. Products
- 11.2.16.3. SWOT Analysis
- 11.2.16.4. Recent Developments
- 11.2.16.5. Financials (Based on Availability)
- 11.2.17 BLUE-EMU
- 11.2.17.1. Overview
- 11.2.17.2. Products
- 11.2.17.3. SWOT Analysis
- 11.2.17.4. Recent Developments
- 11.2.17.5. Financials (Based on Availability)
- 11.2.1 Hisamitsu
List of Figures
- Figure 1: Global Non-opioid Pain Patch Revenue Breakdown (billion, %) by Region 2025 & 2033
- Figure 2: Global Non-opioid Pain Patch Volume Breakdown (K, %) by Region 2025 & 2033
- Figure 3: North America Non-opioid Pain Patch Revenue (billion), by Application 2025 & 2033
- Figure 4: North America Non-opioid Pain Patch Volume (K), by Application 2025 & 2033
- Figure 5: North America Non-opioid Pain Patch Revenue Share (%), by Application 2025 & 2033
- Figure 6: North America Non-opioid Pain Patch Volume Share (%), by Application 2025 & 2033
- Figure 7: North America Non-opioid Pain Patch Revenue (billion), by Types 2025 & 2033
- Figure 8: North America Non-opioid Pain Patch Volume (K), by Types 2025 & 2033
- Figure 9: North America Non-opioid Pain Patch Revenue Share (%), by Types 2025 & 2033
- Figure 10: North America Non-opioid Pain Patch Volume Share (%), by Types 2025 & 2033
- Figure 11: North America Non-opioid Pain Patch Revenue (billion), by Country 2025 & 2033
- Figure 12: North America Non-opioid Pain Patch Volume (K), by Country 2025 & 2033
- Figure 13: North America Non-opioid Pain Patch Revenue Share (%), by Country 2025 & 2033
- Figure 14: North America Non-opioid Pain Patch Volume Share (%), by Country 2025 & 2033
- Figure 15: South America Non-opioid Pain Patch Revenue (billion), by Application 2025 & 2033
- Figure 16: South America Non-opioid Pain Patch Volume (K), by Application 2025 & 2033
- Figure 17: South America Non-opioid Pain Patch Revenue Share (%), by Application 2025 & 2033
- Figure 18: South America Non-opioid Pain Patch Volume Share (%), by Application 2025 & 2033
- Figure 19: South America Non-opioid Pain Patch Revenue (billion), by Types 2025 & 2033
- Figure 20: South America Non-opioid Pain Patch Volume (K), by Types 2025 & 2033
- Figure 21: South America Non-opioid Pain Patch Revenue Share (%), by Types 2025 & 2033
- Figure 22: South America Non-opioid Pain Patch Volume Share (%), by Types 2025 & 2033
- Figure 23: South America Non-opioid Pain Patch Revenue (billion), by Country 2025 & 2033
- Figure 24: South America Non-opioid Pain Patch Volume (K), by Country 2025 & 2033
- Figure 25: South America Non-opioid Pain Patch Revenue Share (%), by Country 2025 & 2033
- Figure 26: South America Non-opioid Pain Patch Volume Share (%), by Country 2025 & 2033
- Figure 27: Europe Non-opioid Pain Patch Revenue (billion), by Application 2025 & 2033
- Figure 28: Europe Non-opioid Pain Patch Volume (K), by Application 2025 & 2033
- Figure 29: Europe Non-opioid Pain Patch Revenue Share (%), by Application 2025 & 2033
- Figure 30: Europe Non-opioid Pain Patch Volume Share (%), by Application 2025 & 2033
- Figure 31: Europe Non-opioid Pain Patch Revenue (billion), by Types 2025 & 2033
- Figure 32: Europe Non-opioid Pain Patch Volume (K), by Types 2025 & 2033
- Figure 33: Europe Non-opioid Pain Patch Revenue Share (%), by Types 2025 & 2033
- Figure 34: Europe Non-opioid Pain Patch Volume Share (%), by Types 2025 & 2033
- Figure 35: Europe Non-opioid Pain Patch Revenue (billion), by Country 2025 & 2033
- Figure 36: Europe Non-opioid Pain Patch Volume (K), by Country 2025 & 2033
- Figure 37: Europe Non-opioid Pain Patch Revenue Share (%), by Country 2025 & 2033
- Figure 38: Europe Non-opioid Pain Patch Volume Share (%), by Country 2025 & 2033
- Figure 39: Middle East & Africa Non-opioid Pain Patch Revenue (billion), by Application 2025 & 2033
- Figure 40: Middle East & Africa Non-opioid Pain Patch Volume (K), by Application 2025 & 2033
- Figure 41: Middle East & Africa Non-opioid Pain Patch Revenue Share (%), by Application 2025 & 2033
- Figure 42: Middle East & Africa Non-opioid Pain Patch Volume Share (%), by Application 2025 & 2033
- Figure 43: Middle East & Africa Non-opioid Pain Patch Revenue (billion), by Types 2025 & 2033
- Figure 44: Middle East & Africa Non-opioid Pain Patch Volume (K), by Types 2025 & 2033
- Figure 45: Middle East & Africa Non-opioid Pain Patch Revenue Share (%), by Types 2025 & 2033
- Figure 46: Middle East & Africa Non-opioid Pain Patch Volume Share (%), by Types 2025 & 2033
- Figure 47: Middle East & Africa Non-opioid Pain Patch Revenue (billion), by Country 2025 & 2033
- Figure 48: Middle East & Africa Non-opioid Pain Patch Volume (K), by Country 2025 & 2033
- Figure 49: Middle East & Africa Non-opioid Pain Patch Revenue Share (%), by Country 2025 & 2033
- Figure 50: Middle East & Africa Non-opioid Pain Patch Volume Share (%), by Country 2025 & 2033
- Figure 51: Asia Pacific Non-opioid Pain Patch Revenue (billion), by Application 2025 & 2033
- Figure 52: Asia Pacific Non-opioid Pain Patch Volume (K), by Application 2025 & 2033
- Figure 53: Asia Pacific Non-opioid Pain Patch Revenue Share (%), by Application 2025 & 2033
- Figure 54: Asia Pacific Non-opioid Pain Patch Volume Share (%), by Application 2025 & 2033
- Figure 55: Asia Pacific Non-opioid Pain Patch Revenue (billion), by Types 2025 & 2033
- Figure 56: Asia Pacific Non-opioid Pain Patch Volume (K), by Types 2025 & 2033
- Figure 57: Asia Pacific Non-opioid Pain Patch Revenue Share (%), by Types 2025 & 2033
- Figure 58: Asia Pacific Non-opioid Pain Patch Volume Share (%), by Types 2025 & 2033
- Figure 59: Asia Pacific Non-opioid Pain Patch Revenue (billion), by Country 2025 & 2033
- Figure 60: Asia Pacific Non-opioid Pain Patch Volume (K), by Country 2025 & 2033
- Figure 61: Asia Pacific Non-opioid Pain Patch Revenue Share (%), by Country 2025 & 2033
- Figure 62: Asia Pacific Non-opioid Pain Patch Volume Share (%), by Country 2025 & 2033
List of Tables
- Table 1: Global Non-opioid Pain Patch Revenue billion Forecast, by Application 2020 & 2033
- Table 2: Global Non-opioid Pain Patch Volume K Forecast, by Application 2020 & 2033
- Table 3: Global Non-opioid Pain Patch Revenue billion Forecast, by Types 2020 & 2033
- Table 4: Global Non-opioid Pain Patch Volume K Forecast, by Types 2020 & 2033
- Table 5: Global Non-opioid Pain Patch Revenue billion Forecast, by Region 2020 & 2033
- Table 6: Global Non-opioid Pain Patch Volume K Forecast, by Region 2020 & 2033
- Table 7: Global Non-opioid Pain Patch Revenue billion Forecast, by Application 2020 & 2033
- Table 8: Global Non-opioid Pain Patch Volume K Forecast, by Application 2020 & 2033
- Table 9: Global Non-opioid Pain Patch Revenue billion Forecast, by Types 2020 & 2033
- Table 10: Global Non-opioid Pain Patch Volume K Forecast, by Types 2020 & 2033
- Table 11: Global Non-opioid Pain Patch Revenue billion Forecast, by Country 2020 & 2033
- Table 12: Global Non-opioid Pain Patch Volume K Forecast, by Country 2020 & 2033
- Table 13: United States Non-opioid Pain Patch Revenue (billion) Forecast, by Application 2020 & 2033
- Table 14: United States Non-opioid Pain Patch Volume (K) Forecast, by Application 2020 & 2033
- Table 15: Canada Non-opioid Pain Patch Revenue (billion) Forecast, by Application 2020 & 2033
- Table 16: Canada Non-opioid Pain Patch Volume (K) Forecast, by Application 2020 & 2033
- Table 17: Mexico Non-opioid Pain Patch Revenue (billion) Forecast, by Application 2020 & 2033
- Table 18: Mexico Non-opioid Pain Patch Volume (K) Forecast, by Application 2020 & 2033
- Table 19: Global Non-opioid Pain Patch Revenue billion Forecast, by Application 2020 & 2033
- Table 20: Global Non-opioid Pain Patch Volume K Forecast, by Application 2020 & 2033
- Table 21: Global Non-opioid Pain Patch Revenue billion Forecast, by Types 2020 & 2033
- Table 22: Global Non-opioid Pain Patch Volume K Forecast, by Types 2020 & 2033
- Table 23: Global Non-opioid Pain Patch Revenue billion Forecast, by Country 2020 & 2033
- Table 24: Global Non-opioid Pain Patch Volume K Forecast, by Country 2020 & 2033
- Table 25: Brazil Non-opioid Pain Patch Revenue (billion) Forecast, by Application 2020 & 2033
- Table 26: Brazil Non-opioid Pain Patch Volume (K) Forecast, by Application 2020 & 2033
- Table 27: Argentina Non-opioid Pain Patch Revenue (billion) Forecast, by Application 2020 & 2033
- Table 28: Argentina Non-opioid Pain Patch Volume (K) Forecast, by Application 2020 & 2033
- Table 29: Rest of South America Non-opioid Pain Patch Revenue (billion) Forecast, by Application 2020 & 2033
- Table 30: Rest of South America Non-opioid Pain Patch Volume (K) Forecast, by Application 2020 & 2033
- Table 31: Global Non-opioid Pain Patch Revenue billion Forecast, by Application 2020 & 2033
- Table 32: Global Non-opioid Pain Patch Volume K Forecast, by Application 2020 & 2033
- Table 33: Global Non-opioid Pain Patch Revenue billion Forecast, by Types 2020 & 2033
- Table 34: Global Non-opioid Pain Patch Volume K Forecast, by Types 2020 & 2033
- Table 35: Global Non-opioid Pain Patch Revenue billion Forecast, by Country 2020 & 2033
- Table 36: Global Non-opioid Pain Patch Volume K Forecast, by Country 2020 & 2033
- Table 37: United Kingdom Non-opioid Pain Patch Revenue (billion) Forecast, by Application 2020 & 2033
- Table 38: United Kingdom Non-opioid Pain Patch Volume (K) Forecast, by Application 2020 & 2033
- Table 39: Germany Non-opioid Pain Patch Revenue (billion) Forecast, by Application 2020 & 2033
- Table 40: Germany Non-opioid Pain Patch Volume (K) Forecast, by Application 2020 & 2033
- Table 41: France Non-opioid Pain Patch Revenue (billion) Forecast, by Application 2020 & 2033
- Table 42: France Non-opioid Pain Patch Volume (K) Forecast, by Application 2020 & 2033
- Table 43: Italy Non-opioid Pain Patch Revenue (billion) Forecast, by Application 2020 & 2033
- Table 44: Italy Non-opioid Pain Patch Volume (K) Forecast, by Application 2020 & 2033
- Table 45: Spain Non-opioid Pain Patch Revenue (billion) Forecast, by Application 2020 & 2033
- Table 46: Spain Non-opioid Pain Patch Volume (K) Forecast, by Application 2020 & 2033
- Table 47: Russia Non-opioid Pain Patch Revenue (billion) Forecast, by Application 2020 & 2033
- Table 48: Russia Non-opioid Pain Patch Volume (K) Forecast, by Application 2020 & 2033
- Table 49: Benelux Non-opioid Pain Patch Revenue (billion) Forecast, by Application 2020 & 2033
- Table 50: Benelux Non-opioid Pain Patch Volume (K) Forecast, by Application 2020 & 2033
- Table 51: Nordics Non-opioid Pain Patch Revenue (billion) Forecast, by Application 2020 & 2033
- Table 52: Nordics Non-opioid Pain Patch Volume (K) Forecast, by Application 2020 & 2033
- Table 53: Rest of Europe Non-opioid Pain Patch Revenue (billion) Forecast, by Application 2020 & 2033
- Table 54: Rest of Europe Non-opioid Pain Patch Volume (K) Forecast, by Application 2020 & 2033
- Table 55: Global Non-opioid Pain Patch Revenue billion Forecast, by Application 2020 & 2033
- Table 56: Global Non-opioid Pain Patch Volume K Forecast, by Application 2020 & 2033
- Table 57: Global Non-opioid Pain Patch Revenue billion Forecast, by Types 2020 & 2033
- Table 58: Global Non-opioid Pain Patch Volume K Forecast, by Types 2020 & 2033
- Table 59: Global Non-opioid Pain Patch Revenue billion Forecast, by Country 2020 & 2033
- Table 60: Global Non-opioid Pain Patch Volume K Forecast, by Country 2020 & 2033
- Table 61: Turkey Non-opioid Pain Patch Revenue (billion) Forecast, by Application 2020 & 2033
- Table 62: Turkey Non-opioid Pain Patch Volume (K) Forecast, by Application 2020 & 2033
- Table 63: Israel Non-opioid Pain Patch Revenue (billion) Forecast, by Application 2020 & 2033
- Table 64: Israel Non-opioid Pain Patch Volume (K) Forecast, by Application 2020 & 2033
- Table 65: GCC Non-opioid Pain Patch Revenue (billion) Forecast, by Application 2020 & 2033
- Table 66: GCC Non-opioid Pain Patch Volume (K) Forecast, by Application 2020 & 2033
- Table 67: North Africa Non-opioid Pain Patch Revenue (billion) Forecast, by Application 2020 & 2033
- Table 68: North Africa Non-opioid Pain Patch Volume (K) Forecast, by Application 2020 & 2033
- Table 69: South Africa Non-opioid Pain Patch Revenue (billion) Forecast, by Application 2020 & 2033
- Table 70: South Africa Non-opioid Pain Patch Volume (K) Forecast, by Application 2020 & 2033
- Table 71: Rest of Middle East & Africa Non-opioid Pain Patch Revenue (billion) Forecast, by Application 2020 & 2033
- Table 72: Rest of Middle East & Africa Non-opioid Pain Patch Volume (K) Forecast, by Application 2020 & 2033
- Table 73: Global Non-opioid Pain Patch Revenue billion Forecast, by Application 2020 & 2033
- Table 74: Global Non-opioid Pain Patch Volume K Forecast, by Application 2020 & 2033
- Table 75: Global Non-opioid Pain Patch Revenue billion Forecast, by Types 2020 & 2033
- Table 76: Global Non-opioid Pain Patch Volume K Forecast, by Types 2020 & 2033
- Table 77: Global Non-opioid Pain Patch Revenue billion Forecast, by Country 2020 & 2033
- Table 78: Global Non-opioid Pain Patch Volume K Forecast, by Country 2020 & 2033
- Table 79: China Non-opioid Pain Patch Revenue (billion) Forecast, by Application 2020 & 2033
- Table 80: China Non-opioid Pain Patch Volume (K) Forecast, by Application 2020 & 2033
- Table 81: India Non-opioid Pain Patch Revenue (billion) Forecast, by Application 2020 & 2033
- Table 82: India Non-opioid Pain Patch Volume (K) Forecast, by Application 2020 & 2033
- Table 83: Japan Non-opioid Pain Patch Revenue (billion) Forecast, by Application 2020 & 2033
- Table 84: Japan Non-opioid Pain Patch Volume (K) Forecast, by Application 2020 & 2033
- Table 85: South Korea Non-opioid Pain Patch Revenue (billion) Forecast, by Application 2020 & 2033
- Table 86: South Korea Non-opioid Pain Patch Volume (K) Forecast, by Application 2020 & 2033
- Table 87: ASEAN Non-opioid Pain Patch Revenue (billion) Forecast, by Application 2020 & 2033
- Table 88: ASEAN Non-opioid Pain Patch Volume (K) Forecast, by Application 2020 & 2033
- Table 89: Oceania Non-opioid Pain Patch Revenue (billion) Forecast, by Application 2020 & 2033
- Table 90: Oceania Non-opioid Pain Patch Volume (K) Forecast, by Application 2020 & 2033
- Table 91: Rest of Asia Pacific Non-opioid Pain Patch Revenue (billion) Forecast, by Application 2020 & 2033
- Table 92: Rest of Asia Pacific Non-opioid Pain Patch Volume (K) Forecast, by Application 2020 & 2033
Frequently Asked Questions
1. What is the projected Compound Annual Growth Rate (CAGR) of the Non-opioid Pain Patch?
The projected CAGR is approximately 4.1%.
2. Which companies are prominent players in the Non-opioid Pain Patch?
Key companies in the market include Hisamitsu, Mylan, Johnson & Johnson, Actavis, Lingrui, Teikoku Seiyaku, Sanofi, Novartis, Qizheng, Endo, Huarun 999, GSK, Haw Par, Nichiban, Mentholatum, Laboratoires Genevrier, BLUE-EMU.
3. What are the main segments of the Non-opioid Pain Patch?
The market segments include Application, Types.
4. Can you provide details about the market size?
The market size is estimated to be USD 3.7 billion as of 2022.
5. What are some drivers contributing to market growth?
N/A
6. What are the notable trends driving market growth?
N/A
7. Are there any restraints impacting market growth?
N/A
8. Can you provide examples of recent developments in the market?
N/A
9. What pricing options are available for accessing the report?
Pricing options include single-user, multi-user, and enterprise licenses priced at USD 3350.00, USD 5025.00, and USD 6700.00 respectively.
10. Is the market size provided in terms of value or volume?
The market size is provided in terms of value, measured in billion and volume, measured in K.
11. Are there any specific market keywords associated with the report?
Yes, the market keyword associated with the report is "Non-opioid Pain Patch," which aids in identifying and referencing the specific market segment covered.
12. How do I determine which pricing option suits my needs best?
The pricing options vary based on user requirements and access needs. Individual users may opt for single-user licenses, while businesses requiring broader access may choose multi-user or enterprise licenses for cost-effective access to the report.
13. Are there any additional resources or data provided in the Non-opioid Pain Patch report?
While the report offers comprehensive insights, it's advisable to review the specific contents or supplementary materials provided to ascertain if additional resources or data are available.
14. How can I stay updated on further developments or reports in the Non-opioid Pain Patch?
To stay informed about further developments, trends, and reports in the Non-opioid Pain Patch, consider subscribing to industry newsletters, following relevant companies and organizations, or regularly checking reputable industry news sources and publications.
Methodology
Step 1 - Identification of Relevant Samples Size from Population Database


Step 2 - Approaches for Defining Global Market Size (Value, Volume* & Price*)

Note*: In applicable scenarios
Step 3 - Data Sources
Primary Research
- Web Analytics
- Survey Reports
- Research Institute
- Latest Research Reports
- Opinion Leaders
Secondary Research
- Annual Reports
- White Paper
- Latest Press Release
- Industry Association
- Paid Database
- Investor Presentations

Step 4 - Data Triangulation
Involves using different sources of information in order to increase the validity of a study
These sources are likely to be stakeholders in a program - participants, other researchers, program staff, other community members, and so on.
Then we put all data in single framework & apply various statistical tools to find out the dynamic on the market.
During the analysis stage, feedback from the stakeholder groups would be compared to determine areas of agreement as well as areas of divergence