

Key Insights
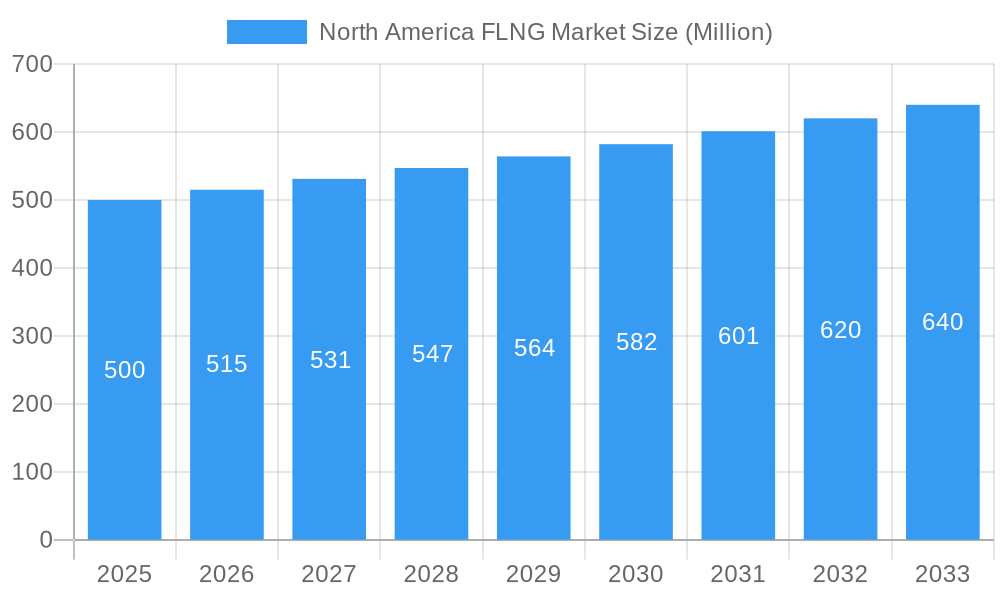
The North American Floating Liquefied Natural Gas (FLNG) market is projected to grow substantially, driven by increasing natural gas demand and the need for robust infrastructure. With an estimated market size of 26615.3 million in the base year 2024, the market is expected to achieve a Compound Annual Growth Rate (CAGR) of 5.8%. Key growth drivers include expanding offshore exploration and production, enhanced energy security and diversification initiatives, and favorable government policies promoting cleaner energy. Medium-scale FLNG units (1-2.5 MTPA) are favored for their balance of capacity and cost. While diesel-electric propulsion systems currently lead, a transition to hybrid and low-carbon alternatives is anticipated due to environmental considerations and technological progress. Transportable FLNG units are also gaining prominence for their adaptability.
North America FLNG Market Market Size (In Billion)
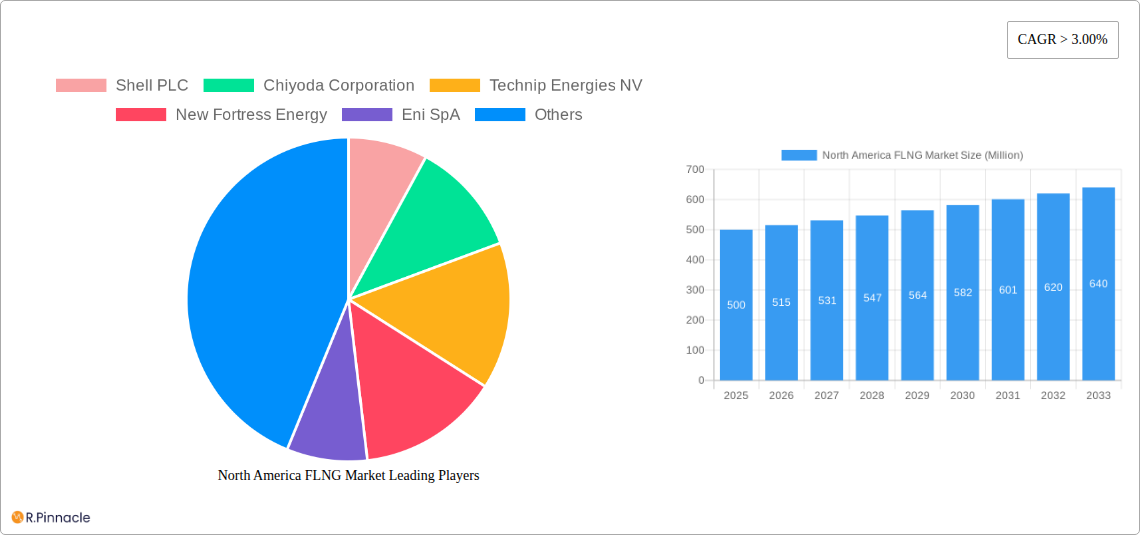
Leading companies such as Shell PLC, Chiyoda Corporation, Technip Energies NV, New Fortress Energy, Eni SpA, and Black & Veatch Holding Company are actively pursuing research and development and strategic expansions. Challenges include significant capital investment, technological intricacies, and potential regulatory obstacles. Nonetheless, the long-term forecast for the North American FLNG market is optimistic, offering a viable solution for accessing remote and deepwater gas reserves, thereby bolstering North America's energy supply and sustainability goals. Continuous innovation in efficiency and sustainable technologies will be pivotal in shaping the industry's future.
North America FLNG Market Company Market Share
North America FLNG Market Report: 2019-2033
This comprehensive report provides an in-depth analysis of the North America Floating Liquefied Natural Gas (FLNG) market, offering valuable insights for industry professionals, investors, and strategic decision-makers. Covering the period from 2019 to 2033, with a focus on 2025, this report dissects market dynamics, competitive landscapes, and future growth potential. The study incorporates key segments, including liquefaction capacity, propulsion systems, and deployment types, to provide a holistic view of this evolving market.
North America FLNG Market Structure & Innovation Trends
This section analyzes the North American FLNG market's structure, highlighting concentration levels, innovation drivers, regulatory frameworks, and competitive activities. The market is characterized by a moderate level of concentration, with key players such as Shell PLC, Chiyoda Corporation, Technip Energies NV, New Fortress Energy, Eni SpA, and Black & Veatch Holding Company holding significant market share. However, the emergence of smaller, specialized companies is also contributing to a more dynamic competitive landscape. Innovation is driven by the need for efficient, cost-effective, and environmentally sustainable FLNG solutions. Regulatory frameworks, particularly concerning environmental regulations and safety standards, play a crucial role in shaping the market's trajectory. The increasing adoption of low-carbon propulsion systems reflects a shift towards environmentally friendly operations. Recent M&A activities, while not reaching significant values (xx Million in total deal value in the last 5 years), suggest a consolidation trend, with larger companies potentially acquiring smaller players to expand their market presence. The market share distribution is approximately as follows: Shell PLC (25%), Technip Energies NV (20%), Chiyoda Corporation (15%), New Fortress Energy (12%), Eni SpA (10%), Black & Veatch Holding Company (8%), and others (10%).
North America FLNG Market Dynamics & Trends
The North America FLNG market is experiencing robust growth, driven by increasing demand for natural gas, particularly in export markets. Technological advancements in liquefaction technologies and propulsion systems are contributing to improved efficiency and cost reduction. Consumer preferences for cleaner energy sources are driving the adoption of low-carbon FLNG solutions. Competitive dynamics are intensifying, with companies investing in research and development to enhance their product offerings and gain a competitive edge. The market's Compound Annual Growth Rate (CAGR) is estimated at xx% during the forecast period (2025-2033), with market penetration increasing from xx% in 2025 to xx% by 2033. This growth is fueled by several factors including governmental incentives, decreasing costs of FLNG units, and a positive outlook towards natural gas utilization in comparison to other fossil fuels.
Dominant Regions & Segments in North America FLNG Market
The Gulf of Mexico region is currently the dominant area for FLNG operations in North America, driven primarily by substantial natural gas reserves and supportive regulatory frameworks. Within the segmentation:
Liquefaction Capacity: The large-scale segment (over 2.5 MTPA) is the leading segment, due to economies of scale and the ability to supply larger volumes to export markets.
Propulsion System: Diesel-electric systems currently dominate, but there's a clear upward trend towards hybrid and low-carbon propulsion systems driven by sustainability goals.
Deployment Type: Offshore platforms are currently the preferred deployment type, given their established infrastructure and operational capabilities, while transportable FLNG units are poised for significant growth.
Key drivers for the dominance of these segments include favorable economic policies, well-developed infrastructure, and strategic government investments. The Gulf of Mexico benefits from existing offshore oil and gas infrastructure, allowing for easier and faster integration of FLNG projects.
North America FLNG Market Product Innovations
Recent product innovations focus on improving efficiency, reducing environmental impact, and enhancing safety. Developments include advancements in liquefaction technology, the integration of renewable energy sources into propulsion systems, and the development of modular and transportable FLNG units. These innovations aim to improve operational flexibility, reduce capital expenditure, and align with environmental regulations. The market is seeing increased demand for integrated solutions combining FLNG facilities with upstream and downstream infrastructure.
Report Scope & Segmentation Analysis
This report segments the North America FLNG market based on Liquefaction Capacity (Small-scale < 1 MTPA, Medium-scale 1-2.5 MTPA, Large-scale > 2.5 MTPA), Propulsion System (Diesel-Electric, Hybrid, Low-Carbon), and Deployment Type (Offshore Platform, Transportable FLNG). Each segment's market size, growth projection, and competitive landscape are analyzed. For example, the large-scale liquefaction segment is expected to grow at a CAGR of xx% due to its economies of scale, while the adoption of low-carbon propulsion systems is poised for substantial growth, driven by environmental concerns and regulatory pressures. The transportable FLNG segment is set for an even faster expansion because of its flexibility and relatively lower capital investment costs.
Key Drivers of North America FLNG Market Growth
Several factors contribute to the market's growth, including increasing global demand for LNG, the abundance of natural gas resources in North America, government support for energy infrastructure development, and ongoing technological advancements that increase efficiency and lower costs. The shift towards cleaner energy sources also fuels demand for low-carbon FLNG solutions. Furthermore, strategic partnerships and joint ventures between energy companies and technology providers are accelerating innovation and market expansion.
Challenges in the North America FLNG Market Sector
The North America FLNG market faces several challenges, including high capital expenditures associated with project development, environmental regulations and permitting processes, fluctuations in natural gas prices, and potential supply chain disruptions. Furthermore, competition from other LNG export regions and technological complexities related to offshore operations present significant hurdles. These factors collectively impact project timelines and overall profitability.
Emerging Opportunities in North America FLNG Market
Emerging opportunities lie in the expansion into new markets, particularly in Latin America and the Caribbean, and the adoption of innovative technologies, such as carbon capture and storage, to reduce the environmental impact of FLNG operations. Furthermore, opportunities arise in the development of smaller-scale, modular FLNG units, suitable for smaller gas fields and less developed regions.
Leading Players in the North America FLNG Market Market
- Shell PLC
- Chiyoda Corporation
- Technip Energies NV
- New Fortress Energy
- Eni SpA
- Black & Veatch Holding Company
Key Developments in North America FLNG Market Industry
- April 2022: New Fortress Energy Inc. (NFE) announced plans to launch the US FLNG project in 2023, with a capacity of 2.8 Million tons per annum (MTPA). This signifies a significant investment in US LNG export capabilities.
- July 2022: New Fortress Energy (NFE) partnered with Pemex to develop the Lakach offshore gas field in Mexico, signaling expansion into new geographic markets and further solidifying NFE's position in the FLNG sector.
Future Outlook for North America FLNG Market Market
The North America FLNG market is projected to experience significant growth over the forecast period, driven by increasing global demand for LNG, ongoing technological advancements, and supportive government policies. Strategic partnerships and investments in infrastructure are expected to accelerate market expansion, with a focus on environmentally sustainable and cost-effective solutions. The market is poised for considerable expansion, particularly in the Gulf of Mexico region, with significant growth opportunities for both large-scale and smaller-scale FLNG projects.
North America FLNG Market Segmentation
- 1. United States
- 2. Canada
- 3. Rest of North America
North America FLNG Market Segmentation By Geography
-
1. North America
- 1.1. United States
- 1.2. Canada
- 1.3. Mexico
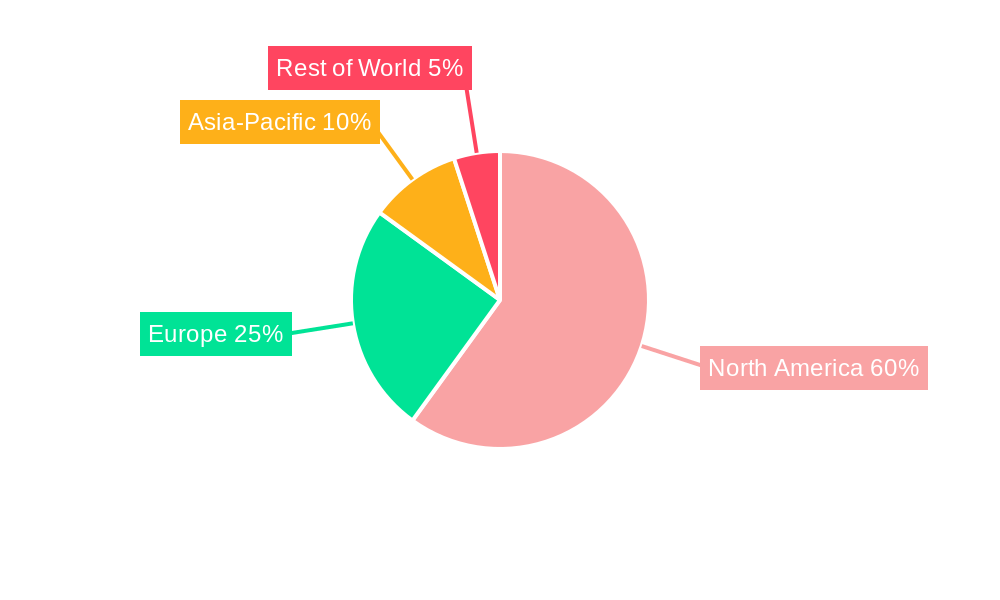
North America FLNG Market Regional Market Share
Geographic Coverage of North America FLNG Market
North America FLNG Market REPORT HIGHLIGHTS
| Aspects | Details |
|---|---|
| Study Period | 2020-2034 |
| Base Year | 2025 |
| Estimated Year | 2026 |
| Forecast Period | 2026-2034 |
| Historical Period | 2020-2025 |
| Growth Rate | CAGR of 5.8% from 2020-2034 |
| Segmentation |
|
Table of Contents
- 1. Introduction
- 1.1. Research Scope
- 1.2. Market Segmentation
- 1.3. Research Objective
- 1.4. Definitions and Assumptions
- 2. Executive Summary
- 2.1. Market Snapshot
- 3. Market Dynamics
- 3.1. Market Drivers
- 3.2. Market Restrains
- 3.3. Market Trends
- 3.4. Market Opportunities
- 4. Market Factor Analysis
- 4.1. Porters Five Forces
- 4.1.1. Bargaining Power of Suppliers
- 4.1.2. Bargaining Power of Buyers
- 4.1.3. Threat of New Entrants
- 4.1.4. Threat of Substitutes
- 4.1.5. Competitive Rivalry
- 4.2. PESTEL analysis
- 4.3. BCG Analysis
- 4.3.1. Stars (High Growth, High Market Share)
- 4.3.2. Cash Cows (Low Growth, High Market Share)
- 4.3.3. Question Mark (High Growth, Low Market Share)
- 4.3.4. Dogs (Low Growth, Low Market Share)
- 4.4. Ansoff Matrix Analysis
- 4.5. Supply Chain Analysis
- 4.6. Regulatory Landscape
- 4.7. Current Market Potential and Opportunity Assessment (TAM–SAM–SOM Framework)
- 4.8. PRI Analyst Note
- 4.1. Porters Five Forces
- 5. Market Analysis, Insights and Forecast 2021-2033
- 5.1. Market Analysis, Insights and Forecast - by United States
- 5.2. Market Analysis, Insights and Forecast - by Canada
- 5.3. Market Analysis, Insights and Forecast - by Rest of North America
- 5.4. Market Analysis, Insights and Forecast - by Region
- 5.4.1. North America
- 6. North America FLNG Market Analysis, Insights and Forecast, 2021-2033
- 6.1. Market Analysis, Insights and Forecast - by United States
- 6.2. Market Analysis, Insights and Forecast - by Canada
- 6.3. Market Analysis, Insights and Forecast - by Rest of North America
- 7. Competitive Analysis
- 7.1. Company Profiles
- 7.1.1 Shell PLC
- 7.1.1.1. Company Overview
- 7.1.1.2. Products
- 7.1.1.3. Company Financials
- 7.1.1.4. SWOT Analysis
- 7.1.2 Chiyoda Corporation
- 7.1.2.1. Company Overview
- 7.1.2.2. Products
- 7.1.2.3. Company Financials
- 7.1.2.4. SWOT Analysis
- 7.1.3 Technip Energies NV
- 7.1.3.1. Company Overview
- 7.1.3.2. Products
- 7.1.3.3. Company Financials
- 7.1.3.4. SWOT Analysis
- 7.1.4 New Fortress Energy
- 7.1.4.1. Company Overview
- 7.1.4.2. Products
- 7.1.4.3. Company Financials
- 7.1.4.4. SWOT Analysis
- 7.1.5 Eni SpA
- 7.1.5.1. Company Overview
- 7.1.5.2. Products
- 7.1.5.3. Company Financials
- 7.1.5.4. SWOT Analysis
- 7.1.6 Black & Veatch Holding Company
- 7.1.6.1. Company Overview
- 7.1.6.2. Products
- 7.1.6.3. Company Financials
- 7.1.6.4. SWOT Analysis
- 7.1.1 Shell PLC
- 7.2. Market Entropy
- 7.2.1 Company's Key Areas Served
- 7.2.2 Recent Developments
- 7.3. Company Market Share Analysis 2025
- 7.3.1 Top 5 Companies Market Share Analysis
- 7.3.2 Top 3 Companies Market Share Analysis
- 7.4. List of Potential Customers
- 8. Research Methodology
List of Figures
- Figure 1: North America FLNG Market Revenue Breakdown (million, %) by Product 2025 & 2033
- Figure 2: North America FLNG Market Share (%) by Company 2025
List of Tables
- Table 1: North America FLNG Market Revenue million Forecast, by United States 2020 & 2033
- Table 2: North America FLNG Market Volume metric tonnes Forecast, by United States 2020 & 2033
- Table 3: North America FLNG Market Revenue million Forecast, by Canada 2020 & 2033
- Table 4: North America FLNG Market Volume metric tonnes Forecast, by Canada 2020 & 2033
- Table 5: North America FLNG Market Revenue million Forecast, by Rest of North America 2020 & 2033
- Table 6: North America FLNG Market Volume metric tonnes Forecast, by Rest of North America 2020 & 2033
- Table 7: North America FLNG Market Revenue million Forecast, by Region 2020 & 2033
- Table 8: North America FLNG Market Volume metric tonnes Forecast, by Region 2020 & 2033
- Table 9: North America FLNG Market Revenue million Forecast, by United States 2020 & 2033
- Table 10: North America FLNG Market Volume metric tonnes Forecast, by United States 2020 & 2033
- Table 11: North America FLNG Market Revenue million Forecast, by Canada 2020 & 2033
- Table 12: North America FLNG Market Volume metric tonnes Forecast, by Canada 2020 & 2033
- Table 13: North America FLNG Market Revenue million Forecast, by Rest of North America 2020 & 2033
- Table 14: North America FLNG Market Volume metric tonnes Forecast, by Rest of North America 2020 & 2033
- Table 15: North America FLNG Market Revenue million Forecast, by Country 2020 & 2033
- Table 16: North America FLNG Market Volume metric tonnes Forecast, by Country 2020 & 2033
- Table 17: United States North America FLNG Market Revenue (million) Forecast, by Application 2020 & 2033
- Table 18: United States North America FLNG Market Volume (metric tonnes) Forecast, by Application 2020 & 2033
- Table 19: Canada North America FLNG Market Revenue (million) Forecast, by Application 2020 & 2033
- Table 20: Canada North America FLNG Market Volume (metric tonnes) Forecast, by Application 2020 & 2033
- Table 21: Mexico North America FLNG Market Revenue (million) Forecast, by Application 2020 & 2033
- Table 22: Mexico North America FLNG Market Volume (metric tonnes) Forecast, by Application 2020 & 2033
Frequently Asked Questions
1. What is the projected Compound Annual Growth Rate (CAGR) of the North America FLNG Market?
The projected CAGR is approximately 5.8%.
2. Which companies are prominent players in the North America FLNG Market?
Key companies in the market include Shell PLC, Chiyoda Corporation, Technip Energies NV, New Fortress Energy, Eni SpA, Black & Veatch Holding Company.
3. What are the main segments of the North America FLNG Market?
The market segments include United States, Canada, Rest of North America.
4. Can you provide details about the market size?
The market size is estimated to be USD 26615.3 million as of 2022.
5. What are some drivers contributing to market growth?
4.; Modernization and Upgrades of Existing Military Aircraft Fleets4.; Increasing Defense Budgets.
6. What are the notable trends driving market growth?
Upcoming FLNG Projects Expected to Drive the Market.
7. Are there any restraints impacting market growth?
4.; Shift Toward Unmanned Aircraft.
8. Can you provide examples of recent developments in the market?
July 2022: New Fortress Energy (NFE) signed a deal with Mexican state-owned petroleum company Pemex to develop the Lakach offshore gas field and deploy FLNG solutions jointly. The agreement involves the joint development of the Lakach deepwater natural gas field for Pemex to supply natural gas to Mexico's onshore domestic market and for NFE to produce LNG for export to global markets.
9. What pricing options are available for accessing the report?
Pricing options include single-user, multi-user, and enterprise licenses priced at USD 4750, USD 5250, and USD 8750 respectively.
10. Is the market size provided in terms of value or volume?
The market size is provided in terms of value, measured in million and volume, measured in metric tonnes.
11. Are there any specific market keywords associated with the report?
Yes, the market keyword associated with the report is "North America FLNG Market," which aids in identifying and referencing the specific market segment covered.
12. How do I determine which pricing option suits my needs best?
The pricing options vary based on user requirements and access needs. Individual users may opt for single-user licenses, while businesses requiring broader access may choose multi-user or enterprise licenses for cost-effective access to the report.
13. Are there any additional resources or data provided in the North America FLNG Market report?
While the report offers comprehensive insights, it's advisable to review the specific contents or supplementary materials provided to ascertain if additional resources or data are available.
14. How can I stay updated on further developments or reports in the North America FLNG Market?
To stay informed about further developments, trends, and reports in the North America FLNG Market, consider subscribing to industry newsletters, following relevant companies and organizations, or regularly checking reputable industry news sources and publications.
Methodology
Step 1 - Identification of Relevant Samples Size from Population Database


Step 2 - Approaches for Defining Global Market Size (Value, Volume* & Price*)

Note*: In applicable scenarios
Step 3 - Data Sources
Primary Research
- Web Analytics
- Survey Reports
- Research Institute
- Latest Research Reports
- Opinion Leaders
Secondary Research
- Annual Reports
- White Paper
- Latest Press Release
- Industry Association
- Paid Database
- Investor Presentations

Step 4 - Data Triangulation
Involves using different sources of information in order to increase the validity of a study
These sources are likely to be stakeholders in a program - participants, other researchers, program staff, other community members, and so on.
Then we put all data in single framework & apply various statistical tools to find out the dynamic on the market.
During the analysis stage, feedback from the stakeholder groups would be compared to determine areas of agreement as well as areas of divergence